Impact Factor ISSN: 1837-9664

 Global reach, higher impact
J Cancer 2012; 3:390-403. doi:10.7150/jca.4280 This volume Cite
Research Paper
Promising Urinary Protein Biomarkers for the Early Detection of Hepatocellular Carcinoma among High-Risk Hepatitis C Virus Egyptian Patients
Moemen AK Abdalla, Yousef Haj-Ahmad ![]()
Centre for Biotechnology, Brock University, St. Catharines, ON, L2S 3A1, Canada.
Received 2012-2-25; Accepted 2012-6-19; Published 2012-9-18
Abstract
Hepatocellular Carcinoma is a major healthcare problem, representing the third most common cause of cancer-related mortality worldwide. There are 130 million Hepatitis C virus infected patients worldwide who are at a high-risk for developing Hepatocellular Carcinoma. Due to the fact that reliable parameters and/or tools for the early detection of Hepatocellular Carcinoma among high-risk individuals are severely lacking, Hepatocellular Carcinoma patients are always diagnosed at a late stage where surgical solutions or effective treatment are not possible. Urine was collected from 106 Hepatitis C infected patients patients, 32 of whom had already developed Hepatocellular Carcinoma and 74 patients who were diagnosed as Hepatocellular Carcinoma -free at the time of initial sample collection. In addition to these patients, urine samples were also collected from 12 healthy control individuals. Total urinary proteins were isolated from the urine samples and LC-MS/MS was used to identify potential protein HCC biomarker candidates. This was followed by validating relative expression levels of proteins present in urine among all the patients using quantitative real time-PCR. This approach revealed that significant over-expression of three proteins: DJ-1, Chromatin Assembly Factor-1 (CAF-1) and Heat Shock Protein 60 (HSP60), was a characteristic event among Hepatocellular Carcinoma - post Hepatitis C virus infected patients. As a single-based Hepatocellular Carcinoma biomarker, CAF-1 over-expression identified Hepatocellular Carcinoma among Hepatitis C virus infected patients with a specificity of 90%, sensitivity of 66% and with an overall diagnostic accuracy of 78%. Moreover, the CAF-1/HSP60 tandem identified Hepatocellular Carcinoma among Hepatitis C virus infected patients with a specificity of 92%, sensitivity of 61% and with an overall diagnostic accuracy of 77%.
Keywords: Liver Cancer. Hepatitis C Virus. Urine. Proteins. Biomarkers
Introduction
Approximately one million deaths annually are due to Hepatocellular Carcinoma (HCC). HCC is the 4th leading cause of cancer death worldwide (1, 2). HCC incidence rates vary geographically, with the highest being found in some regions of Asia and Africa. Developing countries have low HCC incidence rates, however recent studies have unfortunately shown that the incidence rates for HCC are rising (3, 4). Individuals chronically infected with hepatitis B or C virus (HBV, HCV) are at high risk for the development of HCC, with disease progression occurring persistently over many years (5). Even with the availability of an effective HBV vaccine, there are more than 350 million people worldwide who are chronically infected with HBV, including 1.25 million in the USA (6). HCV is also considered a major etiology of HCC and the rising HCV infection rates account for much of the elevated HCC incidence (4). No vaccine is available for the prevention of HCV infection and the Centers for Disease Control (CDC) has classified HCV as an important emerging disease (7). Worldwide, the prevalence of chronic HCV may be as high as 170 million and as many as 2.7 million Americans are chronically infected with HCV (7).
The major potentially curative form of HCC therapy is still surgical resection, however only 10% of patients are at operable stages upon disease discovery. This is mainly due to the absence of reliable tools for early diagnosis and thus most patients were found to be at too late of a stage for either surgical solutions or for effective treatment (8). The widely used serological tumor markers for HCC, α-fetoprotein (AFP) and des-γ-carboxy prothrombin (DCP), lack specificity and sensitivity. AFP specificity and sensitivity are 75% and 68%, respectively, whereas elevated DCP activity is only present in 44-47% of HCCs less than 3 cm in size (9, 10, 11). Most chronically infected patients remain asymptomatic for many years and the long latency between infection and development of HCC provides an important window of time during which individuals can be monitored for disease progression and intervention could be efficient (5). Therefore, the development of non-invasive biomarkers with high sensitivity and specificity that can be used for large-scale clinical investigations and disease monitoring would be highly beneficial.
As a promising powerful biological research technology, proteomics has recently become a chief tool in the identification of disease biomarkers (12). One major advantage of proteomics is its ability to concurrently check the whole proteome or sub-proteomes such that differentially expressed or modified proteins corresponding to a disease condition can be identified. This enables researchers to merge several protein markers together to form panels of protein markers with higher sensitivity and specificity for the detection and screening of a disease. Recently, clinical proteomics has been extensively applied to discover biomarkers for HCC as a consequence to HBV (13, 14) and HCV (15, 16] infections and promising developments have been reported. Protein profiling based on two-dimensional electrophoresis (2D SDS-PAGE) is the gold standard in proteomics for protein profiling; it separates thousands of proteins in a single experiment where potential biomarkers can be identified by comparing the protein profiles between control and HCC samples. Because a cancer proteome is an exceptionally complex biological sample which contains information from almost all the biological activities that take place in cancer cells, cancer tissue microenvironment, and cancer cell-host interaction (17), 2D SDS-PAGE is not suitable as it is time-consuming, technically challenging, requires special concern to achieve tolerable comparability/reproducibility and is not ideal for the analysis of smaller polypeptides (<10 kDa) (18, 19).
As an alternative to 2D SDS-PAGE, the shotgun proteomics “bottom-up approach” has evolved. Shotgun proteomics involve the proteolytic digestion of the protein into relatively small peptides whose m/z can be accurately determined by mass spectrometry. The generated peptides are then separated in one or more successive steps of liquid chromatography, analyzed by tandem MS (MS/MS), and the information is processed with bioinformatic tools to obtain the protein composition of the original sample (20, 21). A major advantage for this approach is that it will simplify the complexity of the cancer proteome as all the proteins will be cleaved into smaller peptides and fractionated, and then the identity of the proteins present in the sample is revealed either according to their sequence or to their m/z spectra through peptide mass fingerprinting (PMF).
Urine is considered a specific filtrate of blood; the protein components of urine are qualitatively similar to those of blood but quantitatively more diluted (22). Generally, it contains highly soluble proteins and peptides of low molecular weight (<30 kDa) which facilitate analyzing such polypeptides in their natural state (23). An advantage for urine over blood is that urinary polypeptides are stable and do not undergo significant proteolysis within several hours of collection in contrast to blood, where activation of proteases and generation of proteolytic breakdown products takes place within minutes of collection (24). Urinary proteomics presents an attractive approach to cancer biomarker discovery, not only for kidney/ urological malignancies (25, 26) but for other systemic malignancies (27, 28).Urinary biomarkers offer a great chance for the development of novel, non-invasive assays for the diagnosis, monitoring and the early detection of HCC. Many advantages favor the use of urine for cancer biomarker discovery over blood and tissues samples, including the fact that urine-based tests are absolutely noninvasive, and urine is noninfectious for HIV and less infectious for many other pathogens (29).
In this study, we compared the urinary proteomic profile of 32 HCC post-HCV patients, 74 HCV-positive patients and 12 control individuals. Quantitative analysis for the total protein concentration significantly differs between the HCC-post HCV-positive, HCV-positive groups and the control group. Due to the complexity of the HCC proteome, we were not able to identify any significant band(s) from the 1D SDS-PAGE which can be used as a reliable biomarker. Shotgun proteomics “bottom-up approach” was therefore used to identify unique differentially expressed urinary proteins by pooling urine samples from each group. Three proteins (DJ-1 oncoprotein, Chromatin assembly factor-1 (CAF-1) and heat shock protein 60) were found to be commonly expressed in both HCC post HCV-positive and HCV-positive groups but were not identified in the control pooled urine sample. To validate the potential of the 3 proteins in detecting HCC in high risk HCV-positive patients (who were not yet diagnosed as HCC patients at the time of urine collection), we regrouped the samples into a training set (i.e. includes HCC-post HCV-positive and control groups) and a testing set (i.e. includes the HCV-positive group). DJ-1, CAF-1 and HSP60 were found to be significantly expressed in almost all HCC post HCV-positive patients. The specificity of the 3 protein to correctly diagnose HCC within the training set was 100%, whereas the sensitivity was (94%, 87.5% and 91%, respectively). The three proteins were then used to evaluate their potential as an HCC biomarker panel in the testing set. Based on updating the clinical records for each patient in the training set 2 years after urine collection (AFP levels and CT scan), each protein was able to distinguish between newly identified HCC in HCV-positive patients from chronic HCV-positive patients but with either low specificity/high sensitivity or high specificity/low sensitivity When the 3 proteins were combined together as a panel of biomarkers, the specificity and the sensitivity for detecting HCC was improved to be 82% and 81%, respectively. It should be noted that those patients were not yet diagnosed as an HCC patients till after requesting this update for their clinical records.
Materials and Methods
Urine sample collection. Urine samples were collected from the general hospital at Alexandria University (Alexandria, Egypt) and the National Institute for Liver Diseases at Menoufia University (Shebeen El-Kome, Egypt) upon the approval of the Research Ethics Board at Brock University (St. Catharines, Canada). Urine samples were collected (50mL) in the presence of 5 mM EDTA (final concentration). All the samples were divided into 3 groups based on a questionnaire filled out by the clinician responsible for each patient. The 3 groups participating in this study were divided as follows: 32 patients with HCC post-HCV infection, 74 patients with chronic HCV infection and 12 normal individuals (Table 1). Patients with other conditions such as HBV/HCV co-infection and Schistosomiasis were excluded. All three groups were examined by HCV 5' non-coding region reverse transcriptase PCR (5' NCR RT-PCR). The results confirmed that the HCC post-HCV and HCV-positive patients share the same etiological factor, HCV genotype 4 (data not shown).
Clinical pathological parameters of the patients involved in this study.
| Control group | HCC post-HCV group | HCV-positive group | |
|---|---|---|---|
| Number of patients | 12 | 32 | 74 |
| Age (mean ± SD) | 28 ±4 | 50 ±8 | 36 ±18 |
| HCV RNA* | -Ve | +Ve | +Ve |
| Sex | Male (6) Female (6) | Male (26) Female (6) | Male (50) Female (24) |
* All patients were confirmed to be HCV positive or negative by polymerase chain reaction for HCV NCR. Sequencing the PCR product confirmed the genotype of the HCV to be genotype 4.
Total urinary protein purification
Total urinary proteins were isolated in triplicates from 1 mL of urine using the Urine Protein Concentration Micro Kit (Norgen Biotek Corp., Thorold, Canada) as per the manufacturer's instructions. The BioRad protein assay, based on the Bradford assay (30), was used to determine the concentration of total urinary proteins. The absorbance reading was taken at 595nm. A standard curve was established using known amounts of bovine serum albumin (BSA) (NEB, 10mg/mL BSA as supplied with Restriction Enzymes). The concentrations of the protein samples were determined based on the standard curve of known protein concentration. A 15% polyacrylamide gel was prepared for SDS-PAGE analysis. A 20 µl aliquot of each elution was transferred to a fresh microcentrifuge tube, to which 5 µl of 3X loading dye had been added. The samples were mixed, boiled for two minutes, and then loaded onto the polyacrylamide gel. The gel was run for 120 minutes at 200 V/6.5 cm and stained using Coomasie Blue R-250. The resulting gel was scanned for subsequent analysis using AlphaEaseFC TM (Alpha Innotech, v 3.2.1).
LC-MS/MS Analysis of Pooled Urine Samples
Protein samples were digested in-solution using 0.1 μg of trypsin in 25 mM ammonium bicarbonate solution in a total volume of 50 μL. After overnight incubation at 37°C, the peptide solution was lyophilized by SpeedVac centrifugation and re-suspended in 20 μL 0.1% TFA. The mass spectrometric experiments were performed at the Sick-Kids Hospital (Proteomic Facility, Toronto, ON, Canada) using an online LC-MS/MS setup using an Agilent 1100 Capillary LC system (Palo Alto, CA, USA) fitted to an LTQ ion trap mass spectrometer (Thermo Electron, San Jose, CA, USA). A C18 pre-column (150 µm i.d. x 5.0 cm length) and a µLC analytical column (75 µm x 10 cm) that also served as a µESI emitter were used for the separation of the digested proteins. The samples injected were first loaded onto the pre-column to be desalted, and then eluted into the analytical column to perform further separation. The mass spectrometer was operated in data-dependent mode automatically cycling through acquisition of a full-scan mass spectrum and six MS/MS spectra recorded sequentially on the six most abundant ions present in the initial MS scan. A dynamic exclusion time of 1.5 min was used. For the reverse phase chromatography, a 60 min gradient elution from water to acetonitrile, each containing 0.1% TFA, was performed at a flow rate of 0.2~0.3 μL/min. The LC-MS/MS data obtained (in *.RAW format) were converted into mzXML format peak list files. The mzXML data were used to search against NCBInr human database with a search engine called GPM XE (www.thegpm.org). The search results were analyzed with Scaffold software (www.proteomesoftware.com). MS/MS data acquired were searched using an in-house licensed version of Mascot (Matrix Science, London, UK) NCBI's non-redundant database, SwissProt and the MDSB databases.
Relative expression profiling for candidate proteins using RT-qPCR
Relative mRNA expression levels for the 3 candidate proteins (DJ-1, CAF-1(p150) and heat shock protein 60), determined from the shotgun proteomic analysis were analyzed among the HCC post HCV-positive group, HCV-positive group and the control group. Two milliliters of urine were used to isolate total RNA using the Urine (Exfoliated Cell) RNA Purification Kit (Norgen Biotek Corp., Thorold, Canada) as per the manufacturer's instructions. The isolated RNA was treated with DNase-I (Ambion Inc., Austin TX). cDNA was reversibly-transcribed using a 3 µl RNA template and 0.5 µl 0.5μg/μL Oligo (dT)18 Primer. The reaction was then made up with RNase-free water to 5μL then incubated for 5 mins at 70°C then for 10 mins at 4°C. During the 4°C incubation, a mix of 10 µl 5X first strand Buffer, 5 µl of 0.1M DTT, 2.5 µl of 10mM dNTPs, 2 µl SuperScript III (Invitrogen) and 25.5 µl nuclease-free water were added to the 5 µl initial reaction to make it up to 50 µl final reaction. The final reaction was then incubated at 250C for 10 min, 420C for 90 min, 700C for 15 min and a final hold for 40C. For controls, minus RT reactions were set up (only for the control group) where the enzyme was replaced with nuclease-free water. All samples were analyzed using the iCycler iQ real time PCR detection system with iQ SYBR Green Supermix (BioRad Laboratories, Mississauga, ON, Canada). For each sample, 3μl from its corresponding RT reaction were mixed in a 7.5μl iQ SYBR Green Supermix, 4.26μl nuclease-free water and 0.12 μl DJ-1 (F) 5'- TGTAGCCGTGATGTGGTCAT -3', DJ-1 (R) 5'- CCGTCTTTTTCCACACGATT -3'/ CAF-1 (p150) (F) 5'- GGAGCAGGACAGTTGGAGT -3', CAF-1 (p150) (R) 5'- GACGAATGGCTGAGTACAGA -3'/ HSP60 (F) 5'- GCTTGCAAAACTTTCAGATGGA -3' and HSP60 (R) 5'- CTTTTCATTCACTTCAACATCACTTGT -3' in a total of 15μl reaction. All RT-qPCR experiments were carried out in triplicate and the expression levels were normalized to 5S rRNA levels. The relative expression level (fold change) for each candidate miRNA within each group was then calculated using the equation 2-∆Ct test / 2-∆Ct control.
Statistical analysis
The two-tailed independent student's t test was used to evaluate statistical significance difference between the protein levels among the 3 groups participating in this study as well as the significance of the protein expression levels. The data was analyzed and displayed using the statistical program GraphPad Prism 5 (GraphPad Software, San Diego, CA). P values of less than 0.05 were considered significant.
Results
Qualitative and quantitative analysis of total urinary proteins
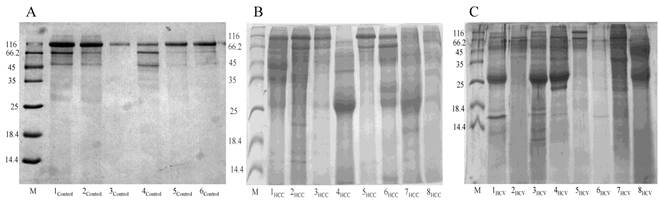
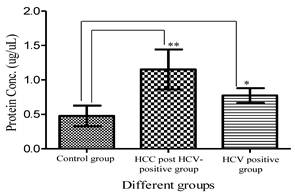
Total urinary proteins were isolated from 1ml of urine of HCC post HCV-positive, HCV-positive and control group. The proteins were run on 1D 15% SDS-PAGE (Figure 1). Qualitatively, the protein bands were not degraded and in a good condition which enabled us to carry out any proteomic downstream application. Quantitatively, the concentration of total urinary proteins purified from the HCC post HCV-positive group (mean of 1.153μg/μl ± 0.8) was found to be significantly higher than that purified from the control group (mean of 0.4775μg/μl ± 0.2) with a P value of 0.0068 (Figure 2). Furthermore, the concentration of total urinary proteins purified from the HCV-positive group (mean of 0.7738μg/μl ± 0.5) was found to be higher than that purified from the control group (mean of 0.4775μg/μl ± 0.2) with a P value of 0.0335 (Figure 2). Additionally, the protein concentration varied significantly within each group (i.e. the protein concentration ranged from 4.6μg/μl to 0.4μg/μl within the HCC post HCV-positive group and from 2.4μg/μl to 0.14μg/μl within the HCV-positive group).
Representative 15% SDS-PAGE gels showing the total proteins purified from urine samples collected from (A) the control group, (B) the HCC post HCV-positive group and (C) the HCV-positive group. Total proteins were isolated from 1mL of urine using Norgen's Urine Protein Concentration Kit, and 20μl out of each 100μl elution were loaded from each sample in the presence of Unstained Protein Molecular Weight Marker (Fermentas, #SM0431).
A histogram showing urinary protein concentration (mean ± SD) purified from the HCC-post HCV positive, the HCV-positive group and the control group. **Protein conc. in the HCC post HCV-positive group is significantly higher than that in Control group with a P value of 0.0068. *Protein conc. in the HCV-positive group is significantly higher than that in Control group with a P value of 0.0335. (Means are significantly different at P < 0.05).
LC-MS/MS Shotgun Analysis
Liquid Chromatography coupled with tandem Mass Spectrometry (LC-MS/MS) analysis of the proteins pooled from the control group, the HCC-post HCV positive group and the HCV positive group resulted in 364 spectra. By analyzing the different spectra generated by the HPLC-MS/MS analysis with MASCOT, X! Tandem on-line search engines and the Scaffold proteome software, a total of 24 proteins were identified. Ten proteins were identified from the proteins pooled from the control group, 13 from the HCC-post HCV positive group and 16 from the HCV positive group. Uromodulin, beta-Actin, Chain A of the second Kunitz domain of tissue factor pathway inhibitor and keratin 9 were identified in all 3 groups. Chain A of a humanized Fab fragment of anti- tissue-factor in complex with tissue factor and Chain L of an antigen-binding fragment from a humanized version of the anti-human Fas antibody Hfe7a were only identified among the HCC-post HCV positive group.
Seven proteins were found to be expressed among the HCV positive group: immunoglobulin ĸ light chain, Zinc-α-2-glycoprotein precursor, Ig G1 H Nie, immunoglobulin λ light chain VLJ region, Adenylyl cyclase-associated protein 1 (CAP 1) and matrin 3. Four proteins were only identified in the control group (keratin 1 & 10, pyruvate kinase 3 and Hornerin). In addition, six proteins were found to be expressed in both the HCC-post HCV positive and the HCV positive groups, but not in the control group. These proteins were: Chromatin Assembly factor p150 (CAF-1), DJ-1 protein, heat shock 60kDa protein (HSP60), Ig heavy chain variable region, Ig J chain and Stathmin 1/oncoprotein 18.
Screening the HCC-post HCV Positive Group for the Over-Expression of DJ-1, CAF-1 and HSP60
DJ-1, CAF-1 and HSP60 were chosen as possible protein biomarkers of HCC because of their proposed roles in carcinogenesis. Using RT-qPCR, the expression of DJ-1, CAF-1 and HSP60 was evaluated in HCC-post HCV positive patients relative to their expression in healthy, control individuals. The expression of the three candidate proteins was normalized against the 5SrRNA.
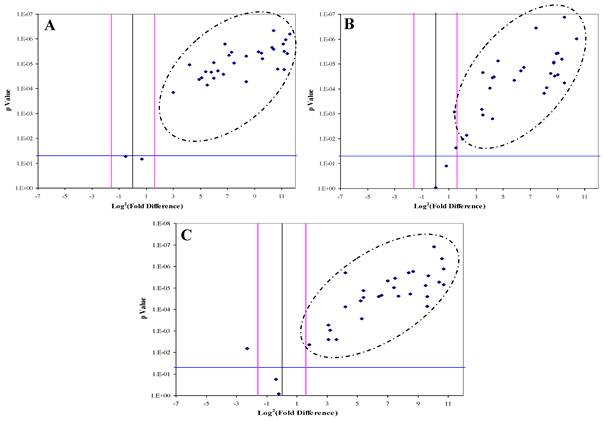
DJ-1, CAF-1 and HSP60 were significantly over-expressed in 30, 28 and 29 HCC-post HCV positive patients, respectively. The over-expression of each protein in the HCC-post HCV patients, relative to the control group, was determined to be significant when the difference in expression was three or more fold with p value of less than 0.05 (Figure 3). All three proteins were found to be, simultaneously, significantly over-expressed in 20 patients, whereas in another 12 patients only two of the three proteins were being significantly over-expressed. There was no correlation between the expression of any of the three proteins and the levels of AFP in the HCC-post HCV positive patients.
The Volcano Plot graphs the log2 of the fold change in each gene's expression between the samples versus its p value from the t-test. The black line indicates fold changes of 1. The pink lines indicate the fold-change in gene expression threshold (P<0.05). Candidate proteins were chosen with a fold change ≥ 3 and P < 0.05
Diagnostic Value of DJ-1, CAF-1 and HSP60 for the Detection of HCC in High-Risk HCV Infected Group
Because DJ-1, CAF-1 and HSP60 over-expression appeared to be a characteristic event among HCC-post HCV positive patients, we hypothesized that aberrantly high levels of these proteins in urine could facilitate their use as biomarkers for the early detection of HCC among high-risk HCV positive patients. Therefore, we studied the expression of DJ-1, CAF-1 and HSP60 in HCV positive patients using RT-qPCR. The expression of these proteins was compared to their expression in the control group. DJ-1, CAF-1 and HSP60 were found to be significantly over-expressed (fold difference greater than three and p < 0.05) in 27 and 51 of 74 patients, respectively.
To validate the diagnostic value of the three candidate proteins for the detection of HCC in the high-risk HCV infected group, the medical records of the HCV infected patients, specifically AFP levels and the CT scan (Computed tomography scan) results, were updated 2 years after sample collection. It should be noted that all the patients within the HCV positive group were not diagnosed with HCC at the time of sample collection, based on their AFP levels and CT scan results. The updated records after 2 years from urine collection showed that AFP levels were elevated in 35 HCV infected patients, all of whom also tested positive for HCC by CT scans. Only one patient, #7, had a normal AFP level, but was diagnosed with HCC by CT scan. As a reminder, patients with AFP levels of 400ng/mL or more and confirmed presence of a tumor by CT scan are considered truly HCC positive (31).
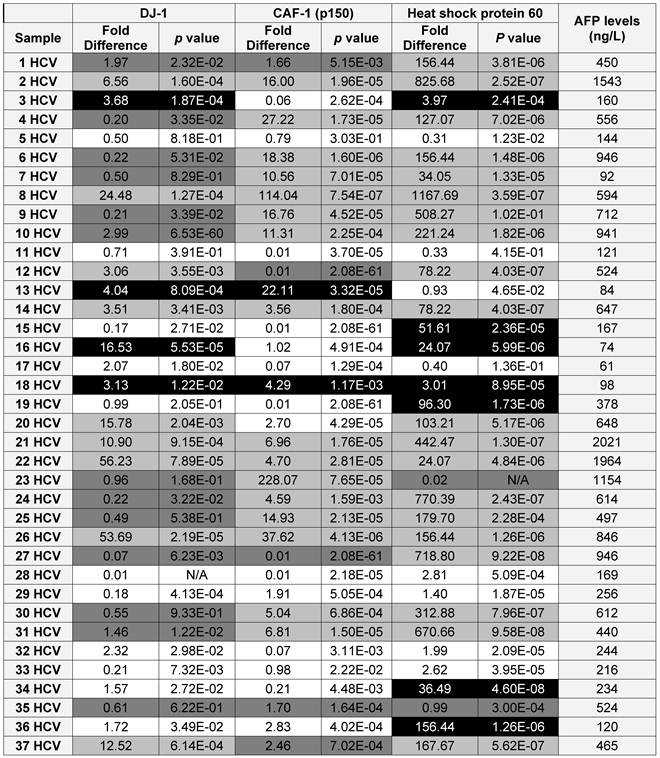
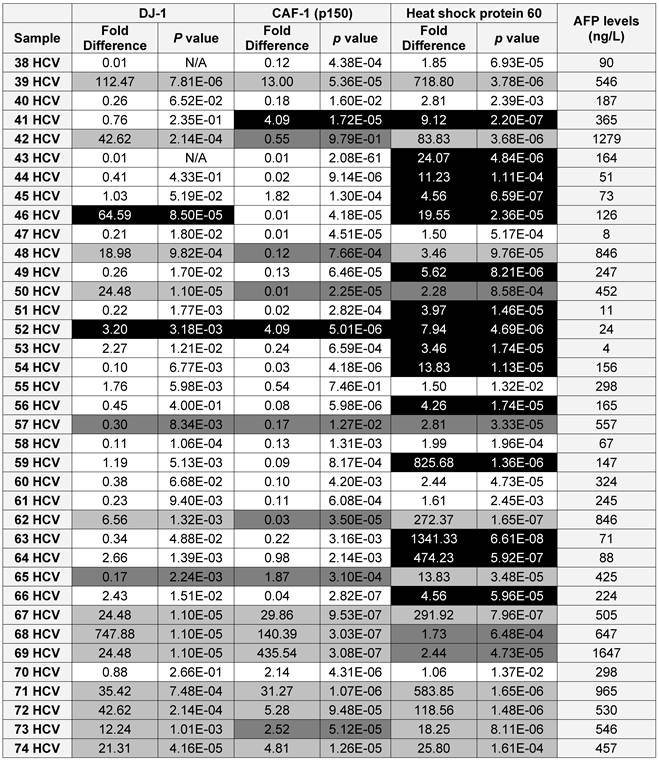
Using the updated medical records, the diagnostic value for the over-expression of the three selected proteins for predicting HCC in HCV infected patients was determined (Table 2). The specificity and the sensitivity for each selected protein, independently or by combining any two proteins, showed either high sensitivity/low specificity or low sensitivity/high specificity in detecting HCC among HCV positive patients (Table 3). When the three proteins were used as one panel for diagnosing HCC in HCV infected patients, the specificity was significantly improved, whereas the sensitivity was significantly reduced. CAF-1, solely or combined with HSP60, showed the highest specificity, sensitivity and diagnostic accuracy in identifying HCC among high-risk HCV infected patients.
A list showing the AFP levels, the fold difference, p value for the expression of each candidate as in the HCV positive patients (■ True Positive, ■ False Positive, ■ False Negative and □ True Negative)
Showing the specificity and the sensitivity of the candidate(s) in detecting HCC in the training set
| Candidate Biomarker(s) | Specificity (%) | Sensitivity (%) | Positive Predictive Value (PPV) (%) | Negative Predictive Value (NPV) (%) | Diagnostic accuracy (%) |
|---|---|---|---|---|---|
| DJ-1 | 82 | 58 | 75 | 67 | 70 |
| CAF-1 | 90 | 66 | 85 | 74 | 78 |
| HSP60 | 42 | 83 | 58 | 73 | 62 |
| DJ-1/CAF-1 | 92 | 36 | 81 | 60 | 65 |
| DJ-1 /HSP60 | 87 | 51 | 78 | 67 | 70 |
| CAF-1/ HSP 60 | 92 | 61 | 88 | 71 | 77 |
| DJ-1/CAF-1/HSP60 | 95 | 31 | 85 | 61 | 65 |
Discussion
Hepatocellular carcinoma (HCC) is one of the most widespread fatal human malignancies worldwide. Almost 500,000 new cases and nearly the same number of sufferers show the lack of effective therapeutic alternatives. Many risk factors are associated with the development of HCC such as chronic hepatitis B and chronic hepatitis C virus infections. Also, several environmental factors including aflatoxin B1, a dietary mold contaminant, and polycyclic aromatic hydrocarbons are also associated with the development of HCC (32, 33). Hepatocarcinogenesis is a slow multistep process, usually a consequence of long-term inflammation and fibrosis, which involves the progressive accumulation of alterations at the level of gene and protein expression (34). At the early stages, these changes alter the phenotype of liver cells, resulting in the generation of cellular intermediates that finally progress to HCC. Proteomic analysis of liver tissues and sera of patients with HCC-post HCV infection has been used to identify new biomarkers that are able to predict HCC development at earlier stages, leading to more effective treatment (35, 36). In this approach, we used the shotgun “bottom-up” proteomic approach to identify promising biomarker candidates from the urinary proteins purified from the HCC-post HCV infected group and the HCV positive group.
The mean concentrations of total urinary proteins purified from patients in the HCV positive group and the HCC-post HCV group were higher than that of the control group, with the difference in mean protein concentrations relative to the control group being more pronounced for patients in the HCC-post HCV group. This was expected due to the complexity of the cancer proteome, as it contains a variety of information that is gathered from almost all the biological activities that take place in cancer cells (17). Additionally, varying concentrations of total urinary proteins were observed among patients that were part of the same groups and these were indicative of the variability of disease outcome. These variations were apparent when the total urinary proteins were separated on SDS-PAGE gels, however, the protein patterns of some samples that were acquired from patients in the HCC-post HCV positive group appeared similar to those acquired from patients in the HCV positive group (Data not shown). These similarities represent a possible common proteomic outcome for patients infected with HCV and patients who had developed HCC as a consequence of HCV infection.
The shotgun “bottom-up” proteomic approach was then applied to study the differential expression of proteins among the HCC-post HCV positive and the HCV positive patients relative to the control group. The gold standard 2D SDS-PAGE approach was not used for this purpose because it is labor-intensive, displays great variability and is very difficult to standardize, especially when analyzing large number of patients. In contrast, the shotgun strategy has a higher analytical sensitivity, higher sample loading capacity and offers the capacity for high-throughput protein identification (37). After subjecting the proteins pooled from each group to LC-MS/MS, 364 spectra were identified as follows: 122 spectra from the pooled control group, 122 spectra from the pooled HCC post HCV-positive group and 120 spectra from the pooled HCV-positive group.
A total of 24 proteins were identified when the spectra generated by the shotgun analysis were analyzed. Most of the proteins identified in the HCC-post HCV group and the HCV positive group were immunoglobulins. The presence of different immunoglobulin forms in the urine of HCC-post HCV group and the HCV positive group was indicative of an active immune response against the viral infection. One of the proteins identified in the HCV positive group was Matrin 3. This is an RNA binding protein, reported to be one of the cellular proteins that interacts with the 3'-untranslated region of HCV and plays a role in HCV replication and HCV-associated pathogenesis (38). More importantly, however, DJ-1, Chromatin assembly factor-1 (p150), heat shock protein 60 and Stathmin 1/oncoprotein 18 were commonly identified in both the HCC-post HCV positive and the HCV-positive group, but not in the control group. Stathmin 1, a major microtubule-depolymerizing protein, has been reported to be involved in cell cycle progression and cell motility. Stathmin 1 was found to be over-expressed in HCC patients and is associated with higher vascular invasion. Its over-expression has been considered to be an important prognostic factor for HCC, which may serve as a useful marker to predict early tumor recurrence (ETR) (39). Since the aim of this study was to discover novel biomarkers for the early detection of HCC, and not for prognosis, Stathmin 1 was excluded from further consideration as a suitable HCC biomarker candidate.
As for DJ-1, it was firstly identified by Nagakubo et al. (40) as a novel oncogene that is expressed in different human tissues such as pancreas, kidney, muscle, liver, placenta and brain. Moreover, it was found to be over-expressed in the sera of 37% of newly diagnosed breast cancer patients, in primary lung tumors and in prostate cancer, indicating its association with the cellular growth and transformation (41, 42, 43). DJ-1 functions as a pro-oncogenic protein, especially when co-expressed with other oncogenes such as c-myc or c-ras. A recent study by Kim et al., (44) had reported that DJ-1 might also act as a negative regulator of the tumor suppressor gene PTEN, which promotes apoptosis through the P13K-Akt-PKB pathway (45).
DJ-1 over-expression provides a survival advantage to cancer cells by increasing the production of detoxification enzymes (46). Persistent HCV infection is known to cause persistent endoplasmic reticulum stress, resulting in the accumulation of intra- and extracellular DNA damaging factors that make the cell prone to mutagenesis. Additionally, transgenic mice expressing the HCV core protein showed an unusual accumulation of reactive oxygen species (ROS), which correlated with the progression of HCC development (47). HCV NS5A expression alters intracellular calcium levels, inducing oxidative stress and activating STAT-3 and NF-ĸB (48). DJ-1 is, therefore, a pro-survival gene because it influences the expression of detoxification enzymes that offer protection against oxidative/endoplasmic reticulum stress (49). In light of its over-expression among HCV positive patients and its dual role as an oncogene and a pro-survival gene, DJ-1 was our first HCC biomarker candidate.
The second differentially expressed protein to be examined as a potential HCC biomarker candidate was the Chromatin assembly factor-1 (CAF-1). CAF-1 is a highly conserved protein complex that promotes nucleosome assembly (i.e. deposition of histones H3 and H4, required for the progression of the S-phase of the cell cycle) on newly synthesized DNA (50). Its chromatin assembly activity has been associated with DNA repair in vitro during nucleotide excision repair (51) and repair of single strand breaks and gaps (52). CAF-1 has been found to be extremely down-regulated at both the RNA and protein levels upon cell cycle exit when cells enter the quiescent state. In cultured cells derived from breast tumors, CAF-1 was found to be over-expressed, relative to cells from normal breast tissue. In another study that was conducted on clinical samples from breast lesions, a strong correlation was found between the expression of CAF-1 and the routinely used proliferation marker Ki-67. CAF-1 has been considered as a potent proliferation marker, since it can be used to distinguish between quiescent and proliferating cells (53). In accordance with the previously mentioned correlation between CAF-1 and cellular proliferation, the normal, quiescent, hepatic stellate cells are known to proliferate when stimulated by liver injury and exposure to various cytokines. The activation of stellate cells is a key event in hepatic fibrosis (the accumulation of extracellular matrix in response to acute or chronic liver injury). Cirrhotic liver is the end-stage consequence of fibrosis that then develops into HCC (54). Thus, CAF-1 over-expression could be a promising HCC biomarker candidate.
The third differentially expressed protein to be examined as a potential HCC biomarker candidate was the heat shock protein 60 (HSP60), which belongs to the highly conserved HSPs family. HSPs are produced in response to heat stress as well as many other forms of stress, such as irradiation, hypoxia, toxic agents or infections (55). Most HSPs play a protective role and, hence, promote cell survival over apoptosis (56). Unlike other HSPs, HSP60 seems to have both pro-survival and pro-death functions. HSP60 was found to protect epithelial cells from stress-induced death by inhibiting caspase 3, which plays a central role in apoptosis (57). HSP60 was found to be over-expressed in prostate cancer (58), colorectal cancer (59) and cervical cancer (60) supporting its role as a pro-survival factor. Its anti-apoptotic effect may also be the result of its ability to modulate the expression of some members of the Bcl-2 family (61). In contrast, HSP60 expression in esophageal squamous cell carcinoma (62) and ovarian cancer (63) correlates positively with good prognosis. As an example of its role in pro-cell death functions, HSP60 was found to interact and accelerate the maturation of procaspase 3 in HeLa cells during apoptosis (64).
Based on the aforementioned evidence for the possible contribution of the selected candidates in the development and progression of cancer, the possibility of using DJ-1, CAF-1 and HSP60 as HCC biomarkers among high-risk HCV infected patients was tested. The over-expression of these three candidate biomarkers appeared to be a characteristic event in the development of HCC among HCV infected patients. DJ-1 was found to be over-expressed in 30 HCC-post HCV infected patients, seeming to confirm its roles as an oncogene and a down-regulator of PTEN expression, both of which aid the development of HCC (45). Furthermore, DJ-1 over-expression in cancer cells can also be attributed to its role in protection of cells against endoplasmic reticulum oxidative stress, which results from persistent HCV infection. As for CAF-1, it was significantly over-expressed in 28 HCC-post HCV infected patients. This finding agrees with its role of stimulating the proliferation of quiescent cells (hepatic stellate cells) and its role in the development of fibrosis, cirrhosis and consequently HCC. In the case of HSP60, it was found to be up-regulated in 29 HCC-post HCV positive patients. Expression of HSP60 was not studied before in the context of HCC, but since it was found to be significantly over-expressed in HCC-post HCV positive patients, it appears that HSP60 has an anti-apoptotic effect rather than a death-promoting function in HCC.
Examination of their expression levels among the HCV positive patients relative to the control group showed that they are significantly over-expressed in a number of patients, who were subsequently suspected as HCC patients. DJ-1 and CAF-1 were significantly over-expressed in 27 HCV-positive patients, whereas HSP60 was significantly over-expressed in 52 HCV positive patients. To validate the diagnostic value of the three candidate proteins for the detection of HCC in the high-risk HCV infected group, the medical records of the HCV infected patients, specifically AFP levels and CT scan results, were updated two years after initial sample collection. It should be noted that all the patients in the HCV positive group were not diagnosed with HCC at the time of initial sample collection, based on their AFP levels and CT scan results. The updated records showed that AFP levels were elevated in 35 HCV infected patients, all of whom also tested positive for HCC by CT scans. Only one patient, #7, had a normal AFP level, but was diagnosed with HCC by CT scan. As a reminder, patients with AFP levels of 400ng/mL or more and who tested positive by CT scan are considered truly HCC positive (31).
The three proteins showed great diversity in their ability to detect HCC among HCV positive patients. The most promising protein for early detection of HCC among HCV positive patients was CAF-1, which showed a specificity of 90%, a sensitivity of 66%, and an overall diagnostic accuracy of 78%. The positive predictive value (PPV) of CAF-1 was 85% whereas the negative predictive value (NPV) was 74%. CAF-1 over-expression correctly identified most of the true positive and the true negative patients, giving it a high HCC predictive value among high-risk HCV infected patients. This diagnostic value is a reflection of the role CAF-1 plays in cellular proliferation, especially as a consequence of cancer development. According to its diagnostic value, DJ-1 over-expression was the next best biomarker candidate, after CAF-1, for the early detection of HCC. Among HCV positive patients, DJ-1 identified HCC with a specificity of 82%, a sensitivity of 58% and had an overall diagnostic value of 71%. The PPV and the NPV of DJ-1 were 75% and 67%, respectively. These values give DJ-1 an acceptable diagnostic value for distinguishing HCC patients from normal individuals. Since DJ-1 is not the only oncogene that contributes to the development of HCC, as it might not be the only PTEN down-regulator, its diagnostic value was not as high as that of CAF-1, which is considered as a high proliferative factor.
The diagnostic values of both CAF-1 and DJ-1 for predicting HCC in HCV infected patients were considered acceptable in comparison to the reported diagnostic value of the AFP (considered the gold standard, with a specificity and sensitivity of 75% and 68%, respectively). The specificity of HSP60 was the lowest of the three candidates (42%), but its sensitivity was the highest (83%), resulting in a diagnostic value of 62%. The high sensitivity and low specificity of HSP60 over-expression was well reflected by its low PPV (58%) and its, relatively, higher NPV (73%). Taking all the values into consideration, HSP60 over-expression had major problems correctly identifying true negatives among HCV positive patients. An explanation for this trend is that HSP60 is over-expressed in infected hepatocytes in response to high oxidative and endoplasmic reticulum stress, which are caused by HCV viral proteins (HCV core and NS5A), therefore it is a better indicator of HCV than HCC.
In an attempt to increase the diagnostic value of the proposed HCC biomarker candidates, the diagnostic value for any combination of selected proteins was determined. The diagnostic value of the CAF-1/HSP60 tandem was the highest among the evaluated combinations. The specificity and the sensitivity of CAF-1/HSP60 were 92% and 61%, respectively, with an overall diagnostic value of 77%. CAF-1/HSP60 was successful in identifying 88% of the true positive and 71% of the true negative patients in the HCV positive group. The combination of all three candidates showed a very high specificity (95%) in detecting HCC, but also showed a very low sensitivity (31%), resulting in a diagnostic value of only 65%. The proteomic-based HCC biomarker approach identified two major biomarker candidates for the early detection of HCC among high-risk HCV infected populations. CAF-1 is the first proposed, single proteomic-based, HCC biomarker, whereas, CAF-1/HSP60 tandem is the second proposed, multiple proteomic-based, HCC biomarker. Although the proposed proteomic-based HCC biomarkers showed a reasonable predictive value, their potential should be evaluated among a larger pool of samples and over a longer time interval. Moreover, since urine was used as a non-invasive sample source, it would be convenient to establish a non-invasive assay to be used for mass population screening. This should have a great impact on the early detection of HCC among HCV infected patients, and hence would reduce the high HCC mortality rates.
Acknowledgements
The authors would like to thank the Egyptian government and the Egyptian Cultural and Educational Bureau in Canada for their financial support of this project. The authors will also like to thank the staff of Norgen Biotek for their technical support.
Competing Interests
The authors have declared that no competing interest exists.
References
1. Di Bisceglie AM, Rustgi VK, Hoofnagle JH, Dusheiko GM, Lotze MT. NIH conference, Hepatocellular carcinoma. Ann. Intern. Ned. 1988;108:390-401
2. Bosch FX, Ribes J, Borras J. Epidemiology of primary liver cancer. Sem. Liver Dis. 1999;19:271-285
3. Beasley RP. Hepatitis B virus. The major etiology of hepatocellular carcinoma. Cancer. 1988;61:1942-1956
4. El-Serag HB, Mason AC. Rising incidence of hepatocellular carcinoma in the United States. N. Engl. J. Med. 1999;340:745-750
5. Steel LF, Mattu TS, Mehta A, Hebestreit H, Dwek R, Evans AA, London WT, Block T. A proteomic approach for the discovery of early detection markers of hepatocellular carcinoma. Dis Markers. 2001;3:179-189
6. Hoofnagle JH, di Bisceglie AM. The treatment of chronic viral hepatitis. N. Engl. J. Med. 1997;336:347-356
7. Alter MJ. Epidemiology of hepatitis C. Hepatology. 1997;1:62S-65S
8. He QY, Zhu R, Lei T, Ng MY, Luk JM, Sham P, Lau GK, Chiu JF. Toward the proteomic identification of biomarkers for the prediction of HBV related hepatocellular carcinoma. J Cell Biochem. 2008;3:740-52
9. Johnson PJ. The role of serum alpha-fetoprotein estimation in the diagnosis and management of hepatocellular carcinoma. Clin Liver Dis. 2001;5:145-159
10. El-Houseini ME, Mohammed MS, Elshemey WM, Hussein TD, Desouky OS, Elsayed AA. Enhanced detection of hepatocellular carcinoma. Cancer Control. 2005;4:248-53
11. Soga K, Watanabe T, Aikawa K, Toshima M, Shibasaki K, Aoyagi Y. Serum des-gamma-carboxyprothrombin level by a modified enzyme immunoassay method in hepatocellular carcinoma: clinical significance in small hepatocellular carcinoma. Hepatogastroenterology. 1998;45:1737-1741
12. He QY, Chiu JF. Proteomics in biomarker discovery and drug development. J Cell Biochem. 2003;89:868-886
13. Poon TC, Hui AY, Chan HL, Ang IL, Chow SM, Wong N, Sung JJ. Prediction of liver fibrosis and cirrhosis in chronic hepatitis B infection by serum proteomic fingerprinting: A pilot study. Clin Chem. 2005;51:328-335
14. Feng JT, Liu YK, Song HY, Dai Z, Qin LX, Almofti MR, Fang CY, Lu HJ, Yang PY, Tang ZY. Heat-shock protein 27: A potential biomarker for hepatocellular carcinoma identified by serum proteome analysis. Proteomics. 2005;5:4581-4588
15. Schwegler EE, Cazares L, Steel LF, Adam BL, Johnson DA, Semmes OJ, Block TM, Marrero JA, Drake RR. SELDI-TOF MS profiling of serum for detection of the progression of chronic hepatitis C to hepatocellular carcinoma. Hepatology. 2005;41:634-642
16. Lee IN, Chen CH, Sheu JC, Lee HS, Huang GT, Chen DS, Yu CY, Wen CL, Lu FJ, Chow LP. Identification of complement C3a as a candidate biomarker in human chronic hepatitis C and HCV-related hepatocellular carcinoma using a proteomics approach. Proteomics. 2006;6:2865-2873
17. Alaoui-Jamali MA, Xu YJ. Proteomic technology for biomarker profiling in cancer: an update. J Zhejiang Univ Sci B. 2006;7:411-420
18. Issaq HJ. The role of separation science in proteomics research. Electrophoresis. 2001;22:3629-3638
19. Yanagida M. Functional proteomics; current achievements. J Chromatogr B Analyt Technol Biomed Life Sci. 2002;771:89-106
20. Wang L, Li F, Sun W, Wu S, Wang X, Zhang L, Zheng D, Wang J, Gao Y. Concanavalin A-captured glycoproteins in healthy human urine. Mol. Cell. Proteomics. 2006;5:560-562
21. Cutillas PR, Norden AG, Cramer R, Burlingame AL, Unwin RJ. Detection and analysis of urinary peptides by on-line liquid chromatography and mass spectrometry: application to patients with renal Fanconi syndrome. Clin. Sci. (Lond.). 2003;104:483-490
22. Oh J, Pyo JH, Jo EH, Hwang SI, Kang SC, Jung JH, Park EK, Kim SY, Choi JY, Lim J. Establishment of a near-standard two-dimensional human urine proteomic map. Proteomics. 2004;11:3485-3497
23. Theodorescu D, Mischak H. Mass spectrometry based proteomics in urine biomarker discovery. World J Urol. 2007;5:435-443
24. Omenn GS, States DJ, Adamski M, Blackwell TW, Menon R, Hermjakob H, Apweiler R, Haab BB, Simpson RJ, Eddes JS, Kapp EA, Moritz RL, Chan DW, Rai AJ, Admon A, Aebersold R, Eng J, Hancock WS, Hefta SA, Meyer H, Paik YK, Yoo JS, Ping P, Pounds J, Adkins J, Qian X, Wang R, Wasinger V, Wu CY, Zhao X, Zeng R, Archakov A, Tsugita A, Beer I, Pandey A, Pisano M, Andrews P, Tammen H, Speicher DW, Hanash SM. Overview of the HUPO Plasma Proteome Project: results from the pilot phase with 35 collaborating laboratories and multiple analytical groups, generating a core dataset of 3020 proteins and a publicly available database. Proteomics. 2005;5:3226-3245
25. Rehman I, Azzouzi AR, Catto JW, Allen S, Cross SS, Feeley K, Meuth M, Hamdy FC. Proteomic analysis of voided urine after prostatic massage from patients with prostate cancer: a pilot study. Urology. 2004;64:1238-1243
26. Irmak S, Tilki D, Heukeshoven J, Oliveira-Ferrer L, Friedrich M, Huland H, Ergun S. Stage-dependent increase of orosomucoid and zinc-alpha2-glycoprotein in urinary bladder cancer. Proteomics. 2005;5:4296-4304
27. Tantipaiboonwong P, Sinchaikul S, Sriyam S, Phutrakul S, Chen ST. Different techniques for urinary protein analysis of normal and lung cancer patients. Proteomics. 2005;5:1140-1149
28. Ye B, Skates S, Mok SC, Horick NK, Rosenberg HF, Vitonis A, Edwards D, Sluss P, Han WK, Berkowitz RS, Cramer DW. Proteomic-based discovery and characterization of glycosylated eosinophil-derived neurotoxin and COOH-terminal osteopontin fragments for ovarian cancer in urine. Clin. Cancer Res. 2006;12:432-441
29. Botezatu I, Serdyuk O, Potapova G, Shelepov V, Alechina R, Molyaka Y, Ananév V, Bazin I, Garin A, Narimanov M, Knysh V, Melkonyan H, Umansky S, Lichtenstein A. Genetic analysis of DNA excreted in urine: a new approach for detecting specific genomic DNA sequences from cells dying in an organism. Clin Chem. 2000;46:1078-84
30. Bradford MM. A rapid and sensitive method for the quantitation of microgram quantities of protein utilizing the principle of protein-dye binding. Analytical Biochemistry. 1976;72:248-54
31. Bruix J, Sherman M, Llovet JM, Beaugrand M, Lencioni R, Burroughs AK, Christensen E, Pagliaro L, Colombo M, Rodes J.EASL Panel of Experts on HCC. Clinical management of hepatocellular carcinoma. Conclusions of the Barcelona-2000 EASL conference. J Hepatol. 2001;35:421-430
32. Chen CJ, Yu MW, Liaw YF. Epidemiologic characteristics and risk factors of hepatocellular carcinoma. J Gastroenterol Hepatol. 1997;12:S294-308
33. Chen SY, Wang LY, Lunn RM, Tsai WY, Lee PH, Lee CS, Ahsan H, Zhang YJ, Chen CJ, Santella RM. Polycyclic aromatic hydrocarbon-DNA adducts in liver tissues of hepatocellular carcinoma patients and controls. Int J Cancer. 2002;99:14-21
34. Thorgeirsson SS, Grisham JW. Molecular pathogenesis of human hepatocellular carcinoma. Nat Genet. 2002;4:339-346
35. Yokoyama Y, Kuramitsu Y, Takashima M, Iizuka N, Toda T, Terai S, Sakaida I, Oka M, Nakamura K, Okita K. Proteomic profiling of proteins decreased in hepatocellular carcinoma from patients infected with hepatitis C virus. Proteomics. 2004;4:2111- 2116
36. Yoon SK, Lim NK, Ha SA, Park YG, Choi JY, Chung KW, Sun HS, Choi MJ, Chung J, Wands JR, Kim JW. The human cervical cancer oncogene protein is a biomarker for human hepatocellular carcinoma. Cancer Res. 2004;64:5434-5441
37. Feng JT, Shang S, Beretta L. Proteomics for the early detection and treatment of hepatocellular carcinoma. Oncogene. 2006;27:3810-3817
38. Harris D, Zhang Z, Chaubey B, Pandey VN. Identification of cellular factors associated with the 3'-nontranslated region of the hepatitis C virus genome. Mol Cell Proteomics. 2006;6:1006-1018
39. Yuan RH, Jeng YM, Chen HL, Lai PL, Pan HW, Hsieh FJ, Lin CY, Lee PH, Hsu HC. Stathmin overexpression cooperates with p53 mutation and osteopontin overexpression, and is associated with tumour progression, early recurrence, and poor prognosis in hepatocellular carcinoma. J Pathol. 2006;209:549-558
40. Nagakubo D, Taira T, Kitaura H, Ikeda M, Tamai K, Iguchi-Ariga SM, Ariga H. DJ-1, a novel oncogene which transforms mouse NIH3T3 cells in cooperation with ras. Biochem Biophys Res Commun. 1997;231:509-513
41. Le Naour F, Misek DE, Krause MC, Deneux L, Giordano TJ, Scholl S, Hanash SM. Proteomics-based identification of RS/DJ-1 as a novel circulating tumor antigen in breast cancer. Clin Cancer Res. 2001;7:3328-3335
42. MacKeigan JP, Clements CM, Lich JD, Pope RM, Hod Y, Ting JP. Proteomic profiling drug-induced apoptosis in non-small cell lung carcinoma: identification of RS/DJ-1 and RhoGDIalpha. Cancer Res. 2003;63:6928-6934
43. Grzmil M, Voigt S, Thelen P, Hemmerlein B, Helmke K, Burfeind P. Up-regulated expression of the MAT-8 gene in prostate cancer and its siRNA-mediated inhibition of expression induces a decrease in proliferation of human prostate carcinoma cells. Int J Oncol. 2004;24:97-105
44. Kim RH, Peters M, Jang Y, Shi W, Pintilie M, Fletcher GC, DeLuca C, Liepa J, Zhou L, Snow B, Binari RC, Manoukian AS, Bray MR, Liu FF, Tsao MS, Mak TW. DJ-1, a novel regulator of the tumor suppressor PTEN. Cancer Cell. 2005;7:263-273
45. Hammond SM. MicroRNAs as oncogenes. Curr. Opin. Genet. Dev. 2006;16:4-9
46. Clements CM, McNally RS, Conti BJ, Mak TW, Ting JP. DJ-1, a cancer- and Parkinson's disease-associated protein, stabilizes the antioxidant transcriptional master regulator Nrf2. Proc Natl Acad Sci U S A. 2006;41:15091-15096
47. Moriya K, Nakagawa K, Santa T, Shintani Y, Fujie H, Miyoshi H, Tsutsumi T, Miyazawa T, Ishibashi K, Horie T, Imai K, Todoroki T, Kimura S, Koike K. Oxidative stress in the absence of inflammation in a mouse model for hepatitis C virus-associated hepatocarcinogenesis. Cancer Res. 2001;11:4365-70
48. Waris G, Tardif KD, Siddiqui A. Endoplasmic reticulum (ER) stress: hepatitis C virus induces an ER-nucleus signal transduction pathway and activates NF-kappa B and STAT-3. Biochem Pharmacol. 2002;64:1425-1430
49. Taira T, Saito Y, Niki T, Iguchi-Ariga SM, Takahashi K, Ariga H. DJ-1 has a role in antioxidative stress to prevent cell death. EMBO Rep. 2004;5:213-218
50. Mello JA, Almouzni G. The ins and outs of nucleosome assembly. Curr. Opin. Genet. Dev. 2001;11:136-141
51. Gaillard PH, Martini EM, Kaufman PD, Stillman B, Moustacchi E, Almouzni G. Chromatin assembly coupled to DNA repair: a new role for chromatin assembly factor I. Cell. 1996;86:887-896
52. Moggs JG, Grandi P, Quivy JP, Jónsson ZO, Hübscher U, Becker PB, Almouzni G. A CAF-1-PCNA-mediated chromatin assembly pathway triggered by sensing DNA damage. Mol. Cell Biol. 2000;20:1206-1218
53. Polo SE, Theocharis SE, Klijanienko J, Savignoni A, Asselain B, Vielh P, Almouzni G. Chromatin assembly factor-1, a marker of clinical value to distinguish quiescent from proliferating cells. Cancer Res. 2004;64:2371-2381
54. Farazi PA, DePinho RA. Hepatocellular carcinoma pathogenesis: from genes to environment. Nat Rev Cancer. 2006;9:674-687
55. Lindquist S, Craig EA. The heat shock proteins. Annu Rev Genet. 1988;22:631-677
56. Beere HM. "The stress of dying": the role of heat shock proteins in the regulation of apoptosis. J. Cell Sci. 2004;117:2641-2651
57. Zhang L, Pelech S Uitto VJ. Bacterial GroEL-like heat shock protein 60 protects epithelial cells from stress-induced death through activation of ERK and inhibition of caspase 3. Exp. Cell Res. 2004;292:231-240
58. Cornford PA, Dodson AR, Parsons KF, Desmond AD, Woolfenden A, Fordham M, Neoptolemos JP, Ke Y, Foster CS. Heat shock protein expression independently predicts clinical outcome in prostate cancer. Cancer Res. 2000;60:7099-7105
59. Cappello F, David S, Rappa F, Bucchieri F, Marasa L, Bartolotta TE, Farina F, Zummo G. The expression of HSP60 and HSP10 in large bowel carcinomas with lymph node metastase. BMC Cancer. 2005;5:139
60. Castle PE, Ashfaq R, Ansari F, Muller CY. Immunohistochemical evaluation of heat shock proteins in normal and preinvasive lesions of the cervix. Cancer Lett. 2005;229:245-252
61. Shan YX, Liu TJ, Su HF, Samsamshariat A, Mestril R, Wang PH. Hsp10 and Hsp60 modulate Bcl-2 family and mitochondrial apoptosis signaling induced by doxorubicin in cardiac muscle cells. J. Mol. Cell. Cardiol. 2003;35:1135-1143
62. Faried A, Sohda M, Nakajima M, Miyazaki T, Kato H, Kuwano H. Expression of heat-shock protein Hsp60 correlated with the apoptotic index and patient prognosis in human oesophageal squamous cell carcinoma. Eur. J. Cancer. 2004;40:2804-2811
63. Schneider J, Jimenez E, Marenbach K, Romero H, Marx D, Meden H. Immunohistochemical detection of HSP60-expression in human ovarian cancer. Correlation with survival in a series of 247 patients. Anticancer Res. 1999;19:2141-2146
64. Samali A, Cai J, Zhivotovsky B, Jones DP, Orrenius S. Presence of a pre-apoptotic complex of pro-caspase-3, Hsp60 and Hsp10 in the mitochondrial fraction of jurkat cells. EMBO J. 1999;18:2040-2048
Author contact
![]() Corresponding author: Moemen AK Abdalla, Centre for Biotechnology, Brock University, St. Catharines, ON, L2S 3A1, Canada. E-mail: demerdashmcom. Tel: 905-650-9065.
Corresponding author: Moemen AK Abdalla, Centre for Biotechnology, Brock University, St. Catharines, ON, L2S 3A1, Canada. E-mail: demerdashmcom. Tel: 905-650-9065.