Journal of Cancer
ISSN: 1837-9664
3.2
Impact Factor
ISSN: 1837-9664

 Global reach, higher impact
J Cancer 2014; 5(2):103-114. doi:10.7150/jca.6890 This issue Cite
Research Paper
Potential Urinary Protein Biomarker Candidates for the Accurate Detection of Prostate Cancer among Benign Prostatic Hyperplasia Patients
Taha A Haj-Ahmad 1, Moemen AK Abdalla2 ![]() , Yousef Haj-Ahmad2
, Yousef Haj-Ahmad2
1. Centre for Biotechnology, Brock University, St. Catharines, ON, L2S 3A1, Canada.
2. Department of Biochemistry, Faculty of Science, Alexandria University, Egypt.
Received 2013-6-11; Accepted 2013-11-21; Published 2014-1-5
Citation:
Haj-Ahmad TA, Abdalla MAK, Haj-Ahmad Y. Potential Urinary Protein Biomarker Candidates for the Accurate Detection of Prostate Cancer among Benign Prostatic Hyperplasia Patients. J Cancer 2014; 5(2):103-114. doi:10.7150/jca.6890. https://www.jcancer.org/v05p0103.htm
Other stylesAbstract
Globally, Prostate cancer (PCa) is the most frequently occurring non-cutaneous cancer, and is the second highest cause of cancer mortality in men. Serum prostate specific antigen (PSA) has been the standard in PCa screening since its approval by the American Food & Drug Administration (FDA) in 1994. Currently, PSA is used as an indicator for PCa - patients with a serum PSA level above 4ng/mL will often undergo prostate biopsy to confirm cancer. Unfortunately fewer than ~30% of these men will biopsy positive for cancer, meaning that the majority of men undergo invasive biopsy with little benefit. Despite PSA's notoriously poor specificity (33%), there is still a significant lack of credible alternatives. Therefore an ideal biomarker that can specifically detect PCa at an early stage is urgently required. The aim of this study was to investigate the potential of using deregulation of urinary proteins in order to detect Prostate Cancer (PCa) among Benign Prostatic Hyperplasia (BPH). To identify the protein signatures specific for PCa, protein expression profiling of 8 PCa patients, 12 BPH patients and 10 healthy males was carried out using LC-MS/MS. This was followed by validating relative expression levels of proteins present in urine among all the patients using quantitative real time-PCR. This was followed by validating relative expression levels of proteins present in urine among all the patients using quantitative real time-PCR. This approach revealed that significant the down-regulation of Fibronectin and TP53INP2 was a characteristic event among PCa patients. Fibronectin mRNA down-regulation, was identified as offering improved specificity (50%) over PSA, albeit with a slightly lower although still acceptable sensitivity (75%) for detecting PCa. As for TP53INP2 on the other hand, its down-regulation was moderately sensitive (75%), identifying many patients with PCa, but was entirely non-specific (7%), designating many of the benign samples as malignant and being unable to accurately identify more than one negative.
Keywords: Prostate Cancer. Benign Prostatic Hyperplasia. Urine. Proteins. Biomarkers.
Introduction
Globally, PCa is the second most common, non-cutaneous cancer among men (1, 2). Various studies have observed a positive correlation between age and incidence of PCa (2, 3, 4). Environmental factors, particularly diet, have also been reported to potentially play a role in a man's risk for PCa (5). A number of techniques are currently available for assessing prostate health, the most common of which include digital rectal exam (DRE), trans-rectal ultrasonography (TRUS), and prostate specific antigen-based testing (PSA) (6, 7).
Since PSA is primarily produced in the prostate and is therefore relatively prostate specific, it was proposed that a sharp but consistent increase in serum PSA was indicative of exponential prostate cell growth, as might occur in PCa (8). PSA test had been validated for detecting PCa using any serum level above the empirically determined cutoff of 4ng/mL (9). PSA's use as a marker for PCa was soon limited by the many instances of BPH that were also associated with an increased serum PSA above the 4ng/mL cutoff, and especially in the range of 4-10ng/mL (10).
Serum PSA testing for the early detection of PCa has a sensitivity of around 86% and a specificity of approximately 33%, depending on patient's age and local prevalence of disease (11, 12). These problems have formed the basis for much controversy surrounding PSA's use as a regular blood-based screening tool for PCa (13, 14). As such, the search for novel PCa biomarkers, especially from non-invasive fluids, has been ongoing (15, 16).
As a promising powerful biological research technology, proteomics has recently become a chief tool in the identification of disease biomarkers (12). One major advantage of proteomics is its ability to concurrently check the whole proteome or sub-proteomes such that differentially expressed or modified proteins corresponding to a disease condition can be identified. This enables researchers to merge several protein markers together to form panels of protein markers with higher sensitivity and specificity for the detection and screening of a disease. Because a cancer proteome is an exceptionally complex biological sample which contains information from almost all the biological activities that take place in cancer cells, cancer tissue microenvironment, and cancer cell-host interaction (17), 2D SDS-PAGE is not suitable as it is time-consuming, technically challenging, requires special concern to achieve tolerable comparability/reproducibility and is not ideal for the analysis of smaller polypeptides (<10 kDa) (18, 19).
As an alternative to 2D SDS-PAGE, the shotgun proteomics “bottom-up approach” has evolved. Shotgun proteomics involve the proteolytic digestion of the protein into relatively small peptides whose m/z can be accurately determined by mass spectrometry. The generated peptides are then separated in one or more successive steps of liquid chromatography, analyzed by tandem MS (MS/MS), and the information is processed with bioinformatic tools to obtain the protein composition of the original sample (20, 21). A major advantage for this approach is that it will simplify the complexity of the cancer proteome as all the proteins will be cleaved into smaller peptides and fractionated, and then the identity of the proteins present in the sample is revealed either according to their sequence or to their m/z spectra through peptide mass fingerprinting (PMF).
Urine is considered a specific filtrate of blood; the protein components of urine are qualitatively similar to those of blood but quantitatively more diluted (22). Generally, it contains highly soluble proteins and peptides of low molecular weight (<30 kDa) which facilitate analyzing such polypeptides in their natural state (23). An advantage for urine over blood is that urinary polypeptides are stable and do not undergo significant proteolysis within several hours of collection in contrast to blood, where activation of proteases and generation of proteolytic breakdown products takes place within minutes of collection (24). Urinary proteomics presents an attractive approach to cancer biomarker discovery, not only for kidney/ urological malignancies (25, 26) but for other systemic malignancies (27, 28).Urinary biomarkers offer a great chance for the development of novel, non-invasive assays for the diagnosis, monitoring and the accurate diagnosis of Pca. Many advantages favor the use of urine for cancer biomarker discovery over blood and tissues samples, including the fact that urine-based tests are absolutely noninvasive, and urine is noninfectious for HIV and less infectious for many other pathogens (29).
In this study, we compared the urinary proteomic profile of 8 PCa patients, 12 BPH patients and 10 healthy males. Shotgun proteomics “bottom-up approach” was used to identify unique differentially expressed urinary proteins by pooling urine samples from each group. Two proteins (Fibronectin, and TP53INP2) were found to be de-regulated in both PCa and BPH patients. We evaluated the deregulation of these two proteins as potential non-invasive urinary biomarkers for the accurate diagnosis of prostate cancer among Benign Prostatic Hyperplasia Patients.
Materials and Methods
Urine sample collection
After approval from the Research Ethics Board at Brock University (St. Catharines, ON, Canada), urine samples were collected from 30 Egyptian males present at Alexandria University's General Hospital (Alexandria, Egypt). Urine samples were collected into 50mL Corning tubes containing Norgen's Urine Preservative Solution (Cat# 18126) (Norgen Biotek, Thorold, ON, Canada). The samples were acquired from among three groups of individuals, each described by a questionnaire completed by the patients' attending physician. Group I urine samples were collected from eight individuals diagnosed with Prostate Cancer (PCa). Group II urine samples were collected from twelve individuals with Benign Prostatic Hyperplasia (BPH). Urine samples from Group III were collected from ten healthy males (Table 1). Urine samples collected from men with other ailments, including Diabetes mellitus, kidney disease, and/or infections such as chronic HBV, HBV/HCV co-infection or Schistosomiasis, were excluded from participation. Each man included in the study was also given a PSA test as part of sample collection. Furthermore, urine samples were collected from the same patients two years from their initial participation in the study; a PSA test was also performed for this second collection.
Table 1
Clinical parameters regarding the males involved with this study
| Healthy Males | Prostate Cancer Patients | Benign Prostatic Hyperplasia Patients | |
|---|---|---|---|
| Number of males | 10 | 8 | 12 |
| PSA Level (ng/mL) | (0.8 ± 0.6) | (7.9 ± 3.0) | (4.9 ± 1.4) |
| HCV or HBV Status | -Ve | -Ve | -Ve |
| Diabetes mellitus | -Ve | -Ve | -Ve |
| Schistosomiasis | -Ve | -Ve | -Ve |
| Kidney diseases | -Ve | -Ve | -Ve |
Isolation of total proteins from urine
Total proteins were isolated from 1mL of urine using the Urine Protein Concentration Micro Kit (Cat# 17400) (Norgen Biotek, Thorold, ON, Canada). The isolation was performed according to the manufacturer's instructions.
Isolation of total RNA from urine
Total RNA was isolated from 2.5mL of urine using the Urine Total RNA Purification Maxi Kit (Slurry Format) (Cat# 29600) (Norgen Biotek, Thorold, ON, Canada). The isolation was performed according to the manufacturer's instructions.
Profiling of Pooled Urinary Proteins by LC-MS/MS
Before analysis, pooled protein samples were first digested in 25mM ammonium bicarbonate, using 0.1μg of trypsin in a total volume of 50μL. After an overnight incubation at 37°C, the peptide solution was then lyophilized by SpeedVac centrifugation and subsequently re-suspended in 20μL of 0.1%TFA (Tri-Fluoro Acetic Acid). The LC/MS-MS experiment was performed at Sick-Kids Hospital (Proteomics Facility, Toronto, ON, Canada) using an on-line LC-MS/MS setup that employed an Agilent 1100 capillary liquid chromatography system (Palo Alto, CA, USA) that was fitted to an LTQ ion trap mass spectrometer (Thermo Electron, San Jose, CA, USA). A Carbon-18 pre-column (150µm i.d. x 5.0cm length) and a µLC analytical column (75µm x 10cm), which also served as a µESI emitter, were used for the separation of the digested proteins.
The samples were first injected into the pre-column for de-salting and then eluted into the analytical column for further separation. For the reverse-phase chromatography (C-18 column), a 60 minute gradient elution from water to acetonitrile, and always containing 0.1% TFA, was performed at a flow rate of 0.2~0.3μL/min. The mass spectrometer was set to data-dependent mode, which automatically cycled through the acquisition of full-scan mass spectrums. Six further spectra were then sequentially recorded on the six most abundant ions present upon the initial scan. A dynamic exclusion time of 90 seconds was used throughout.
The LC-MS/MS data were initially obtained in *.RAW format, which were then converted into mzXML, basically a list of mass peaks. The lists were then used as input in a search of the human NCBI-NR database using the GPM XE (www.thegpm.org) search tool. Search results were then assessed in Scaffold (www.proteomesoftware.com). Acquired MS/MS data was also compared against three other databases: NCBI's non-redundant database, SwissProt and the MDSB database, all using the Mascot search tool (Matrix Science, London, UK).
Relative expression profiling for candidate proteins using RT-qPCR
Relative mRNA expression levels for the 3 candidate proteins (Cadherin 1, Fibronectin, and TP53INP2), determined from the shotgun proteomic analysis were analyzed among the PCa group, BPH group and the health male group. Candidate proteins were reversibly-transcribed using a 3 µl RNA template and 0.5 µl 0.5μg/μL Oligo (dT)18 Primer. The reaction was then made up with RNase-free water to 10μL then incubated for 5 mins at 70°C then held at 4°C. During the 4°C incubation, a mix of 4µl 5X first strand Buffer, 2µl of 0.1mM DTT, 1µl of 10mM dNTPs, 0.5µl SuperScript III (Invitrogen) and 2.5µl nuclease-free water were added to the initial reaction for a final reaction volume of 20µL. The final reaction was then incubated at 25°C for 5 min, 50°C for 30 min, 70°C for 15 min with a final hold at 4°C. All samples were analyzed using the iCycler iQ real time PCR detection system with iQ SYBR Green Supermix (BioRad Laboratories, Mississauga, ON, Canada). For each sample, 3μl from its corresponding RT reaction were mixed in a 10μl iQ SYBR Green Supermix, 6.76μl nuclease-free water and 0.12μl Cadherin 1 (F) 5'- AAGAAGCTGGCTGACATGTACGGA -3', Cadherin 1 (R) 5'- CCACCAGCAACGTGATTTCTGCAT -3'/ Fibronectin (F) 5'- AAACTTGCATCTGGAGGCAAACCC -3', Fibronectin (R) 5'- AGCTCTGATCAGCATGGACCACTT -3'/ TP53INP2 (F) 5'- AGGCCCTGAAATCTGAAGGGCTTA -3' and TP53INP2 (R) 5'- AGTTCTAGCACCTTGGGCTTGTGA -3' in a total of 15μl reaction. All RT-qPCR experiments were carried out in triplicate and the expression levels were normalized to 5S rRNA levels. The relative expression level (fold change) for each candidate miRNA within each group was then calculated using the equation 2-∆Ct test / 2-∆Ct control.
Results
LC-MS/MS Shotgun Analysis
Liquid Chromatography coupled with tandem Mass Spectrometry (LC-MS/MS) analysis of the proteins pooled from the healthy male group, the PCa group and the BPH group resulted in 2062, 1514 and 2527 spectra for each of the respective samples. By analyzing the different spectra generated by the HPLC-MS/MS analysis with MASCOT, X! Tandem on-line search engines and the Scaffold proteome software, a total of 28 individual proteins in the healthy control sample, 41 in the BPH and 31 in the PCa sample were identified. Proteins were then classified based on the likelihood of their presence within each of the three-pooled samples. Of the identified proteins, 10 were common to all three groups: uromodulin, variants of Alpha-1 anti-trypsin, Alpha-2-glycoprotein-1, Ig lambda chain V region, Immunoglobulin light chain constant region, Fibrinogen gamma chain, Glutaminyl-peptide cyclotransferase, Hemopexin, Human Ferritin L Chain and Leucine-rich α-2-glycoprotein-1
Furthermore, there were sixteen proteins unique to the PCa group: Human Serum Albumin Complexed with Myristate and Aspirin; Apolipoprotein-D; Prostaglandin H2 D-isomerase; Ig A1 Bur; G-protein coupled receptor 115; Cadherin-1; α-N-acetylglucosaminidase; Pro-epidermal growth factor; Apolipoprotein-J precursor; Human Beta-Defensin-1; Matrilin-4; CD14 antigen; Chemokine-like factor superfamily-5 isoform a; Fibronectin precursor; Immunoglobulin-kappa light chain variable region; and SLURP1. Another sixteen proteins were found to be unique to the BPH group, they were: α-1-microglobulin/bikunin pre-pro-protein; α-1 acid glycoprotein-2 precursor; Pepsinogen-3; Kininogen-1; Phosphoinositide-3-kinase interacting protein-1; Immunoglobulin heavy chain; Coagulation factor-II (thrombin); IgA-H; Amylase; Apolipoprotein-H; VASN protein; CD44 molecule; Protein-C inhibitor; EPH receptor B3; CD59 antigen pre-pro-protein; and Vitronectin. Ten proteins were identified in both the BPH and control groups and were notably absent from the PCa group, they were: hCG-1996769; complement component-3 precursor; retinol binding protein-4; myosin VA; haptoglobin; keratin-13; defensin HNP1; delta-globin; PRO-2675; and hCG-1817845
There were eight proteins found in the control group that were notably missing from both the PCa and BPH samples, they were: Lipopolysaccharide binding protein; Janus kinase and microtubule interacting protein-2; Polyamine modulated factor-1 binding protein-1; α-mannosidase-II; Apolipoprotein-A-I; Zinc finger protein; ACSF3 protein; and Chloride intracellular channel-1. Another five proteins were absent from the control sample but were present in both the pooled PCa and BPH samples, they were: Apo-Human Serum Transferrin (Non-Glycosylated); Nidogen 1 precursor; N-ethylmaleimide-sensitive factor attachment protein; CTCL tumour antigen; and Tumour Protein 53 Inducible Nuclear Protein 2 (TP53INP2).
Determining the Expression of Cadherin-1, Fibronectin and TP53INP2 mRNA among individual Prostate Cancer samples by RT-qPCR
Employing RT-qPCR, mRNA levels among individual samples were compared to the average expression levels of the healthy control group. Transcript expression for each sample was first normalized against the sample's own content of 5S rRNA. Relative expression was then calculated as LOG2 fold change values according to equation: LOG2 (2-∆Ct (target mRNA) PCa / 2-∆Ct (target mRNA) Mean Healthy Control) (Table 2).
Table 2
LOG2 fold change values for the expression of: Cadherin-1, Fibronectin and TP53INP2 mRNAs among initially collected PCa samples.
| LOG2 Fold Change (PCa / Average Healthy Control) | |||
|---|---|---|---|
| Sample ID | Cadherin-1 | Fibronectin | TP53INP2 |
| PCa 1 | 4.91 | -4.24 | -9.36 |
| PCa 2 | -7.39 | -0.04 | -14.76 |
| PCa 3 | -4.39 | -10.14 | -23.86 |
| PCa 4 | -1.49 | -2.94 | 0.34 |
| PCa 5 | -6.69 | -7.14 | -4.76 |
| PCa 6 | -1.09 | -2.44 | -0.96 |
| PCa 7 | N/A | -2.64 | 0.04 |
| PCa 8 | 0.81 | -6.84 | 0.24 |
(Red - Two fold or more up-regulated, Green - Two fold or more down-regulated and Black - Minimally Deregulated) (Relative to average healthy group expression)
In contrast to mass spectrometry data that showed Cadherin-1, Fibronectin and TP53INP2 proteins to be present in the pooled PCa sample and not in the healthy control sample, mRNA levels for the corresponding proteins (especially Fibronectin and TP53INP2) were widely down-regulated amongst individual PCa samples. In particular, Fibronectin mRNA was found to be down-regulated in seven of the eight PCa samples. TP53INP2 mRNA was found to be down-regulated in half of PCa samples. Cadherin-1 mRNA on the other hand was found to be up-regulated in one sample, unchanged in one and down-regulated in the remaining five PCa. Figure 1 illustrates the percentage of initially collected PCa samples with either up, down or minimal deregulation, for each of the three target mRNAs.
Screening for Deregulation of Fibronectin and TP53INP2 among BPH Samples by RT-qPCR
Since both Fibronectin and Cadherin-1 proteins were specifically identified by mass spectrometry in the pooled PCa sample, but only Fibronectin mRNA (and not Cadherin-1 mRNA) was consistently down-regulated among initially collected PCa samples it was decided that only Fibronectin mRNA expression would be evaluated in the initially collected BPH samples. Analysis then revealed that Fibronectin mRNA was variably expressed in BPH, down-regulated in eight of the twelve initially collected BPH samples (67%), unchanged in one (8%) and up-regulated in three (25%) (Table 3).
Since the TP53INP2 protein was originally identified by mass spectrometry in both PCa and BPH, and since its mRNA was considerably down-regulated in half the PCa samples, its expression was also evaluated among individual BPH samples. Expression analysis among the initially collected BPH samples revealed that TP53INP2 mRNA was predominantly down-regulated. TP53INP2 mRNA was down-regulated in ten of the twelve samples (83%) (Table 3). Figure 2 illustrates the percentage of initially collected BPH samples with either up, down or minimal deregulation, for both Fibronectin and TP53INP2 mRNA.
Figure 1
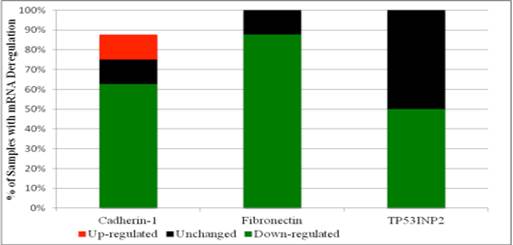
Percentage of initially collected PCa samples with either up, down or minimal deregulation in the expression of mRNAs for: Cadherin-1, Fibronectin or TP53INP2.
Figure 2
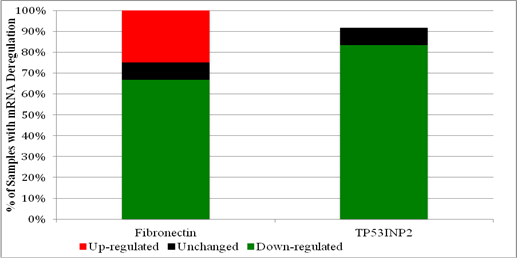
Percentage of initially collected BPH samples with up, down or minimal deregulation in the expression of mRNAs for: Fibronectin or TP53INP2.
Table 3
LOG2 fold change values for the expression of: Fibronectin and TP53INP2 mRNAs among initially collected BPH samples.
| LOG2 Fold Change (BPH / Average Healthy Control) | ||
|---|---|---|
| Sample ID | Fibronectin | TP53INP2 |
| BPH1 | -5.14 | -0.96 |
| BPH2 | -5.04 | -21.36 |
| BPH3 | -6.34 | -16.56 |
| BPH4 | -2.94 | -1.96 |
| BPH5 | 3.06 | -12.86 |
| BPH6 | -2.14 | -3.26 |
| BPH7 | -6.24 | -21.76 |
| BPH8 | -6.74 | -6.56 |
| BPH9 | -0.54 | N/A |
| BPH10 | 1.26 | -13.96 |
| BPH11 | 1.86 | -12.06 |
| BPH12 | -2.69 | -10.56 |
(Red - Two fold or more up-regulated, Green - Two fold or more down-regulated and Black - Minimally Deregulated) (Relative to average healthy group expression)
Re-evaluating Fibronectin and TP53INP2 mRNA expression in PCa samples after two years
Since both Fibronectin and TP53INP2 mRNA appeared to be down-regulated in at least half of the initially collected, PCa and BPH samples, it was decided to re-evaluate expression levels for the PCa samples as part of the two year follow-up. Expression levels were again determined by RT-qPCR, on RNA isolated from urine samples collected two years subsequent to the initial collection. For every sample, both transcripts were normalized against the sample's own content of 5S rRNA. Differential expression was then determined by comparing expression against the average healthy group's level. Relative expression was then calculated as LOG2 fold change values according to the equation: LOG2 (2-∆Ct (target mRNA) PCa / 2-∆Ct (target mRNA) Mean Healthy Control) (Table 4).
Analysis revealed that both Fibronectin and TP53INP2 mRNA were down-regulated in six of the eight PCa samples (75%). For Fibronectin mRNA this was a drop from the seven out of eight samples observed previously to be down-regulated (Figure 3). Interestingly however, despite this drop in frequency (of down-regulation), after two years many of the same PCa samples (PCa 3, 5, 6, 7, 8) had maintained their initially observed down-regulation of Fibronectin mRNA. Only PCa samples 1 and 4 had changed, becoming up-regulated or unchanged (respectively) with respect to the mean level of the original healthy control group. For TP53INP2 mRNA levels, down-regulation was more frequent after two years (75% versus 50%), occurring in three additional samples, PCa 4, 6 and 8. Meanwhile some of the other patients (PCa 1, 2, 5) maintained their down-regulation in TP53INP2 mRNA.
Table 4
LOG2 fold change values for the expression of: Fibronectin and TP53INP2 mRNAs among PCa samples collected after two years.
| LOG2 Fold Change (PCa / Average Healthy Control) | ||
|---|---|---|
| Sample ID | Fibronectin | TP53INP2 |
| PCa 1 | 1.66 | -7.66 |
| PCa 2 | -5.24 | -4.66 |
| PCa 3 | -2.54 | N/A |
| PCa 4 | -0.54 | -13.46 |
| PCa 5 | -2.74 | -2.36 |
| PCa 6 | -1.34 | -18.86 |
| PCa 7 | -7.34 | N/A |
| PCa 8 | -1.14 | -6.86 |
(Red - Two fold or more up-regulated, Green - Two fold or more down-regulated and Black - Minimally Deregulated) (Relative to average healthy group expression)
Figure 3
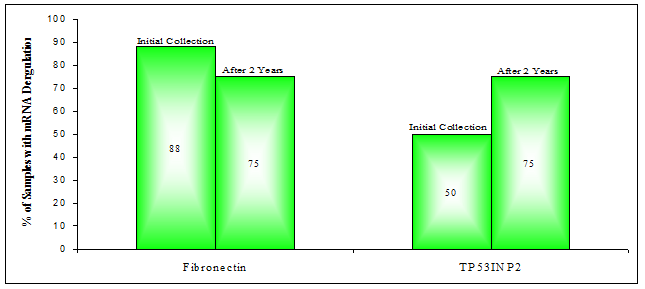
Percentage of PCa samples with down-deregulation in the expression of mRNAs for: Fibronectin or TP53INP2. (Determined by RT-qPCR)
Re-evaluating Fibronectin and TP53INP2 mRNA expression in BPH samples after two years
Since deregulation of either Fibronectin or TP53INP2 appeared to be common in PCa and BPH samples, even after two years, it was decided to re-evaluate their expression levels in the BPH samples that were collected after two years. It should be noted that of the original twelve BPH patients, only eight were successfully located for follow-up testing; of the eight, four happened to be diagnosed with PCa at this point (BPH patients 1, 9, 10 and 11).
Expression analysis by RT-qPCR revealed that Fibronectin mRNA was now down-regulated in only two of the eight BPH samples (25%), down from the previous 67% (Figure 4). Interestingly, two of the four BPH patients who were found to have PCa at the second diagnosis, did in fact have down-regulation of Fibronectin mRNA in their urine after two years. The first, BPH 1, had shown such deregulation as early as two years prior, during the initial collection; BPH 10 on the other hand went from Fibronectin being 2.4 fold up-regulated to 4.7 fold down-regulated after two years (Table 5). TP53INP2 mRNA expression was, after two years found to be at least two fold down-regulated in seven of the eight BPH samples (88%) versus ten out of twelve previously (83%), a roughly consistent fraction.
Table 5
LOG2 fold change values for the expression of: Fibronectin and TP53INP2 mRNAs among BPH samples collected after two years.
| LOG2 Fold Change (BPH / Average Healthy Control) | ||
|---|---|---|
| Sample ID | Fibronectin | TP53INP2 |
| BPH1 | -5.34 | -4.36 |
| BPH4 | 4.16 | -1.36 |
| BPH6 | 3.06 | -3.36 |
| BPH7 | 0.56 | -9.76 |
| BPH9 | -0.74 | -8.36 |
| BPH10 | -2.24 | N/A |
| BPH11 | 0.06 | -13.86 |
| BPH 12 | 1.96 | -14.06 |
(Red - Two fold or more up-regulated, Green - Two fold or more down-regulated and Black - Minimally Deregulated) (Relative to average healthy group expression)
Figure 4
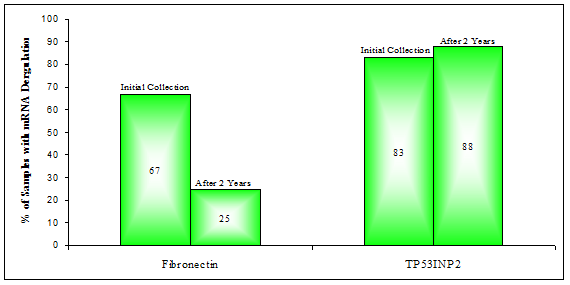
Percentage of BPH samples with down-deregulation in the expression of mRNAs for: Fibronectin or TP53INP2
Diagnostic Utility of Fibronectin & TP53INP2 for Diagnosing Prostate Cancer
To evaluate the potential for using the aberrant expression of Fibronectin or TP53INP2 mRNA for diagnosing PCa, the medical records, specifically PSA values and clinical diagnoses for all BPH patients were updated as part of the two-year follow-up. It should be noted that all BPH patients were therefore diagnosed twice, once initially and then again after two years. Interestingly, during the second assessment it was discovered that four of the BPH patients in fact had PCa, they were: BPH 1, 9, 10 and 11 (Table 6).
By comparing putative diagnoses (of PCa) made using mRNA deregulation against the actual clinical diagnoses, the sensitivity and specificity for using at least two fold down-regulation of Fibronectin and TP53INP2 (separately or in tandem) for diagnosing PCa were determined. The following criteria were applied: patients with a positive clinical diagnosis and exhibiting down-regulation of either Fibronectin or TP53INP2 or deregulation of both, were considered true positives; patients with a positive clinical diagnosis and not exhibiting down-regulation of either gene (either separately) or only one gene (in tandem) were considered false negatives; patients with a negative clinical diagnosis and exhibiting down-regulation of either Fibronectin or TP53INP2 or deregulation of both, were considered false positives; and patients with a negative clinical diagnosis and not exhibiting down-regulation of Fibronectin or TP53INP2 or exhibiting down-regulation of only one or neither (when combined), were considered true negatives.
By applying the above-mentioned criteria, both sensitivity and specificity for using down-regulation in Fibronectin and/or TP53INP2 for diagnosing PCa were determined. Using Fibronectin mRNA down-regulation on its own to diagnose PCa resulted in a sensitivity of 75% and a specificity of 50%, while using TP53INP2 mRNA down-regulation on its own to diagnose PCa resulted in a sensitivity of 76% and specificity of 7%. Furthermore, the sensitivity and specificity for using the tandem down-regulation of both genes for diagnosing PCa was 47% and 53%, respectively. The sensitivity and specificity for a panel employing down-regulation of both genes and an elevated serum PSA (≥4ng/mL) for detecting PCa was 35% and 73%, respectively. Table 7 summarizes the sensitivity and specificity values for the various assays.
Table 6
Diagnosing PCa among BPH Patients by Assessing Deregulation of Fibronectin and TP53INP2 mRNA.
| Sample ID | Initial Urine Collection | Urine Collection After 2 Years | ||||||
|---|---|---|---|---|---|---|---|---|
| LOG2 Fold Change (BPH / Avg Control) | Clinical Diagnosis for PCa | Serum PSA Levels (ng/mL) | LOG2 Fold Change (BPH / Avg Control) | Clinical Diagnosis for PCa | Serum PSA Levels (ng/mL) | |||
| Fibronectin | TP53INP2 | Fibronectin | TP53INP2 | |||||
| BPH1 | PCa | Healthy | Healthy | 4.3 | PCa | PCa | PCa | 3.9 |
| BPH2 | PCa | PCa | Healthy | 5.6 | N/A | N/A | N/A | N/A |
| BPH3 | PCa | PCa | Healthy | 3.9 | N/A | N/A | N/A | N/A |
| BPH4 | PCa | PCa | Healthy | 5.8 | Healthy | PCa | Healthy | 9.6 |
| BPH5 | Healthy | PCa | Healthy | 2.4 | N/A | N/A | N/A | N/A |
| BPH6 | PCa | PCa | Healthy | 5.1 | Healthy | PCa | Healthy | 4.8 |
| BPH7 | PCa | PCa | Healthy | 6.9 | Healthy | PCa | Healthy | 4.2 |
| BPH8 | PCa | PCa | Healthy | 3.7 | N/A | N/A | N/A | N/A |
| BPH9 | Healthy | N/A | Healthy | 4.3 | Healthy | PCa | PCa | 10.5 |
| BPH10 | Healthy | PCa | Healthy | 5.1 | PCa | N/A | PCa | 9.8 |
| BPH11 | Healthy | PCa | Healthy | 7.4 | Healthy | PCa | PCa | 4.2 |
| BPH12 | Healthy | PCa | Healthy | 3.8 | Healthy | PCa | Healthy | 9.4 |
Table 7
Diagnostic Utility of Fibronectin and TP53INP2 for Diagnosing PCa.
| Candidate Biomarker(s) | Sensitivity (%) | Specificity (%) |
|---|---|---|
| Fibronectin | 75 | 50 |
| TP53INP2 | 76 | 7 |
| Fibronectin/TP53INP2 | 47 | 53 |
| Fibronectin/TP53INP2/PSA | 35 | 73 |
Discussion
Proteomics studies are useful for identifying cancer biomarkers. Traditional techniques such as two-dimensional gel electrophoresis have typically been used for this purpose - in one instance to identify proteins uniquely expressed by androgen stimulation of PCa cells (30). In contrast, more modern proteomics studies rely on either protein microarray or mass spectrometry to identify specific proteins; both of which have also been successfully employed towards the study of cancer, including PCa (31). Nonetheless, the number of successful high-throughput studies that have assessed proteins, especially from the urine of patients with PCa and/or BPH has been minimal (32). Therefore in this study, urinary proteins were evaluated by liquid chromatography coupled to tandem mass spectrometry to identify promising protein candidates for a PCa biomarker.
In order to identify those proteins and others that were differentially expressed between the groups, a “bottom-up” shotgun-based analysis using LC-MS/MS was employed. Proteins, pooled into three samples (PCa, BPH and Control) were analyzed using LC-MS/MS to reveal 1514, 2527, 2062 respective spectra. From these spectra, a total of 31 proteins were identified in the PCa sample, 41 in the BPH and 28 in the control. One protein, Tamm-Horsfall Protein (Uromodulin), was common to all three groups. Uromodulin is one of the most abundant proteins in urine (33, 34, 35) and normally runs as a monomer around 68kDa on denaturing gels. It is therefore likely that uromodulin, at least in part, formed the band that was observed near 66kDa in many of the samples from this study. Some authors have suggested that depleting abundant proteins before profiling might help to elucidate rare proteins that can be masked by the presence of proteins in such high abundance (36, 37). Unfortunately depleting highly abundant proteins, which can act as transporters or carriers of other macromolecules, can also lead to the loss of other potentially important proteins (38).
Importantly, pooled analysis identified at least two proteins, found only in the cancer sample, that are acknowledged in the literature as potentially being involved with cancer: Cadherin-1 (E-Cadherin) and Fibronectin precursor proteins. In many cancers, the down-regulation or complete loss of E-Cadherin is reported to correlate to tumour malignancy (39). Lack of E-Cadherin, an epithelial glycoprotein, which mediates cell-cell adhesion (40), has even been associated with a poor prognosis in PCa patients (41, 42). Furthermore, a decrease in E-Cadherin expression has been associated with an invasive and metastatic phenotype, also in PCa (42, 43, 44). In light of its potential contribution to the development and progression of PCa, and to assess its utility as a candidate biomarker for PCa, Cadherin-1 was selected for further evaluation among individual urine samples.
Fibronectin, another protein identified via pooled analysis, is normally present in the Extracellular Matrix (ECM) (45). ECM normally also contains adhesion molecules such as laminins, fibronectins, glycoproteins, chondroitins, heparin sulfate, collagens, tenascins, proteoglycans, etc. that together complete a complex network that forms the basis of connective tissues. Furthermore these molecules are typically produced locally and by cells that are adjacent to the ECM (45). The ECM serves a diverse role, aiding in anything from the regulation of cellular differentiation to migration, tissue remodeling and even helping to maintain tissue integrity (46). The ECM and its components have also been shown to play an important role during invasion and metastasis of malignant cells throughout the body (46). Normally it is integrins (cell membrane protein) that connect cells, including prostatic epithelial cells, to the ECM by binding to fibronectin already present in the matrix (47). This interaction is required for proper assembly of fibronectin in the matrix, something that is very important for ECM organization and stability (48, 49). Cancer typically involves an epithelial to mesenchymal transition (EMT), whereby malignant cells can now break loose of their defined position within the microenvironment. This is usually associated with the loss of E-Cadherin and disruption of local ECM (50). To do this, cells not only decrease expression of E-Cadherin but also reduce their expression of integrins, and alter their secretion of ECM components; something that has been shown to occur in invasive PCas (51, 52). It has also been reported that in poorly differentiated PCas, the expression of Fibronectin is significantly reduced, thereby weakening the ECM itself (53). Loss or significant down-regulation of Fibronectin has therefore been proposed as a mechanism for cancer's malignant nature, whereby cancer cells are more readily able to detach from a tumour mass before spreading elsewhere (54). In light of Fibronectin's role in cancer progression particularly with regards to published observations made in PCa, and since it was identified only in the pooled PCa sample (as assessed by mass spectrometry), Fibronectin was selected for further analysis (to assess its candidacy as a potential biomarker for PCa) among the individual urine samples collected during this study.
Another protein, tumour protein-53 induced nuclear protein-2 (TP53INP2), was notably absent from the pooled control but present among both the pooled BPH and PCa samples. TP53INP2 is thought to be a scaffold protein that is normally expressed upon induction by the p53 tumour suppressor protein (55). TP53INP2 is required for proper autophagy (56) a process that occurs when a cell recycles old materials by engulphing them into a lipid membrane and then fusing said membrane with lysosomes, ultimately catabolizing the contents (57). Autophagy is also known to occur during programmed cell death (58); one of the responses p53 is known to regulate (58). Importantly TP53INP2 is thought to possess tumour suppressor-like functionality, which might help explain why in pre- and neoplastic cervical cancers it is the target of various microRNAs that block its expression (59). Possibly as a result of the same mechanism, it was observed that in some instances of colorectal cancer p53 was unable to induce expression of TP53INP2 (60). TP53INP2 has also been observed at unusually low levels in some PCas (61). Furthermore, in a PCa cell line (LNCaP) the drug Genistein, normally used to treat PCa, was shown to up-regulate TP53INP2, among other genes (62). Moreover, it has also been proposed that the occurrence of a specific splice variant of TP53INP2 might be a necessary event in order for malignant cells to invade the ECM (63). Finally, in 2007 a patent was filed that described using measurements of TP53INP2, among other targets, as part of a multivariate signature to monitor the progression of PCa (64). Therefore based on TP53INP2's potential role in cancer, and because it was commonly identified in both pooled PCa and BPH samples, it was selected for analysis among individual samples to assess its candidacy as a potential PCa biomarker.
Based on the aforementioned evidence regarding the selected proteins (Cadherin-1, Fibronectin, TP53INP2) and their probable involvement in the development or progression of malignancy, their utility towards diagnosing PCa was investigated. The expression level of the selected candidate's mRNA (Cadherin-1, Fibronectin and TP53INP2) was assessed on a sample-by-sample basis via RT-qPCR. The first candidate that was investigated by RT-qPCR was Cadherin-1. Initially observed only in pooled PCa by mass spectrometry, Cadherin-1 mRNA was later found to be down-regulated (relative to the average of the healthy group), among a majority of the initially collected PCa samples (63%), but remained unchanged in 13% and even up-regulated in 13%. Assuming elevated levels of mRNA correlate to elevated levels of protein, then an up-regulation of Cadherin-1 mRNA in just one patient would explain why it was observed at all in the mass spectrometry data for pooled PCa proteins. A down-regulation of Cadherin-1 is reported in the literature to correlate with general tumour invasiveness (39). Down-regulation has also been associated with metastases in PCa and is therefore (as was shown in the literature), an indicator of poor prognosis among PCa patients (42). Since down-regulation of Cadherin-1 is likely a prognostic, as opposed to diagnostic factor and because it was not strictly down-regulated in a strong majority of cancer patients, it was considered a second-rate candidate for future testing.
As for Fibronectin, differential expression profiling of its mRNA transcript among initially collected PCa samples revealed down-regulation across 88% of samples and up-regulation among none. The RT-qPCR data on Fibronectin mRNA expression would seem to agree with LC-MS/MS data suggesting that at least one PCa patient presented with fragments of fibronectin in their urine. RT-qPCR data also complements a report in the literature suggesting that down-regulation or complete loss of Fibronectin can promote tumour invasiveness by allowing malignant cells to more easily detach from a tumour mass (54). Due to its putative role in cancer progression and because Fibronectin mRNA was deregulated among a large majority of samples and up-regulated among none, it was selected for further assessment among BPH samples.
TP53INP2, reportedly down-regulated in PCa (51), was found in both PCa and BPH but interestingly not in control when pooled samples were assessed by LC-MS/MS. To investigate this trend, levels of TP53INP2 mRNA were assessed for differential expression in PCa samples by RT-qPCR. Unsurprisingly, TP53INP2 mRNA was down-regulated in 50% of the initially collected PCa samples and up-regulated in none of them. These results further agree with Poustka, who in 2007 proposed using the deregulation of TP53INP2 as part of a multivariate signature to monitor progression in PCa patients. Due to TP53INP2's likely role in PCa and because LC-MS/MS data alluded to its presence in the BPH cohort, some of whom were ultimately diagnosed with PCa, TP53INP2 was selected for further evaluation among BPH patients.
Since down-regulation of both Fibronectin and TP53INP2 were observed among a large percentage of the initially collected PCa samples and due to their literature suggested roles in cancer, the differential expression of Fibronectin and TP53INP2 mRNA was evaluated among BPH samples. Comparing Fibronectin and TP53INP2 mRNA levels in the BPH samples to the average healthy group level revealed a down-regulation among a number of the BPH patients, some of whom were subsequently suspected of and then diagnosed with PCa (BPH1, BPH9, BPH10 and BPH11). Furthermore, differential expression profiling of both transcripts in urine collected from the same patients (both PCa and BPH) after two years seemed to confirm the observations made initially. Since deregulation of Fibronectin and/or TP53INP2 might have foreshadowed a diagnosis of PCa among some of the BPH patients, down-regulation in urine is tentatively proposed as an indicator for PCa that may ultimately be useful for diagnosing or differentiating PCa from BPH.
In order to validate the diagnostic potential of Fibronectin and TP53INP2 mRNA deregulation for predicting PCa, medical records including PSA levels and clinical diagnoses were updated as part of a two-year follow-up. Both genes differed substantially in their ability to accurately detect PCa. At least two-fold down-regulation of Fibronectin mRNA showed the most potential for diagnosing PCa; it had a sensitivity of 75% and specificity of 50%. Fibronectin mRNA deregulation was often successful at identifying PCa samples as positive, but slightly less successful at designating patients with benign disease as negatives. Altogether, Fibronectin displayed a strong ability to predict PCa. The predictive nature of Fibronectin deregulation might reflect its role in the ECM as an essential regulator of cellular differentiation, migration, and tissue remodeling and integrity (46). Interestingly, using urinary Fibronectin mRNA down-regulation to predict PCa resulted in a more specific, albeit less sensitive test than traditional PSA testing which has a sensitivity and specificity of 86% and 33% at the FDA recommended threshold of ≥4ng/mL of blood (65). The improvement in specificity rises dramatically when compared to PSA at a cutoff of ≥2.5ng/mL (98.2% sensitivity and 16.6% specificity) (66). As for TP53INP2 on the other hand, its down-regulation was moderately sensitive (75%), identifying many patients with PCa, but was entirely non-specific (7%), designating many of the benign samples as malignant and being unable to accurately identify more than one negative.
To improve the chances of accurately predicting PCa, various combinations of the identified candidates were evaluated. The sensitivity and specificity for combining both Fibronectin and TP53INP2 down-regulation to detect PCa was 47% and 53%, respectively. Interestingly this combination successfully designated at least one of the malignant and 50% of benign samples within the updated BPH cohort; PSA on the other hand might have correctly designated 75% of those cancers but unfortunately would not have cleared any of the negatives.
When both mRNA-based protein candidates were combined with PSA (cutoff ≥4ng/mL), specificity was increased to 73%; at the same time sensitivity was reduced to 35%. Thus far the protein-based approach has identified at least one potential candidate that merits further study towards the accurate detection of PCa. And although these early results indicate a reasonable sensitivity and specificity, further studies must still be conducted using a larger pool of samples collected over a longer period of time both before and after disease has progressed, to validate their roles in PCa. Employing urine, like in this study, as the basis for a screening assay would be a convenient and non-invasive way to screen more men, and potentially reduce unnecessary biopsies by differentiating PCa from BPH, and if PCa is diagnosed earlier, possibly even reduce PCa mortality rates as well.
Competing Interests
The authors have declared that no competing interest exists.
References
1. Jemal A, Bray F, Center MM, Ferlay J, Ward E, Forman D. Global cancer statistics. Cancer J Clin. 2011;61:69-90
2. SEER Cancer Statistics Review, 1975-2009 (Vintage 2009 Populations), Nat Cancer Institute, Bethesda, MD. Howlader N, Noone AM, Krapcho M, Neyman N, Aminou R, Altekruse SF, Kosary CL, Ruhl J, Tatalovich Z, Cho H, Mariotto A, Eisner MP, Lewis DR, Chen HS, Feuer EJ and Cronin KA. http://seer.cancer.gov/csr/1975_2009_pops09/
3. Boyle P, Severi G, Giles GG. The epidemiology of prostate cancer. Urology Clin North Am. 2003;30:209-217
4. Yin M, Bastacky S, Chandran U, Becich MJ, Dhir R. Prevalence of incidental prostate cancer in the general population: a study of healthy organ donors. The J of Urology. 2008;179:892-895
5. Dunn JE. Cancer epidemiology in populations of the United States—with emphasis on Hawaii and California—and Japan. Cancer Res. 1975;35(11 Pt. 2):3240-3245
6. Mettlin C, Lee F, Drago J, Murphy GP. The American Cancer Society National Prostate Cancer Detection Project. Findings on the detection of early prostate cancer in 2425 men. Cancer. 1991;67:2949-2958
7. Catalona WJ, Smith DS, Ratliff TL, Dodds KM, Coplen DE, Yuan JJ, Petros JA, Andriole GL. Measurement of prostate- specific antigen in serum as a screening test for prostate cancer. N Engl J Med. 1991;324:1156-1161
8. Carter HB, Pearson JD, Metter EJ, Brant LJ, Chan DW, Andres R, Fozard JL, Walsh PC. Longitudinal evaluation of prostate-specific antigen levels in men with and without prostate disease. The J of the American Med Association. 1992;267(16):2215-2220
9. Stamey TA, Yang N, Hay AR, McNeal JE, Freiha FS, Redwine EE. Prostate-specific antigen as a serum marker for adenocarcinoma of the prostate. N Engl J Med. 1987;317:909-916
10. Rao AR, Motiwala HG, Karim OM. The discovery of prostate- specific antigen. BJU Int. 2008;101:5-10
11. Woolf SH. The accuracy and effectiveness of routine population screening with mammography, prostate specific antigen, and prenatal ultrasound: a review of published scientific evidence. Int J Technol Assess Health Care. 2001;3:275-304
12. Hoffman RM, Gilliland FD, Adams-Cameron M, Hunt WC, Key CR. Prostate-specific antigen testing accuracy in community practice. BMC Fam Pract. 2002;3:19
13. Oh WK, Hurwitz M, Richie JP, D'Amico AV, Kantoff PW. Neoplasms of the Prostate. In: (ed.) Kufe DW. et al. Cancer Medicine. Hamilton, Canada: BC Decker Inc. 2003
14. Chou R, Jennifer MC, Tracy D, Christina B, Ian B, Rongwei F, Ken G, Helen CK, Clarence L, Ashley MJ, Bruin R, Kenneth L. Screening for prostate cancer: a review of the evidence for the U.S. Preventive Services Task Force. Annals of internal medicine. 2011;155(11):762-771
15. Pisitkun T, Johnstone R, Knepper MA. Discovery of urinary biomarkers. Mol Cell Proteomics. 2006;5:1760-1771
16. Truong M, Yang B, Jarrard D. Towards the Detection of Prostate Cancer in Urine: a Critical Analysis. The J of Urology. 2012
17. Alaoui-Jamali MA, Xu YJ. Proteomic technology for biomarker profiling in cancer: an update. J Zhejiang Univ Sci B. 2006;7:411-420
18. Ong SE, Mann M. Mass spectrometry-based proteomics turns quantitative. Nat. Chem. Biol. 2005;1:252-262
19. Hanash S. 2-D or not 2-D: is there a future for 2-D gels in proteomics? Insights from the York proteomics meeting. Proteomics. 2001;1:635-637
20. Sun W, Li F, Wu S, Wang X, Zheng D, Wang J, Gao Y. Human urine proteome analysis by three separation approaches. Proteomics. 2005;5:4994-5001
21. Wang L, Li F, Sun W, Wu S, Wang X, Zhang L, Zheng D, Wang J, Gao Y. Concanavalin A-captured glycoproteins in healthy human urine. Mol Cell Proteomics. 2006;5:560-562
22. Oh J, Pyo JH, Jo EH, Hwang SI, Kang SC, Jung JH, Park EK, Kim SY, Choi JY, Lim J. Establishment of a near-standard two-dimensional human urine proteomic map. Proteomics. 2004;4:3485-3497
23. Theodorescu D, Mischak H. Mass spectrometry based proteomics in urine biomarker discovery. World J Urol. 2007;25:435-443
24. Omenn GS, States DJ, Adamski M, Blackwell TW, Menon R, Hermjakob H, Apweiler R, Haab BB, Simpson RJ, Eddes J S, Kapp EA, Moritz RL, Chan DW, Rai AJ, Admon A, Aebersold R, Eng J, Hancock WS, Hefta SA, Meyer H, Paik YK, Yoo JS, Ping P, Pounds J, Adkins J, Qian X, Wang R, Wasinger V, Wu CY, Zhao X, Zeng R, Archakov A, Tsugita A, Beer I, Pandey A, Pisano M, Andrews P, Tammen H, Speicher DW, Hanash SM. Overview of the HUPO Plasma Proteome Project: results from the pilot phase with 35 collaborating laboratories and multiple analytical groups, generating a core dataset of 3020 proteins and a publicly available database. Proteomics. 2005;5:3226-3245
25. Rehman I, Azzouzi AR, Catto JW, Allen S, Cross SS, Feeley K, Meuth M, Hamdy FC. Proteomic analysis of voided urine after prostatic massage from patients with prostate cancer: a pilot study. Urology. 2004;64:1238-1243
26. Irmak S, Tilki D, Heukeshoven J, Oliveira-Ferrer L, Friedrich M, Huland H, Ergun S. Stage-dependent increase of orosomucoid and zinc-alpha2-glycoprotein in urinary bladder cancer. Proteomics. 2005;5:4296-4304
27. Tantipaiboonwong P, Sinchaikul S, Sriyam S, Phncrakul S, Chen ST. Different techniques for urinary protein analysis of normal and lung cancer patients. Proteomics. 2005;5:1140-1149
28. Ye B, Skates S, Mok SC, Horick NK, Rosenberg HF, Vitonis A, Edwards D, Sluss P, Han WK, Berkowitz RS, Cramer DW. Proteomic-based discovery and characterization of glycosylated eosinophil-derived neurotoxin and COOH-terminal osteopontin fragments for ovarian cancer in urine. Clin Cancer Res. 2006;12:432-441
29. Botezatu I, Serdyuk O, Potapova G, Shelepov V, Alechina R, Molyaka Y, Ananév V, Bazin I, Garin A, Narimanov M, Knysh V, Melkonyan H, Umansky S, Lichtenstein A. Genetic analysis of DNA excreted in urine: a new approach for detecting specific genomic DNA sequences from cells dying in an organism. Clin Chem. 2000;46:1078-1084
30. Nelson PS, Han D, Rochon Y, Corthals GL, Lin B, Monson A, Nguyen V, Franza BR, Plymate SR, Aebersold R, Hood L. Comprehensive analyses of prostate gene expression: convergence of expressed sequence tag databases, transcript profiling and proteomics. Electrophoresis. 2000;21:1823- 1831
31. Sreekumar A, Laxman B, Rhodes DR, Bhagavathula S, Harwood J, Giacherio D, Ghosh D, Sanda MG, Rubin MA, Chinnaiyan AM. Humoral immune response to alpha-methylacyl-CoA racemase and prostate cancer. J. Nat. Cancer Inst. 2004;96:834- 843
32. Downes MR, Byrne JC, Dunn MJ, Fitzpatrick JM, Watson RWG, Pennington SR. Application of proteomic strategies to the identification of urinary biomarkers for prostate cancer: a review. Biomarkers: biochemical indicators of exposure, response, and susceptibility to chemicals. 2006;11(5):406-416
33. Wright ME, Han DK, Aebersold R. Mass spectrometry-based expression profiling of clinical prostate cancer. Mol Cell Proteomics. 2005;4:545-554
34. Serafini-Cessi F, Malagolini N, Cavallone D. Tamm-Horsfall glycoprotein: biology and clinical relevance. Am J Kidney Dis. 2003;42:658-676
35. Nagaraj N, Mann M. Quantitative analysis of the intra- and inter-individual variability of the normal urinary proteome. J of proteome Res. 2011;10(2):637-645
36. Poon TC, Johnson PJ. Proteome analysis and its impact on the discovery of serological tumor markers. Clin Chim Acta. 2001;313:231-239
37. Pisitkun T, Johnstone R, Knepper MA. Discovery of urinary biomarkers. Mol Cell Proteomics. 2006;5:1760-1771
38. Mehta AI, Ross S, Lowenthal MS, Fusaro V, Fishman DA, Petricoin EF. 3rd and Liotta LA. Biomarker amplification by serum carrier protein binding. Dis Markers. 2003;19:1-10
39. Birchmeier W, Behrens J. Cadherin expression in carcinomas: role in the formation of cell junctions and the prevention of invasiveness. Biochim. Biophys. Acta. 1994;1198:11-26
40. Kemler R. From cadherins to catenins: cytoplasmic protein interactions and regulation of cell adhesion. Trends Genet. 1993;9:317- 321
41. Umbas R, Isaacs WB, Bringuier PP, Schaafsma HE, Karthaus HFM, Oosterhof GON, Debruyne FMJ, Schalken JA. Decreased E-cadherin expression is associated with poor prognosis in patients with prostate cancer. Cancer Res. 1994;54:3929-3933
42. Richmond PJ, Karayiannakis AJ, Nagafuchi A, Kaisary AV, Pignatelli M. Aberrant E-cadherin and a-catenin expression in prostate cancer: correlation with patient survival. Cancer Res. 1997;57:3189-3193
43. Vleminkx K, Vakaet L, Mareel M, Fiers W, Van Roy F. Genetic manipulation of E-cadherin expression by epithelial tumor cells reveals an invasion suppressor role. Cell. 1991;66:107-119
44. Siitonen SM, Kononen JT, Helin HJ, Rantala IS, Holli KA, Isola JJ. Reduced E-cadherin expression is associated with invasiveness and unfavorable prognosis in breast cancer. Am. J. Clin. Pathol. 1996;105:394-402
45. Bosman FT, Stamenkovic I. Functional structure and composition of the extracellular matrix. J Pathol. 2003;200(4):423-428
46. Jiang WG, Puntis MC, Hallett MB. Molecular and cellular basis of cancer invasion and metastasis: implications for treatment. Br J Surg. 1994;81(11):1576- 1590
47. Hynes RO. Integrins: versatility, modulation, and signaling in cell adhesion. Cell. 1992;69:11-25
48. Schwarzbauer JE, Desimone DW. Fibronectins, Their Fibrillogenesis, and In Vivo Functions. Cold Spring Harb Perspect Biol. 2011;3:a005041
49. Sottile J, Hocking DC. Fibronectin polymerization regulates the composition and stability of extracellular matrix fibrils and cell-matrix adhesions. Mol Biol Cell. 2002;13:3546-3559
50. Weinberg R. The Biology of Cancer. Garland Science. ISBN 9780815340782. 2006
51. Goel HL, Li J, Kogan S, Languino LR. Integrins in prostate cancer progression. Endocr Relat Canc. 2008;15:657-664
52. Knudsen BS, Miranti CK. The impact of cell adhesion changes on proliferation and survival during prostate cancer development and progression. J Cell Biochem. 2008;99:345-361
53. Albrecht M, Renneberg H, Wennemuth G, Moschler O, Janssen M, Aumuller G, Konrad L. Fibronectin in human prostatic cells in vivo and in vitro: expression, distribution, and pathological significance. Histochem Cell Biol. 1999;112:51-61
54. Jia D, Entersz I Butler C, Foty RA. Fibronectin matrix-mediated cohesion suppresses invasion of prostate cancer cells. BMC Cancer. 2012;12:94
55. Nowak J. and Iovanna JL. TP53INP2 is the new guest at the table of self-eating. Autophagy. 2009;5(3):383-384
56. Nowak JC, Archange J, Tardivel-Lacombe P. et al. The TP53INP2 protein is required for autophagy in mammalian cells. Molecular Biol of the cell. 2009;20(3):870-881
57. Rubinsztein DC, DiFiglia M, Heintz N, Nixon RA, Qin ZH, Ravikumar B, Stefanis L, Tolkovsky A. Autophagy and its possible roles in nervous system diseases, damage and repair. Autophagy. 2005;1(1):11-22
58. Mirzayans R, Andrais B, Scott A, Murray D. New Insights into p53 Signaling and Cancer Cell Response to DNA Damage: Implications for Cancer Therapy. J of Biomedicine and Biotechnology. 2012:170325
59. Pereira PM, Marques JP, Soares AR, Carreto L, Santos MA (2010). MicroRNA expression variability in human cervical tissues. PLoS ONE. 2010;5(7):e11780
60. Staub E, Gröne J, Mennerich D, Röpcke S, Klamann I, Hinzmann B, Castanos-Velez E, Mann B, Pilarsky C, Brümmendorf T, Weber B, Buhr HJ, Rosenthal A. A genome-wide map of aberrantly expressed chromosomal islands in colorectal cancer. Molecular Cancer. 2006;5:37
61. Schlomm T, Näkel E, Lübke A, Buness A, Chun FK, Steuber T, Graefen M, Simon R, Sauter G, Poustka A, Huland H, Erbersdobler A, Sültmann H, Hellwinkel OJ. Marked gene transcript level alterations occur early during radical prostatectomy. 2008; 53(2): 333-44.
62. Merchant K, Kumi-Diaka J, Rathinavelu A, Esiobu N, Zoeller R, Hartmann J, Johnson M. Molecular basis of the anti-cancer effects of genistein isoflavone in LNCaP prostate cancer cells. Functional Foods in Health and Disease. 2011
63. Moran-Jones K, Grindlay J, Jones M, Smith R, Norman JC. hnRNP A2 regulates alternative mRNA splicing of TP53INP2 to control invasive cell migration. Cancer Res. 2009;69(24):9219-9227
64. Poustka A. Gene expression signature for the prognosis, diagnosis and therapy of prostate cancer and uses thereof. US Patent Application. 2007 US 20100261617A1
65. Hoffman RM, Gilliland FD, Adams-Cameron M, Hunt WC, Key CR. Prostate-specific antigen testing accuracy in community practice. BMC Fam Pract. 2002;3:19
66. Martins ACP, Borelli-Bovo TJ, Reis RB, Paschoalin EL, Cologna AJ, Suaid HJ. Performance of PSA and of PSA Density in the Diagnosis of Prostate Carcinoma. Acta Cir. Bras. 2002;17(3):07-11
Author contact
![]() Corresponding author: Moemen AK Abdalla, Department of Biochemistry, Faculty of Science, Alexandria University, Egypt. E-mail: demerdashmcom, Telephone: 905-650-9065
Corresponding author: Moemen AK Abdalla, Department of Biochemistry, Faculty of Science, Alexandria University, Egypt. E-mail: demerdashmcom, Telephone: 905-650-9065
Citation styles
APA
Haj-Ahmad, T.A., Abdalla, M.AK., Haj-Ahmad, Y. (2014). Potential Urinary Protein Biomarker Candidates for the Accurate Detection of Prostate Cancer among Benign Prostatic Hyperplasia Patients. Journal of Cancer, 5(2), 103-114. https://doi.org/10.7150/jca.6890.
ACS
Haj-Ahmad, T.A.; Abdalla, M.AK.; Haj-Ahmad, Y. Potential Urinary Protein Biomarker Candidates for the Accurate Detection of Prostate Cancer among Benign Prostatic Hyperplasia Patients. J. Cancer 2014, 5 (2), 103-114. DOI: 10.7150/jca.6890.
NLM
Haj-Ahmad TA, Abdalla MAK, Haj-Ahmad Y. Potential Urinary Protein Biomarker Candidates for the Accurate Detection of Prostate Cancer among Benign Prostatic Hyperplasia Patients. J Cancer 2014; 5(2):103-114. doi:10.7150/jca.6890. https://www.jcancer.org/v05p0103.htm
CSE
Haj-Ahmad TA, Abdalla MAK, Haj-Ahmad Y. 2014. Potential Urinary Protein Biomarker Candidates for the Accurate Detection of Prostate Cancer among Benign Prostatic Hyperplasia Patients. J Cancer. 5(2):103-114.
This is an open access article distributed under the terms of the Creative Commons Attribution (CC BY-NC) License. See http://ivyspring.com/terms for full terms and conditions.