Journal of Cancer
ISSN: 1837-9664
3.2
Impact Factor
ISSN: 1837-9664

 Global reach, higher impact
J Cancer 2015; 6(7):658-670. doi:10.7150/jca.11647 This issue Cite
Research Paper
Galactose as Broad Ligand for Multiple Tumor Imaging and Therapy
Yuxiang Ma, Haiyan Chen, Shanyuhan Su, Tong Wang, Congying Zhang, Guissi Fida, Sisi Cui, Juan Zhao, Yueqing Gu ![]()
Department of Biomedical Engineering, State Key Laboratory of Natural Medicines and School of Life Science and Technology, China Pharmaceutical University, 24 Tongjia Lane, Gulou District, Nanjing 210009, China
Received 2015-1-20; Accepted 2015-4-15; Published 2015-6-1
Citation:
Ma Y, Chen H, Su S, Wang T, Zhang C, Fida G, Cui S, Zhao J, Gu Y. Galactose as Broad Ligand for Multiple Tumor Imaging and Therapy. J Cancer 2015; 6(7):658-670. doi:10.7150/jca.11647. https://www.jcancer.org/v06p0658.htm
Other stylesAbstract
Galactose residues could be specifically recognized by the asialoglycoprotein receptor (ASGPR) which is highly exhibited on liver tissues. However, ASGPR has not been widely investigated on different tumor cell lines except for hepatoma carcinoma cells, which motivates us to investigate the possibility of galactose serving as a board tumor ligand.
In this study, a galactose (Gal)-based probe conjugated with fluorescence dye MPA (Gal-MPA) was constructed for the evaluation of tumor affinities/targeted ability on different tumor cell lines. In the vitro cell study, it was indicated that the fluorescence probe Gal-MPA displayed higher cell affinity to tumor cells (HepG2, MCF-7 and A549) than that of the normal liver cells l02. In the vivo dynamic study of Gal-MPA in tumor-bearing mice (HepG2, MCF-7, A549, HCT116, U87, MDA-MB-231 and S180), it was shown that its high tumor targeted ability with the maximal tumor/normal tissue ratio reached up to 6.8. Meanwhile, the fast tumor-targeted ability within 2 hours and long retention on tumor site up to 120 hours were observed. Our results demonstrated that galactose should be a promising broad ligand for multiple tumor imaging and targeted therapy.
Subsequently, Gal was covalently conjugated to doxorubicin (DOX) to form prodrug Gal-DOX for tumor targeted therapy. The therapeutic results of Gal-DOX than DOX being better suggested that galactosylated prodrugs might have the prospective potential in tumor targeted therapy.
Keywords: Asialoglycoprotein receptor (ASGPR), broad ligand, multiple tumor imaging, multiple tumor targeted therapy, galactosylated, Near-infrared (NIR)
Introduction
ASGPR including asialoglycoprotein receptor 1 (ASGPR1) and asialoglycoprotein receptor 2 (ASGPR2) is reported as a kind of galactose-binding receptor expressed in hepatocytes with a high capacity [1, 2]. When ASGPRs bind its targeted ligands, the complexes can be internalized by clathrin-mediated endocytosis, and the ligands are released from ASGPRs to allow receptors to recycle to the cell membrane. The key to keeping the concentration of receptors on cell surfaces is the fast cycling of the internalized receptors [3]. Owing to the specific binding of galactose to ASGPR, galactose moieties can be used as targeted ligands for drug delivery and internalized by ASGPR-mediated endocytosis [4, 5].
Yang et al [6]. reported that galactose-containing quantum dots (Gal-QDs) could selectively bind to HepG2 cells, and their accumulation after endocytosis could be clearly visualized with a fluorescence microscope. Peça et al [7]. found that poly (DL-lactide-co-glycolide)-co-poly (ethylene glycol)-10%-triblock-galactose conjugates were expected to be useful in liver-specific drug delivery. Galactosylated chitosan-polycaprolactone (Gal-CH-PCLs) could be used as promising carriers for hepatocyte-targeted delivery of curcumin [8].
Unfortunately, few studies are carried out to intensively investigate the affinity of galactose to different tumor cells though early studies reported that ASGPR was also expressed on Caco-2 and HT-29 tumor cells [9, 10]. This intact study motivated us to develop a galactosylated probe for multiple tumor imaging and therapy.
Optical molecular imaging has been applied as a promising modality in tumor diagnosis and targeted therapy. Since Near-infrared (NIR) light (700~900 nm) has a comparatively weak absorption for most tissue chromophores, such as oxyhemoglobin, de-oxyhemoglobin and melanin, it is able to penetrate tissues deeply and be used in small animal studies [12, 13]. ICG, approved by the U.S. FDA, is a kind of hydrophilic organic dye with NIR fluorescence, which is less toxic on cells or tissues [11]. So it is suggested to use ICG or ICG derivatives as contrast agents for NIR fluorescence imaging. The probes, as the contrast agents, should be targeted to the tumor cells quickly. What's more, the probes are supposed to be cleared from other normal organs both completely and quickly. And hydrophilic compounds can be quickly cleared from the body because of the properties like its rapid dissolution.
In this study, hydrophilic ICG derivative MPA was firstly linked with Gal to form a novel fluorescence probe (Gal-MPA) for the imaging of ASGPR over-expressed tumors. Optical properties, cell affinity, cytotoxicity and biodistribution in normal mice and tumor-bearing mice were evaluated. Afterward, anticancer drug DOX was covalently linked with Gal to form Gal-DOX and its anti-tumor efficacy was systematically studied in vitro and in vivo.
Experimental procedure
Materials and Instruments
MPA was homebuilt. 2-Amino-D-galactose hydrochloride, N-hydroxysuccinimide (NHS), rhodamine B (RhB), 1-ethyl-3-[3-diMethylaminopropyl] carbodiimide hydrochloride (EDC) and doxorubicin hydrochloride (DOX) were purchased from Sigma-Aldrich (Shanghai, China). RPMI 1640, streptomycin, penicillin, fetal bovine serum (FBS) and trypsin-EDTA were bought from Gibco (Life Technologies, Shanghai, China). All other reagents used in the study were of certified analytical reagent grade (Shanghai Chemical Reagent, Shanghai, China).
Q-TOF Micro-Mass Spectrometer (Waters, USA) was used to identify structures of products. A laser confocal fluorescence microscopy (FV 1000, Olympus, Japan) was used for in vitro cell fluorescence imaging. Our homebuilt-NIR fluorescence imaging system was used in vivo real-time imaging. The NIR system is composed of an excitation laser (λ= 765.9 nm, N L-FC-2.0-763 laser light), a high-sensitivity NIR CCD camera (PIXIS 512 B, Princeton Instrumentation) and a 800 nm long pass filter for capturing the fluorescence from the tissues. In addition, another 808 nm laser (LIMO, Dortmund, Germany) was incorporated as a background light to obtain animal profiles.
Experiments of Gal-MPA
Synthesis and characterization of Gal-MPA
Gal-MPA was synthesized as following procedures [18]: First, MPA (5.0 mg) was mixed with EDC·HCl (4.8 mg) and NHS (0.6 mg) in anhydrous N, N-Dimethylformamide (DMF, 2.0 mL). The mixture was stirred under the condition of dark and room temperature for 4h. Then the solution was mixed with galactosamine (1.1 mg) dissolved in pyridine (2.0 mL). Next, the mixture was stirred in dark at room temperature overnight. Subsequently, the crude product was dried and obtained in the freezing rotary evaporator. After that, it was purified by Sephadex G10 column with phosphate buffer saline (PBS). Due to the limitation of our fluorescence microscope without NIR fluorescence path, it was necessary to conjugate a visible light dye RhB to galactosamine to form Gal-RhB for in vitro cells fluorescence imaging test [12-17]. Furthermore, its conjugation process was the same with that of Gal-MPA.
UV-vis spectrophotometer (JH 754PC, Shanghai, China) was acquired to record the absorption spectra. Fluorescence spectras of Gal, MPA and Gal-MPA were measured by using an S2000 eight-channel optical fiber spectrofluorometer equipped with a NIR laser (763 nm). For the purpose of characterizing the chemical structure of the probe, the products were identified by Q-TOF Micro Mass Spectrometer (Waters). The Fourier transform-Infrared spectra (FT-IR) was utilized by an FT-IR 8400S spectrometer (Shimadzu. Japan). 1H nuclear magnetic resonance (1H NMR) spectra was recorded by NMR spectrometer (Bruker AV-500 NMR Spectrometer, Germany).
In vitro experiments
Cell culture
The cell lines for the experiment in vitro were purchased from American Type Culture Collection (ATCC, USA). HepG2 (human hepatocellular carcinoma cell line), A549 (human pulmonary epithelial cell line), HCT116 (human colon carcinoma cell line) and L02 (human normal liver cell line) were cultured in RPMI 1640, which were supplemented with 10% FBS, 100 μg/mL penicillin and 100 μg/mL streptomycin. MCF-7 (human breast cancer cell), U87 (human glioblastoma cell line) and MDA-MB-231 (human breast cancer cell line) were cultured in DMEM, which were supplemented with 10% FBS, 100 μg/mL penicillin and 100 μg/mL streptomycin. Cells were preserved at 37 °C in a humidified atmosphere containing 5% CO2.
Qualitative analysis of Cell affinity
For the purpose of investigating the targeted ability of galactose conjugated fluorescence probe, HepG2, MCF-7, A549 and L02 cells were seeded in laser scanning confocal microscope (LSCM) culture dishes with a density of 5×10⁴ cells/well and later incubated at 37°C in a humidified atmosphere of 5% CO2. After the 70% area of culture dishes was occupied by cells, the cells were treated with 10 μM Gal-RhB or RhB solution (Gal-RhB and RhB were adjusted to have the same fluorescence intensity), and subsequently incubated under the same conditions for 2 h. The blocking experiments were performed with an incubation of the cells with saturated galactose for 1 h at 37°C prior to the treatment with Gal-RhB. The red fluorescence of RhB was collected by green light (520 nm) excitation. For Hoechst staining of the nucleus, the cells were incubated with 40 μL of Hoechst 33342 solution (10 μg/mL) for 20 mins and then washed with PBS for three times before being imaged. The experiments were carried out in triplicate (n = 3) [12-17].
Quantitative analysis of Cell affinity
Flow cytometry was used to quantify the uptake of the Gal-RhB and RhB of HepG2 tumor cells and L02 normal cells. About 106 cells were seeded in 6-well plates and incubated overnight. Then Gal-RhB and RhB solution (10 μM) were added into each well after refreshing the RPMI 1640 mediums (Gal-RhB and RhB were adjusted to have the same fluorescence intensity). The blocking experiments were carried out in the same way of the qualitative analysis mentioned above. Cells were washed with PBS (pH 7.0) for three times when they had been incubated for 2 h at 37°C. Subsequently, the cells were digested and centrifugated at 1000 rpm for 5 mins. Then the cells were resuspended in PBS (500 μL) and analyzed by the flow cytometer at once. The experiments were carried out in triplicate (n = 3) [12,17].
Cytotoxicity
MTT assays were performed on various cell lines containing HepG2, MCF-7 and L02 cells for the purpose of evaluating the potential cytotoxicity of Gal, MPA and Gal-MPA. The cells were seeded onto 96-well plates (1×10⁴ cells/well) and then incubated with samples dissolved in PBS for 24 h at 37°C (The concentration of Gal, MPA and Gal-MPA was respectively 100 μM). 10 μL of MTT solution (5.0 mg/mL) was added into each well. Next, after incubating for 4 h, the medium of MTT was gently discarded and then 150 μL of DMSO was added into each for dissolution. Before measuring the absorbance, the plate was carefully shaken. Ten minutes later, all test samples were assayed by ELISA and the cell viability was calculated using the following formula: Cell Viability = Mean absorbance of test wells/ Mean absorbance of untreated control wells ×100%. The experiments were carried out in triplicate (n = 3).
In vivo experiments
Tumor xenografts
All animal experiments were performed in compliance with the Animal Management Rules of the Ministry of Health of the People's Republic of China. The animal research was approved by Jiangsu Science and Technology Department of China (Permit Number: SYXK (SU) 2012-1035). All the experiments were performed with isoflurane (2%) to minimize suffering.
Athymic nude mice (BALB/c-nu) (about 20g), 4 to 6 weeks old, purchased from Shanghai Charles River Laboratories, which were feeding in the specific pathogen free (SPF) conditions (Temperature: 20-24℃, Humidity: 50-70%, Ventilation: 10~20 times air exchanges/h, Light/dark: 14 / 10 h). The cages were mainly made by polycarbonate with stainless steel skylight covers for easy cleansing and sterilization. The 6 nude mice were put in a cage so that they could have sufficient space to move around. The bedding material (pre-processed granulated wooden meal) was replaced every day to keep warm, clean and dry. Nude mice were fed with pre-processed granulated pellets and purified water which were purchased from Charles River Laboratories (Shanghai, China).
They were subcutaneously injected with a suspension of about 5×10⁶ cells (HepG2, MCF-7, A549, HCT116, U87 and MDA-MB-231) in 100 μL PBS (0.01 M, pH7.2) into their axillary fossa. When the size of tumors reached 0.1 cm in diameter, the mice were randomly assigned into three groups (n = 6) and immobilized in Lucite jig for in vivo imaging. The experiments were carried out in triplicate (n = 3) [12-17].
Dynamics and biodistribution of Gal-MPA in nude mice
Gal-MPA (10 nmol) dissolved in 0.2mL of PBS was injected into the tail vein of nude mice bearing L02 normal explant. Meanwhile, a control group was set up by injecting MPA (10nmol) dissolved in 0.2 mL PBS in HepG2 tumor bearing nude mice. Then the home-built NIR imaging system was utilized to assess the distribution of the samples in mice.
Some points were paid attention to: First, NIR fluorescent images were all displayed with the same excitation intensity. Second, a series of images were collected at predetermined time intervals. Third, P/N and L/N ratios were analyzed and compared. Based on the ROI function of the analysis, the ratio was calculated by the formula as follows: P/N ratio = phyma tissue signal/normal signal (muscle), L/N ratio = signal in liver/normal signal (muscle). The experiments were carried out in triplicate (n = 3) [12-17].
Targeted ability of Gal-MPA in tumor-bearing nude mice
The targeted ability of Gal in the probe was evaluated by using two groups of HepG2 tumor-bearing mice. For the purpose of exploring the targeted ability of the probe in different ASGPR over expression tumors, mice bearing HepG2, MCF-7, A549, HCT116, U87 and MDA-MB-231 tumors were administered with Gal-MPA for NIR imaging. To perform the blocking experiments, we injected 0.2 mL saturated galactose 0.5 h before Gal-MPA. Certainly, the formula of P/N and L/N ratios and the concentration of Gal-MPA were all the same as mentioned above.
The usage of ex-vivo imaging was not only confirming the signal source but also comparing the dynamic behavior of Gal-MPA. The mice were sacrificed at a certain time by dislocating the cervical vertebra after injection and the main organs were excised and imaged in dark so as to compare the clearance of the probe. All of the experiments above were carried out in triplicate (n = 3) [12-17].
Assessments of ASGPRs expression level
To evaluate the ASGPRs expression, four cell lines (HepG2, MCF-7, A549 and L02) were utilized by real-time PCR. Briefly, with RNeasy Kit, total RNA was extracted from freshly isolated cancer cells. RNA (3 μg) from each cancer cell line was converted into cDNA by using Superscript III reverse transcriptase. Then cDNA was used for the amplification of real-time PCR with Homo-ASGPR primer.
Homo-ASGPR primer (202 bp): Sense primer: 5′-TGTTGCCATCAATGACCCCTT-3′ and antisense primer: 5′-CTCCACGACGTACTCAGCG-3′; Homo-ASGPR1 primer (81 bp): Sense primer: 5′-GCTGGAGAAACAGCAGAAGG-3′ and antisense primer: 5′-CGCAGGTCAGACACGAACT-3′; Homo-ASGPR2 primer (73 bp): Sense primer: 5′-TCCCAGGAGAGGAAATCCAT-3′ and antisense primer: 5′-CATGGAGCAGAGACGCTGT-3′. The product length was 73 bp.
Experiments of Gal-DOX
Synthesis and characterization of Gal-DOX
Gal-DOX was synthesized by the following method: 9.6 mg EDC and 1.15 mg NHS were added into 2 mL PBS (pH 7.0) with 2.12 mg galacturonic acid (molar ratio of galacturonic acid: EDC: NHS is 1:5:1). After 4 h of stirring, 5.8 mg doxorubicin hydrochloride (DOX) was added into the above activated Gal solution (molar ratio of galacturonic acid: DOX is 1:1). Next, the mixture was stirred in dark at room temperature, and purified by filtration over a Sephadex G10 column.
UV-vis spectrophotometer (JH 754PC, Shanghai, China) was acquired to record the absorption spectras of DOX and Gal-DOX. Fluorescence spectras of DOX and Gal-DOX were measured using an S2000 eight-channel optical fiber spectrofluorometer equipped with a NIR laser (763 nm).
Anti-tumor experiments in vitro
MTT assays were performed on HepG2, MCF-7 and L02 cells for evaluating the anti-tumor effect of DOX and Gal-DOX (DOX and Gal-DOX were adjusted to have the same amount of DOX as 10 μg/mL).The operation of this experiment was the same as 2.2.4.
Acute toxicity experiments
The acute toxicity of DOX and Gal-DOX was investigated on normal mice. 30 ICR mice (aged 4 weeks, weighed 20-22 g, equal number of male and female) were randomized into 3 groups. DOX and Gal-DOX (adjusted to have the same amount of DOX as 5 mg/kg, 0.2 mL) were intravenously injected into 2 groups of mice respectively. The mice under the control group were injected with Saline (0.2 mL).The mice were sacrificed at 7 days post-injection and the major tissues (heart, liver and kidney) were excised for histopathology. The pathological changes of the tissues were evaluated [15].
Therapeutic efficacy in S180 tumor-bearing mice
30 ICR mice with S180 (aged 4 weeks, weighed 20-22 g, equal number of male and female) were randomly assigned into 3 groups and injected in tail vein with saline, DOX, and Gal-DOX separately (DOX, and Gal-DOX were adjusted to have the same amount of DOX as 5 mg/kg, 0.2 mL). Every day each mouse underwent tail vein injections once and the body weight as well as tumor diameter were measured. Survival rate =Ns/Nt ×100% (Ns : the number of surviving mice , Nt : the number of total mice ).
The tumors of 3 groups were excised for histopathology analysis at 15 day post-injection to further investigate the therapeutic effects of DOX and Gal-DOX. Tumor tissues were fixed with 10% neutral buffered formalin and embedded in paraffin. Then tumor tissues were sliced to 8 mm and stained with Hematoxylin and Eosin (H&E) and observed by Olympus optical microscope [15].
Statistical analysis
P values were calculated by the software of Graphpad Prism and data was expressed as mean ± SD. Significant differences were determined by using the Student's t test (p value < 0.05) when there were two variables.
When there were several variables (more than two), one way ANOVA was used to identify whether there was significant difference among these variables. Then, Tukey's Honestly was utilized to find which two groups had significant difference in details.
Results
Synthesis and characterization of Gal-MPA
The Gal was covalently conjugated with MPA through common amidation reaction, as described in Methods (Fig.1). The successful conjugation was characterized by optical spectra, Mass spectrum, FT-IR and 1H NMR respectively.
The absorption and emission spectra of Gal, MPA and Gal-MPA were displayed in Fig. 2 A and Fig. 2 B. The whole characteristic absorption peaks of the constituent components were shown in the absorption spectra of Gal-MPA. A characteristic absorption peak of MPA at 782 nm in the absorption spectra of Gal-MPA and the emission peak of Gal-MPA at 829 nm undoubtedly denominated that Gal-MPA had the same fluorescence property as MPA.
Figure 1
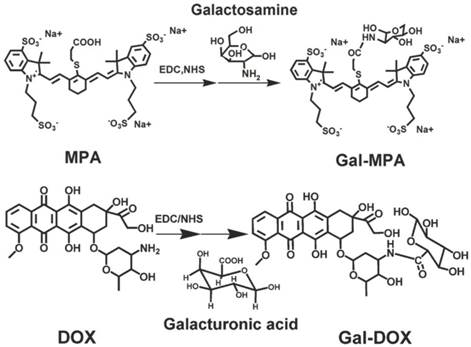
Synthesis routine of Gal-MPA and Gal-DOX.
Figure 2
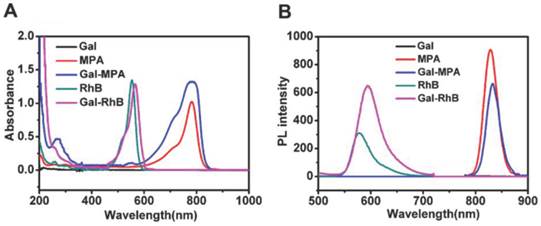
The optical characterizations of Gal-MPA and Gal-RhB. (A) The absorption spectra of Gal, MPA, Gal-MPA, RhB, and Gal-RhB. (B) The emission spectra of Gal, MPA, Gal-MPA, RhB, and Gal-RhB.
Mass spectrum and FT-IR depicted the chemical structure of Gal-MPA. In mass spectrum (Fig. 3 A), the highest peak at 1081.9 m/z indicated the conjugation of MPA and Gal effectively. A new band, caused by secondary amines, existed at 1645.4 cm-1 in FT-IR spectra (Fig. 3 B) called the interactive bonding, which suggested the substitution of the amino group of 2-Amino-D-galactose hydrochloride. The band which centered at 3383.8 cm-1 could be attributed to primary amines stretching. The result from FT-IR spectra of MPA, Gal and Gal-MPA significantly indicated that the emergence of the characteristic stretching and bending vibrations was boosted by the formation of an amide bond linking Gal to MPA. Furthermore, Gal-MPA had the bands of 1100.3 cm-1, 1004.3 cm-1 and 920.6 cm-1, which were similar with the bands of 1107.4 cm-1, 1013.4 cm-1 and 913.7 cm-1 of MPA. Gal-MPA had the band of 2928.5 cm-1 which was comparable to the band of 2942.7 cm-1 of Gal.
The successful conjugation of Gal to RhB for in vitro study was also confirmed by its optical spectra, as shown in Fig. 2 A and Fig. 2 B. The maximum absorption peak at 566 nm and the maximum emission peak at 593.5 nm of Gal-RhB showed that Gal didn't change the optical property of RhB largely.
Figure 3
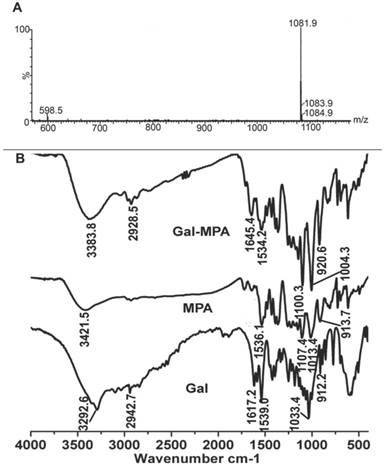
The structural characterizations of Gal-MPA. (A) Q-TOF Micro-MS profile of Gal-MPA ([MH]: 1081.9). (B) Fourier transform infrared (FT-IR) spectra of Gal-MPA.
Qualitative analysis of Cell affinity
Owing to the lack of NIR fluorescence channel in our current fluorescence microscope, Gal-RhB was utilized for in vitro cells fluorescence imaging [12-17]. As shown in Fig. 4, fluorescence images of free RhB and Gal-RhB incubated with different cell lines (HepG2, MCF-7, A549 and L02 cells) for 2 hours were acquired and compared. Obviously, the free RhB did not display any affinity to all the cells. As expected, tumor cells HepG2, MCF-7 and A549 incubated with Gal-RhB exhibited strong fluorescece signals, which indicated Gal-RhB was mediated into the tumor cells through the Gal-ASGPR mediation. Furthermore, the fluorescence intensities were greatly reduced in cancer cells by the prior addition of excess galactose, which implied the competitive binding of free galactose to ASGPR. Much weak fluorescence was scattered in the normal liver cells of L02, which might be due to the low ASGPR expression on L02 cell lines. Quantitative analysis was shown in Fig. 4 E. There were significant differences between the fluorescence intensities of Gal-RhB & RhB and Gal-RhB & blocking in HepG2, MCF-7 and A549 cells.
Quantitative analysis of Cell affinity
The flow cytometry analysis was used to quantitatively investigate the uptake behavior of Gal-RhB in different cells. The result was in keeping consistent with that of cell fluorescence imaging under the microscopy. Fig. 5 displayed the representative cytometry analysis of cancer cells HepG2 and normal liver cells L02 incubated with Gal-RhB. Apparently, more Gal-RhB were mediated into the HepG2 than that of RhB. The blocking experiment with free galactose greatly hindered the uptake of Gal-RhB into the tumor cells. Similar with Fig. 4 D, no significant difference was observed in the uptake of Gal-RhB and RhB by L02 cells.
Cytotoxicity
To assess the cytotoxicity of Gal-MPA, MTT assay was performed at 24 h post-incubated with Gal-MPA on HepG2, MCF-7 and L02 cell lines (Fig. 6 A). Similar profiles were found on these cell lines from the results of the viability. At different concentrations (ranged from 3.125 to 100 μM), Gal-MPA didn′t show any conspicuous cytotoxicity. Even at a high concentration of 100 μM, neither of Gal, MPA nor Gal-MPA exhibited apparent cytotoxicity (Fig. 6 B).
Targeted ability of Gal-MPA in tumor-bearing mice
Same amounts of Gal-MPA were intravenously injected to the tumor-bearing mice (HepG2, MCF-7, A549, HCT116, U87, MDA-MB-231 and S180) to evaluate the dynamics and biodistribution of Gal-MPA. Simultaneously, the blocking experiments with free galactose were also performed under the same conditions. After injection of Gal-MPA, all the mice were healthy and lively with glossy pelage which attributed to the non-toxicity of Gal-MPA.
Figure 4
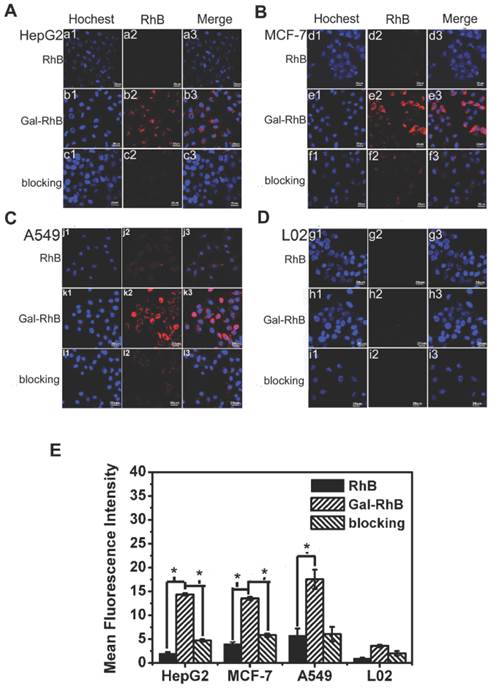
Laser confocal fluorescence microscopy images of (A) HepG2, (B) MCF-7, (C) A549 tumor cells, and (D) L02 normal cells, processed by uptake of RhB and Gal-RhB. (The blocking experiments were performed by adding Gal into the cells before Gal-RhB incubation.) (E) Fluorescence intensity of different samples determined in different cells.
Figure 5
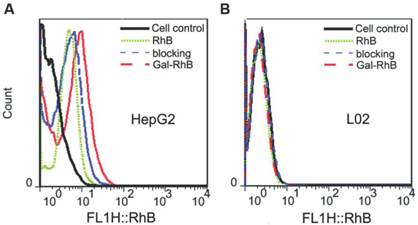
Flow cytometry histograms. Quantative analysis of cell affinity evaluation of different groups (RhB, Gal-RhB and blocking) on (A) HepG2, and (B) L02 cells lines.
Figure 6
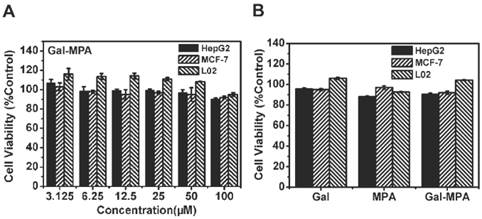
Cytotoxicity assay (24 h). (A) The cell viability of HepG2, MCF-7 and L02 cells incubated with different concentration of Gal-MPA. (B) The cell viability of HepG2, MCF-7 and L02 cells incubated with 100 μM of Gal, MPA, Gal-MPA.
As shown in Fig. 7 A, the fluorescence signal of Gal-MPA in HepG2 tumor-bearing mice was found distributed all over the body at 0.5 h post-injection and accumulating in liver at 2 h post-injection. The tumors could be exactly identified from the surrounding background tissues at 2 h post-injection and the bright signal lasted for 120 h post-injection. On the contrary, no fluorescence appeared in tumor sites with the prior injection of free galactose (Fig. 7 B). The fluorescence in liver was attenuated quickly after 2 hours injection. This may be due to the competitive binding of free galactose to the ASGPR. Similar tendencies were observed in other different tumor-bearing (MCF-7, A549) mice, as shown in Fig. 7 C-E. As shown in Fig. 7 F, the fluorescence signals at 24 h post-injection in the tumor of HCT116, U87, MDA-MB-231 and S180 were strong even though the tumor size was small. The fluorescence ratios at tumor phyma to normal muscle (P/N ratio) and liver organ to normal muscle (L/N ratio) at different time intervals were respectively illustrated in Fig. 7 F and Fig. 7 G. The maximum of P/N ratio was displayed at 6 h post-injection of Gal-MPA, with 6.8±0.212 for HepG2 and 5.8±0.31 for MCF-7 tumor-bearing mice. And significant differences existed in the P/N ratio of HepG2 & L02, HepG2 & MPA, MCF-7 & L02 and MCF-7 & MPA tumor-bearing mice. Interestingly, the L/N in all the experimental mice were relatively lower compared to the tumor sites (Fig. 7 G), which might be due to the higher expression of ASGPR in tumor tissues than in liver tissues. In addition, as observed, Gal-MPA were subsequently clear from the body through the kidney. (Because of the water-solubility of Gal-MPA, it is excreted from the body through the kidney. The fluorescence signal in the site of kidney is due to the emiction of the mouse being imaged. More strong fluorescence signal in kidney will be detected when the bladder of the mice is full of urine. If the mouse do not have urine, the fluorescence signal in the kidney would be much weaker. Galactose can't increase the excretion of the particles from the kidney.)
To confirm the targeted ability of Gal-MPA in tumors, a cohort of experimental tumor-bearing mice were euthanized at different time points and the main organs were excised for ex-vivo fluorescence imaging (Fig. 7 H). Gal-MPA distributed mostly in MCF-7 tumors at 96 h post-injection (Fig. 7 H-a), indicating the long retention time. In the blocking group (Fig. 7H-b), the fluorescence mostly vanished except in the kidney at 12 h, confirming the effective blocking of galactose and renal excretion pathway. Fig. 7 H-c and Fig. 7 H-d showed a similar tendency of fluorescence imaging in organs of HepG2 tumor-bearing mice. The fluorescence intensities in the tumors were distinct regardless of the tumor species. Free MPA didn't show tumor targeted ability (Fig. 7 H-e), which supported the selectivity of Gal-MPA to tumors. So Gal-MPA could be utilized as a broad agent for a variety of tumor diagnosis. Ex-vivo fluorescence images of isolated organs/tissues were consistent with the in vivo imaging, indicating the reliability of in vivo imaging. Additionally, no accumulation of the free dye MPA showed in HepG2 tumor and the liver (Fig. 7 I), testifying that it was not MPA but galactose leading Gal-MPA to enter tumor cells (Fig. 7 A-E). The fluorescence intensities in other organs quickly disappeared within 4h except the kidneys which showed bright fluorescence signal, indicating that the hydrophilic dye MPA had a fast renal clearance.
The dynamics and biodistribution of Gal-MPA in normal mice were shown in Fig. 7 J. The fluorescence in liver organ was gradually attenuated compared to the free MPA, implying the specific binding of Gal-MPA to the ASGPR which was displayed on normal liver cells.
ASGPR expression level
As displayed in Fig. 8, ASGPR expression level in HepG2, MCF-7, A549 and L02 cells explained the reason why the uptake of galactose in tumor cells increased.
Figure 7
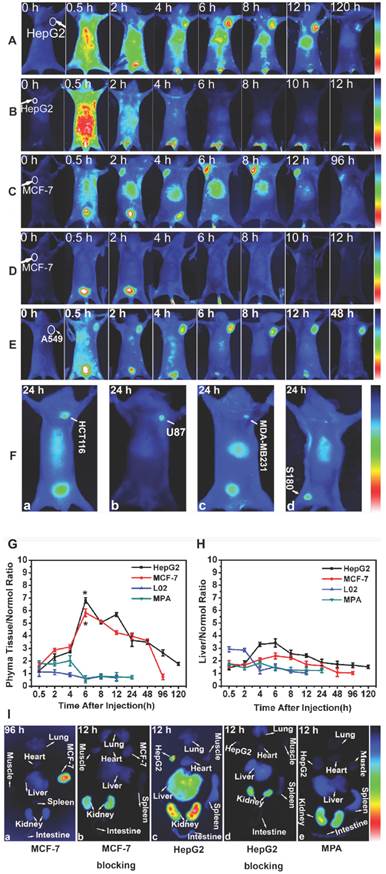
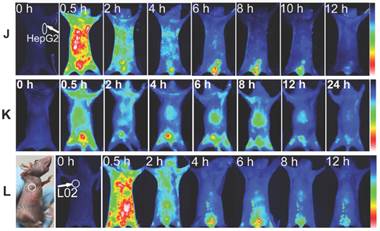
In vivo NIR fluorescence imaging. Target or block experiment of Gal-MPA at different post-injection time intervals in (A, B) HepG2 tumor-bearing mice, (C, D) MCF-7 tumor-bearing mice and (E) A549 tumor-bearing mice. The blocking experiments (B, D) were performed by injecting Gal into the tail vein of nude mice at 0.5 h before Gal-MPA injection. (F)Target experiment of Gal-MPA at 24 h post-injection in (F-a) HCT116, (F-b) U87, (F-c) MDA-MB-231 and (F-d) S180 tumor-bearing mice. (G) Statistical comparison of phyma tissue-to-normal tissue (P/N) ratio of samples in mice. (H) Liver-to-normal tissue (L/N) ratio of samples in mice. (I) Fluorescence images of isolated organs separated from different tumor-bearing mice:(I-a Organs separated from MCF-7 tumor-bearing mouse at 96 h after injecting Gal-MPA. I-b Organs separated from the blocking experiment at 12 h for MCF-7 tumor-bearing mice. I-c Organs separated from HepG2 tumor-bearing mouse at 12 h after injecting Gal-MPA. I-d Organs separated from the blocking experiment at 12 h for HepG2 tumor-bearing mice. I-e Organs separated from HepG2 tumor-bearing mouse at 12 h after injecting MPA.) (J) Fluorescence images of nude mice bearing HepG2 tumor with injection of MPA. (K) Fluorescence images of normal mice with injection of Gal-MPA. (L) In vivo fluorescence images of Gal-MPA in nude mice bearing L02 normal explant at different post-injection intervals.
ASGPR1 was highly expressed in HepG2 cells (Fig. 8 A). The relative ASGPR1 expression level in the different tumor cell lines was in the order of HepG2>MCF-7>A549. The normal liver cells L02 displayed the lowest ASGPR1 expression level. The ASGPR1 expression level was consistent with the order of the tumor targeted abilities. To clarify the function of ASGPR2, its expression level was also plotted in Fig. 8 B.
As for Fig. 4, it analyzed and depicted that the relative fluorescence intensities in HepG2, MCF-7, A549 and L02 cells displayed a similar profile with that of ASGPR1 expression (Fig. 8). It showed that ASGPR1 might be the major receptor for the probe uptake. In contrast, L02 cells with high ASGPR2 expression exhibited weak fluorescence intensities, indicating that ASGPR2 might not be the key receptor for the probe mediation. Furthermore, the addition of free galactose prior to the Gal-RhB incubation successfully blocked the uptake of Gal-RhB probe, implying the mediation mechanism by the ASGPR. So the results above led to a conclusion that the internalization of Gal-RhB into ASGPR1 positive tumor cells (HepG2, MCF-7 and A549) might be a kind of ASGPR1 mediated endocytosis, which could be competitively and effectively inhibited by galactose. Owing to over expression of ASGPR1 in a variety of tumor cell lines, ASGPR1 might be considered as a broad biomarker for tumor diagnosis and targeted therapy.
L02 cells with low expression level of ASGPR1 and high expression of ASGPR2 were implanted into the mice. As expected, Gal-MPA was distributed less in the L02 mass (Fig. 7 L) and the fluorescence disappeared quickly within 4 h, which implied that the uptake of Gal-MPA by tumor cells might be mediated by the binding of galactose to ASGPR1.
Anti-tumor efficacy of Gal-DOX in vitro
To take advantage of the capability of galactosylated compounds in tumor targeted therapy, Gal was covalently conjugated to doxorubicin (DOX) to form prodrug Gal-DOX. MTT assay was carried out, DOX and Gal-DOX were adjusted to have the same amount of DOX on HepG2, MCF-7 and L02 cell lines (Fig. 9). As shown in Fig. 9 A, DOX and Gal-DOX showed dose-dependent anti-tumor activity to HepG2 cells. low concentration of DOX and Gal-DOX exhibited similiar anti-tumor efficacy. At the highest dose of 10 μg/mL, the inhibition ratio of Gal-DOX was 54.3% of total cells, which is much higher than that of DOX (40.1%), And the cell viability of HepG2 and MCF-7 tumor cells incubated with DOX was higher than that of Gal-DOX, with opposite phenomena observed in normal cells L02 (Fig. 9 B ). These results might indicate that the specific binding of Gal to the over-expressed ASGPR1 on the surface of HepG2 and MCF-7 tumor cells increased the intracellular uptake of Gal-DOX through receptor-mediated endocytosis, and thus, enhanced the antitumor activity of Gal-DOX. The normal cells L02 with less ASGPR1 level did show high cell viability, suggesting the low cytoxicity of Gal-DOX on ASGPR1 low expression cells.
Toxicity of Gal-DOX on normal mice
The acute toxicity of Gal-DOX was assessed on normal mice, with DOX and saline as control (Fig. 10). And 7 days post-injection of the samples at the dose of 5 mg/kg, the blood serum was separated for biochemical parameters test and the main organs (heart, liver and kidney) were excised for histological analysis.
Blood serum biochemical parameters
The blood serum biochemical parameters were plotted in Fig. 10 A. ALT, AST and BUN were similar in all the treated groups, while CK displayed significant difference (P<0.05) between DOX and GAL-DOX treated groups.
A rise of ALT was considered as a vital sign of liver damage. Various types of hepatitis and drugs like anti-tumor drugs could definitely increase the amount of ALT, which was caused by liver damage and therefore changing the hepatocyte membrane permeability, leading intracellular ALT transferring towards circulatory blood.
AST existed in tissue cells, most of which was in myocardial cells, less existing in liver cells and the least staying in the blood serum. Only when the heart was seriously necrotized or destroyed can lead to an increase of AST concentration in blood serum.
CK, mainly in the skeletal muscles, brain and myocardium, had a crucial value being utilized in diagnosis of myocardial infarction.
Results indicated that DOX could cause a severe myocardial damage. However, when the DOX was conjugated to Gal, the heart damage was significantly reduced because of the less accumulation of GAL-DOX in heart tissues (Fig. 10 A).
Figure 8
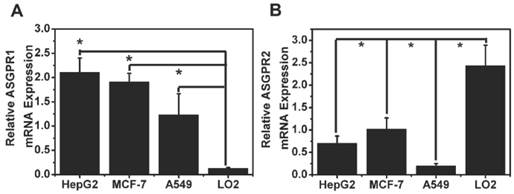
ASGPR expression in HepG2, MCF-7, A549 cancer cells and L02 normal cells.
Figure 9
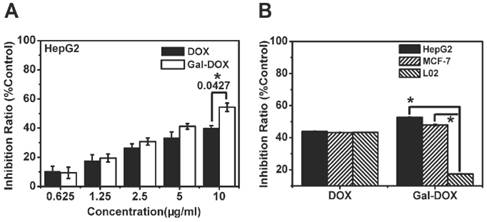
Anti-tumor capability assessment (24 h). (A)The inhibition ratio of HepG2 cells incubated with different concentration of DOX and Gal-DOX. (B)The inhibition ratio of HepG2, MCF-7 and L02 cells incubated with DOX and Gal-DOX (DOX and Gal-DOX were adjusted to have the same amount of DOX as 10 μg/mL).
Figure 10
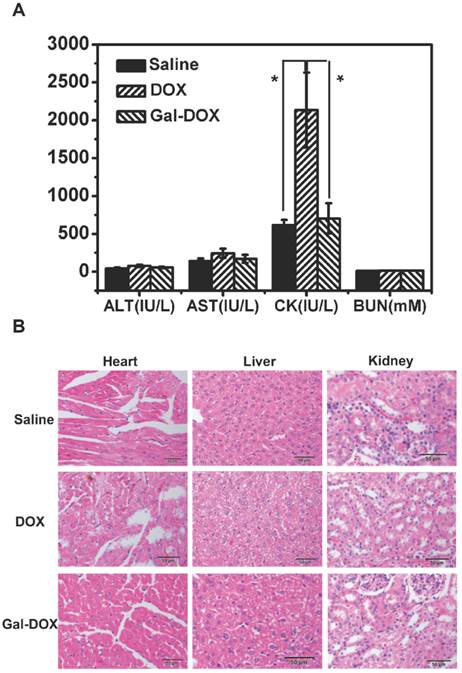
Acute toxicity experiments. (A) The serum ALT, AST, CK and BUN levels after administration of saline, DOX and Gal-DOX after 7 days.(B) Histologic examination on hearts, livers and kidneys from normal mice which were respectively treated by saline, DOX and Gal-DOX at 7-day postinjection.
Histological analysis
Fig. 10 B showed that myocardial fibers of Gal-DOX treated groups and control groups observed on the longitudinal side were clear and nucleus stayed in the middle. There were no damage on epicardium or endocardium and no anapetia, inflammatory cells infiltration and necrosis observed. In contrast, in DOX treated group, several myocardial fibers appeared vacuolar degeneration and little necrosis observed.
For the liver, since much glucogen was stored in endochylema, leading hepatocytes' outline unclear whether the hepatocytes were degenerate or were not verified exactly. However, light vacuolar degeneration was displayed in spite that no obvious necrosis were observed. Membranes of kidneys in each sample looked holonomic. Cortical and medullary areas could be clearly identified. Glomerulus appeared no change of plenty, atrophy or necrosis. Besides, saccules showed no eclasis and membrane cells in saccules didn't increase. The capillary lumen didn't expand. Merely a few of epitheliums showed hydroncus but not necrosis. Glomerulus and mesenchyma were normal as well.
Overall, the DOX-treated group showed some damages on heart, which was exactly its major drawback of DOX. On the contrary, the Gal-DOX treated group showed similar histological structure as those of control group, with no obvious abnormalities or lesions, indicating the reduced toxicity by the Gal targeting.
Therapeutic evaluation of Gal-DOX in S180 tumor-bearing mice
Therapeutic effect of the DOX, Gal-DOX and saline treated group mice were investigated. Tumor size, survival rates and body weight of mice treated by saline, DOX, Gal-DOX were plotted in Fig. 11. Due to the lack of inhibition and the infinitely growth of tumor, tumor size of the mice in control group (0.92 cm) was the largest and the increment of body weight (30.75 g) also far exceeded that of other groups.
With the same amount of DOX, the tumor size in Gal-DOX-treated group was greatly reduced compared to the DOX-treated group. No mouse died in the Gal-DOX-treated group after 14 days while the survival rate of DOX treated group was only 50%. These results further supported the targeted ability of Gal-DOX, increasing the accumulation of DOX in tumor sites and decreasing the systematic toxicity.
In addition, H&E tumor tissue sections at 14 day post-injection were histologically examined, as shown in Fig. 11 E. Larger necrosis region with pathological calcification was observed in Gal-DOX group than that of DOX group, while all the tumor cells were still normal in the saline treated group, which further proved the better therapeutic effect of Gal-DOX.
Figure 11
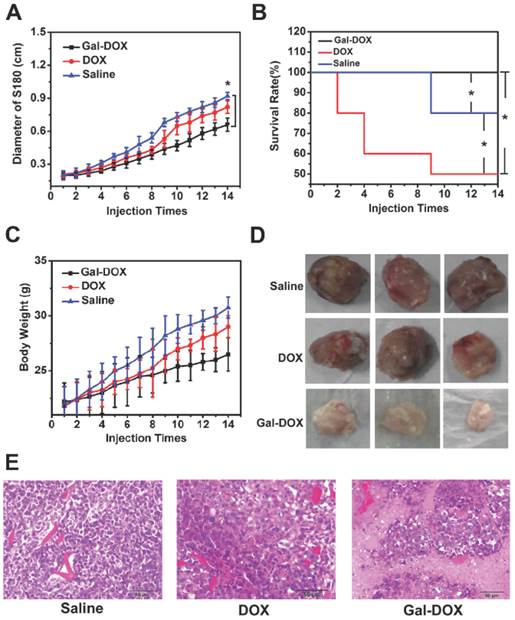
Comparison of the therapeutic efficacy.(A) Diameter of tumor in different groups within 14 days.(B) Survival rate of mice in different groups within 14 days.(C) Changes of body weight of mice in different groups.(D) Tumor tissues gotten from the mice with different samples.(E) H&E stained tumor tissues gotten from the mice with different samples.
Discussion
Owing to the specific binding feature of galactose to ASGPR which was highly expressed on the surface of a variety of tumor cells, Gal-MPA was designed and successfully synthesized as a broad tumor-imaging agent on a broad of tumor cells in this study.
The high affinities to ASGPR overexpressed tumor cells (Fig. 4, Fig. 5) and the competitive blocking experiments confirmed that Gal-MPA was mediated into the tumor cells by ASGPR. The correlation between cell uptake and ASGPR expression suggested that ASGPR1 might mediate the internalization of Gal-MPA into multiple tumor cells by endocytosis.
Due to the hydrophilic property, Gal-MPA was able to reach the tumor site quickly within 2 hours post-injection (HepG2, MCF-7, A549, HCT116, U87, MDA-MB-231 and S180) (Fig. 7). Besides, the high tumor-targeting ability with P/N at the maximal of 6.8 and long tumor retention time (~120 hours) indicated that Gal-MPA is qualified for multiple tumor diagnosis and Gal is an ideal ligand for tumor targeted therapy.
To validate the better therapeutic effect of galactosylated compound, Gal-DOX was synthesized as a prodrug for tumor targeted therapy. The higher tumor inhibition capability of Gal-DOX than that of DOX was demonstrated in the S180 tumor bearing mice. The enhanced antitumor activity of Gal-DOX is attributed to the high accumulation of Gal-DOX on tumor sites than that of DOX. Results indicated that Gal-DOX was a promising antitumor drug for broad tumor- targeted therapy.
Normal liver cells are devided into hepatic parenchymal cells, Interstitial cells, et al. Hepatic parenchymal cells are the main cells which functionate. L02 cell line is one kind of human hepatic parenchymal cell. But L02 cells can't represent the normal liver cells. Long-term treatment by Gal-DOX might also result in biotoxicity on the normal tissues. This side effect of the proposed treatment would be attributed to the uptake of the Gal-DOX by other types of cells such as macrophage, lymphocyte and so on and then the accumulation in the normal tissue. In the future work, we will investigate the double targeting therapy by conjugating another tumor-targeting ligand (RGD, folate and so on) to improve the tumor-selectivity.
Abbreviations
ASGPR: asialoglycoprotein receptor; Gal: galactose; DOX: doxorubicin; NIR: Near-infrared; EDC: 1-ethyl-3-[3-diMethylaminopropyl] carbodiimide hydrochloride; NHS: N-hydroxysuccinimide; RhB: rhodamine B; FBS: fetal bovine serum; PBS: phosphate buffer saline; FT-IR: Fourier transform-Infrared spectra; 1H NMR: 1H nuclear magnetic resonance; ATCC: American Type Culture Collection; LSCM: laser scanning confocal microscope; MTT: 3-(4,5-dimethyl-2-thiazolyl)-2,5-diphenyl-2-H-tetrazolium bromide; ELISA: enzyme linkedimmunosorbent assay; SPF: specific pathogen free
Acknowledgements
The authors are grateful to the Natural Science Foundation Committee of China (NSFC 81220108012) and the Priority Academic Program Development of Jiangsu Higher Education Institutions for their financial support.
The authors would like to thank Dr. Guang Yu for his scientific contribution in the preparation of this manuscript.
Competing Interests
The authors have declared that no competing interest exists.
References
1. Renz M, Daniels BR, Vamosi G, Arias IM, Lippincott-Schwartz J. Plasticity of the asialoglycoprotein receptor deciphered by ensemble FRET imaging and single-molecule counting PALM imaging. Proc Natl Acad Sci U S A. 2012;109:E2989-2997
2. Leung JCK, Tsang AWL, Chan DTM, Lai KN. Absence of CD89, Polymeric Immunoglobulin Receptor, and Asialoglycoprotein Receptor on Human Mesangial Cells. Journal of the American Society of Nephrology. 2000;11:241-249
3. Onizuka T, Shimizu H, Moriwaki Y, Nakano T, Kanai S. NMR study of ligand release from asialoglycoprotein receptor under solution conditions in early endosomes. FEBS J. 2012;279:2645-2656
4. Weigel PH, Yik JHN. Glycans as endocytosis signals: the cases of the asialoglycoprotein and hyaluronan/chondroitin sulfate receptors. Biochimica et Biophysica Acta. 2002;1572:341-363
5. Mamidyala SK, Dutta S, Chrunyk BA, Preville C, Wang H. Glycomimetic ligands for the human asialoglycoprotein receptor. J Am Chem Soc. 2012;134:1978-1981
6. Yang Y, Zhao YT, Yan TT, Yu M, Sha YL. Design and fabrication of multivalent Gal-containing quantum dots and study of its interactions with asialoglycoprotein receptor (ASGP-R). Tetrahedron Letters. 2010;51:4182-4185
7. Peça IN, Petrova KT, Cardoso MM, Barros MT. Preparation and characterization of polymeric nanoparticles composed of poly(dl-lactide-co-glycolide) and poly(dl-lactide-co-glycolide)-co-poly(ethylene glycol)-10%-Triblock end-capped with a galactose moiety. Reactive and Functional Polymers. 2012;72:729-735
8. Zhou N, Zan X, Wang Z, Wu H, Yin D. Galactosylated chitosan-polycaprolactone nanoparticles for hepatocyte-targeted delivery of curcumin. Carbohydr Polym. 2013;94:420-429
9. Mu JZ, Robert JF, David H. Expression of an endogenous asialoglycoprotein receptor in a human intestinal epithelial cell line, Caco-2. Biochim Biophys Acta. 1994;1222:483-491
10. Mu JZ, Marilyn G, Shao JS. Apical Expression of Functional Asialoglycoprotein Receptor in the Human Intestinal Cell Line HT-29. Gastroenterology. 1997;113(5):1501-1509
11. Kobayashi H, Ogawa M, Alford R, Choyke PL, Urano Y. New strategies for fluorescent probe design in medical diagnostic imaging. Chem Rev. 2010;110:2620-2640
12. Shan LL, Xue JP, Guo J, Qian ZY, Achilefu S. Improved targeted of ligand-modified adenovirus as a new near infrared fluorescence tumor imaging probe. Bioconjug Chem. 2011;22:567-581
13. Cui SS, Chen YQ, Di YF, Chen HY, Ma YX, Gu YQ. In Vivo Targeted Deep-Tissue Photodynamic Therapy Based on Near-Infrared Light Triggered Upconversion Nanoconstruct. ACS nano. 2013;7:676-688
14. Cao J, Cui SS, Li SW, Du CL, Tian JM. Targeted cancer therapy with a 2-deoxyglucose-based adriamycin complex. Cancer Res. 2013;73:1362-1373
15. Chen HY, Li BW, Ren XY, Li SN, Gu YQ. Multifunctional near-infrared-emitting nano-conjugates based on gold clusters for tumor imaging and therapy. Biomaterials. 2012;33:8461-8476
16. Guo J, Du C, Shan L, Zhu H, Xue B, Gu YQ. Comparison of near-infrared fluorescent deoxyglucose probes with different dyes for tumor diagnosis in vivo. Contrast Media Mol Imaging. 2012;7:289-301
17. Zhu HY, Liu F, Guo J, Xue JP, Gu YQ. Folate-modified chitosan micelles with enhanced tumor targeting evaluated by near infrared imaging system. Carbohydrate Polymers. 2011;86:1118-1129
18. Ma YX, Chen YQ, Cui SS, Zhao J, Gu YQ. Preparation and characterization of a drug carrier for hepatocellular carcinoma targeting. Proc Of SPIE. 2013:8582 DOI:10.1117/12.2003267
Author contact
![]() Corresponding author: Yueqing Gu, PhD, Department of Biomedical Engineering, China, Pharmaceutical University, Nanjing 210009, Jiangsu Province, China; Phone: 86-25-83271046; Fax: 86-25-83271046; E-mail: guyueqingsubmissioncom; institutional E-mail: cpuyueqingcom
Corresponding author: Yueqing Gu, PhD, Department of Biomedical Engineering, China, Pharmaceutical University, Nanjing 210009, Jiangsu Province, China; Phone: 86-25-83271046; Fax: 86-25-83271046; E-mail: guyueqingsubmissioncom; institutional E-mail: cpuyueqingcom
Citation styles
APA
Ma, Y., Chen, H., Su, S., Wang, T., Zhang, C., Fida, G., Cui, S., Zhao, J., Gu, Y. (2015). Galactose as Broad Ligand for Multiple Tumor Imaging and Therapy. Journal of Cancer, 6(7), 658-670. https://doi.org/10.7150/jca.11647.
ACS
Ma, Y.; Chen, H.; Su, S.; Wang, T.; Zhang, C.; Fida, G.; Cui, S.; Zhao, J.; Gu, Y. Galactose as Broad Ligand for Multiple Tumor Imaging and Therapy. J. Cancer 2015, 6 (7), 658-670. DOI: 10.7150/jca.11647.
NLM
Ma Y, Chen H, Su S, Wang T, Zhang C, Fida G, Cui S, Zhao J, Gu Y. Galactose as Broad Ligand for Multiple Tumor Imaging and Therapy. J Cancer 2015; 6(7):658-670. doi:10.7150/jca.11647. https://www.jcancer.org/v06p0658.htm
CSE
Ma Y, Chen H, Su S, Wang T, Zhang C, Fida G, Cui S, Zhao J, Gu Y. 2015. Galactose as Broad Ligand for Multiple Tumor Imaging and Therapy. J Cancer. 6(7):658-670.
This is an open access article distributed under the terms of the Creative Commons Attribution (CC BY-NC) License. See http://ivyspring.com/terms for full terms and conditions.