Journal of Cancer
ISSN: 1837-9664
3.2
Impact Factor
ISSN: 1837-9664

 Global reach, higher impact
J Cancer 2015; 6(7):678-685. doi:10.7150/jca.11689 This issue Cite
Research Paper
Annexin A3 Is a Potential Predictor of Platinum Resistance in Epithelial Ovarian Cancer Patients in a Prospective Cohort
Ying Jin1*, Li-ping Feng1,2*, Xiang Jiang1,3*, Yong-xue Wang1, Jie Yin1, Zi-ping Yang1, Yan Li1, Ling-ya Pan1 ![]()
1. Department of Obstetrics and Gynecology, Peking Union Medical College Hospital, Chinese Academy of Medical Sciences and Peking Union Medical College, Beijing, China (No.1 Shuai fu yuan, Dongcheng District, Beijing 100730, China)
2. The current address for Li-ping Feng: Department of Obstetrics and Gynecology, Qilu Hospital of Shandong University, Jinan, Shandong, China (No. 107 Cultural West Road, Jinan 250012, China)
3. The current address for Xiang Jiang: Department of Obstetrics and Gynecology, Shanghai First Maternity and Infant Health Hospital, Shanghai, China (No 536 Changle Road, Jingan District, Shanghai 200040,China)
*Contributed equally to this work.
Received 2015-1-25; Accepted 2015-5-4; Published 2015-6-10
Citation:
Jin Y, Feng Lp, Jiang X, Wang Yx, Yin J, Yang Zp, Li Y, Pan Ly. Annexin A3 Is a Potential Predictor of Platinum Resistance in Epithelial Ovarian Cancer Patients in a Prospective Cohort. J Cancer 2015; 6(7):678-685. doi:10.7150/jca.11689. https://www.jcancer.org/v06p0678.htm
Other stylesAbstract
Epithelial ovarian cancer (EOC) is the leading cause of death among gynecological malignancies and is rarely cured in the recurrent setting, mainly because of progressive chemoresistance, especially platinum resistance. In our previous studies, the platinum-resistance-related protein, annexin A3, was selected by comparative proteomics. In this study, we detected serum annexin A3 levels using a self-developed chemiluminescence immunoassay kit in a prospective EOC patient cohort. We also evaluated the capacity of serum annexin A3 levels to predict platinum resistance. Serum annexin A3 levels in healthy women exhibited a similar normal distribution (Z=0.723, P=0.673), allowing determination of a normal cutoff level of 0.11-1.45 ng/mL. Of the 89 EOC patients, 21 were platinum resistant and 68 were platinum sensitive. Residual disease after primary surgery (p=0.004) and serum annexin A3 levels (p=0.036) were both independent factors associated with platinum resistance. The AUC was 0.733 (95% confidence interval (CI), 0.627-0.823). The optimal cutoff value for serum annexin A3 levels was 2.05 ng/mL. Multivariate logistic analysis showed that expression of annexin A3 as assessed by immunohistochemistry (P=0.005) and residual tumor size (P=0.000) had a significant influence on platinum resistance. The AUC of ROC curve of annexin A3 expression by immunohistochemistry was 0.664 (95% CI, 0.554-0.763) and the cut off value was “>=moderate scores”. In conclusion, we demonstrate that annexin A3 is a secreted protein that may be measured in the peripheral blood using a self-developed, chemiluminescence immunoassay kit. Serum annexin A3 levels may be a potential predictor of platinum resistance in epithelial ovarian cancer patients.
Keywords: ovarian cancer, annexin A3, platinum resistance, chemiluminescence immunoassay
Introduction
Epithelial ovarian cancer (EOC) is the leading cause of death among gynecological malignancies[1], and the majority of women present with advanced-stage disease (stages III and IV, International Federation of Gynecology and Obstetrics (FIGO)). The current treatment for patients with advanced disease includes primary surgical cytoreduction plus adjuvant platinum-taxane combination chemotherapy. Even though over 70% of patients achieve a complete response with primary therapy, approximately 75% of patients will relapse[2]. Ovarian cancer is rarely cured in the recurrent setting, mainly because of progressive chemoresistance, particularly platinum resistance. For this reason, the 5-year overall survival (OS) for EOC remains low (~20%)[3]. While multiple US Food and Drug Administration-approved chemotherapy agents are available for the treatment of recurrent ovarian cancer, all yield similar clinical response rates, and there is no preferred standard second-line chemotherapy to offer these patients. Recent efforts to improve survival after primary therapy have focused on novel combinations of standard chemotherapies and the use of targeted agents[2,4]. An alternative approach has been to focus on determining the sensitivity of an individual patient's tumor to standard medicines, with a variety of drug sensitivity and resistance tests[5,6]. Unfortunately, when examined in randomized trials, these chemotherapy sensitivity and resistance tests did not improve progression-free survival (PFS) or OS compared with the standard of care[7]. Because the majority of EOC tumors (70%) are platinum sensitive during primary therapy, reliable identification of platinum-resistant patients would be clinically useful. Such patients could then be guided to alternative chemotherapy agents and treatment options, potentially avoiding unnecessary toxicity.
In our previous studies, the platinum-resistance-related protein, annexin A3, was selected by comparative proteomics[8]. Expression of annexin A3, a member of the Ca2+ and phospholipid-binding annexin family, is significantly increased in platinum-resistant ovarian cell lines. Immunohistochemical analysis of annexin A3 expression revealed that cancers from platinum-resistant patients also exhibit higher levels of annexin A3 compared with platinum-sensitive patients. Further studies demonstrated that the concentrations of intracellular platinum and platinum-DNA binding were significantly lower in annexin A3-overexpressing cells compared with parental cells [9]. Annexin A3 can be detected in the culture medium of ovarian cancer cells, particularly cells expressing high levels of annexin A3, indicating that annexin A3 levels may be tested in peripheral blood and serve as a potential serological platinum resistance biomarker. Analysis of annexin A3 levels in sera from a retrospective EOC patient cohort using enzyme-linked immunosorbent assay (ELISA), revealed that serum annexin A3 levels were significantly higher in platinum-resistant patients than in platinum-sensitive patients; however, the ELISA method was not adequately sensitive or stable[10].
On the basis of these previous studies, we analyzed serum annexin A3 levels using a self-developed chemiluminescence immunoassay kit in a prospective EOC patient cohort. The capacity of serum annexin A3 protein levels to predict platinum resistance was evaluated. Tissue annexin A3 expression was also detected by immunohistochemistry (IHC) and the predictive value was further assessed.
Material and Methods
Patients and control population
EOC patients treated at the Peking Union Medical College (PUMC) hospital between September 2009 and April 2012, were enrolled prospectively. Diagnosis was confirmed by a pathologist from the PUMC hospital. All patients were treated by primary surgical cytoreduction and six to eight cycles of chemotherapy (intravenous paclitaxel 175 mg/m2, followed by intravenous cisplatin 75 mg/m2 or carboplatin AUC 5). Patients receiving other chemotherapy agents were excluded. The primary end point was PFS, which was calculated from the date of diagnosis to the date of disease recurrence (confirmed on physical, serologic, or radiologic examination), death, or most recent follow-up visit. According to the National Comprehensive Cancer Network guideline[11], patients who progressed after two consecutive chemotherapy regimens without ever sustaining a clinical benefit were defined as platinum refractory, and those whose disease recurred in less than 6 months were defined as platinum resistant. Patients who experienced complete remission during the chemotherapy period without recurrence or who relapsed after more than 6 months, were defined as platinum sensitive. In this study, platinum resistance consisted of platinum refractory and resistant patients.
The control population included 113 healthy women and 70 patients with benign ovarian epithelial tumors, recruited from the PUMC hospital in China and enrolled during the same period. All patients and the control population gave written informed consent to participate in the study. The study was approved by the review board of PUMC hospital and was performed according to The Code of Ethics of the World Medical Association (Declaration of Helsinki).
Serum samples
Blood samples from patients and the control population were collected. Sera from these blood samples were aliquoted in 1.5- or 0.5-mL amber vials and stored at -25°C up to 1 week, before long-term storage at -80°C.
Development of the annexin A3 chemiluminescence immunoassay kit and the serum annexin A3 assay
Double-antibody sandwich, chemical luminescence enzyme immunoassay was used to evaluate the affinity of six commercially available, anti-annexin A3 polyclonal or monoclonal antibodies (Supplementary Table S1, ABNOVA and ABCAM) to human annexin A3 recombinant protein (AAH00871, 1-324 amino acids, full-length recombinant protein with a GST-tag at the N-terminus. Molecular weight of the GST tag alone is 26 kDa, ABNOVA). The two most efficient antibodies were selected as the capture antibody and detection antibody to prepare the chemiluminescence immunoassay kit. The detection antibody was conjugated to horseradish peroxidase (HRP) using a modified sodium iodide method, in accordance with the manufacturer's coupling protocols. Recombinant annexin A3 was diluted with 1% (w/v) bovine serum albumin to generate a series of annexin A3 standards (range, 0-50 μg/mL). Annexin A3 in the serum sample was specifically bound by the capture antibody, which was a solid-phase immobilization in microtiter wells. Immunoassays were performed by adding sample/standards (50 μL) and HRP-conjugated detection antibody solution (50 μL) to microtiter wells and incubating for 2 h at 37°C. Wells were then washed five times with PBS-Tween (x%) to remove unbound antibodies and chemiluminescent substrate (100 μL of luminol, hydrochloric acid, and hydrogen peroxide; Sigma, St. Louis, MO, USA) was then added to each well. The mixture was incubated for 10 min at room temperature in the dark, and the relative light units (RLUs) were read at 450 nm. Analysis of chemiluminescence immunoassay performance, which included standard curve, minimum limit (the detection value of 20 parallel zero value standards), linearity ranges, and intra- and inter-assay variability, was performed according to the guidelines established by the Clinical Laboratory Standard Institute [12,13]. The developed chemiluminescence immunoassay was applied to quantify serum annexin A3 levels in all enrolled subjects.
Immunohistochemical analysis
Immunostaining of tissue sections was performed using the Dako LASB system (DakoCytomation) in accordance with the manufacturer's instructions. Sections of normal kidney tissue were used as positive controls for annexin A3 staining. Negative control sections were incubated with rabbit IgG. Tissue sections were evaluated by light microscopy (400×) and scored as previously described (negative, weak, moderate, and strong staining) [14]. The immunostaining intensity was evaluated by two independent observers, who were blinded to clinical and annexin A3 data.
Statistical analysis
Statistical analysis was performed using SPSS software (version 11.5, SPSS Inc, Chicago, IL, USA). The predicted probability of platinum resistance was used as a surrogate marker to construct a receiver operating characteristic (ROC) curve. Area under the ROC curve (AUC) was used as an accuracy index for evaluating the diagnostic performance. The sensitivity, specificity, positive predictive value (PPV), and negative predictive value (NPV) were then determined.
The Cox proportional hazards model was used to identify independent prognostic factors and to estimate their effects on PFS adjusted for covariates. Kaplan-Meier survival curves based on serum annexin A3 levels were calculated and compared using the log-rank test. All statistical tests were two-tailed with a significance level set at 5%.
Results
Development and performance of an annexin A3 chemiluminescence immunoassay
For the development of the annexin A3 chemiluminescence immunoassay, we screened several commercially available annexin A3 antibodies for detection of annexin A3 standards. Antibody A (capture antibody) and antibody B (detection antibody) exhibited the highest antigen-antibody binding specificity, based on the largest correlation coefficient of the standard curve and the highest signal to noise ratio (SNR, the light intensity ratio of maximum value and zero value standard proteins), of 0.9982 and 19.56, respectively (Supplementary Table S2). Based on these results, this antibody pair was selected for development of the chemiluminescence immunoassay kit.
The calibration curve (0.1-1.6 ng/mL) of the chemiluminescence immunoassay exhibited the following coefficient of linear correlation: γ2 = 0.9996[log(Y) = 5.2262+1.0388log(X)]. The minimum detection limit was 0.08 ng/mL (RLU of 20 parallel zero value standards was 11520.45, mean = 6948.60, SD = 2285.93). Serial dilution of serum samples, adding annexin A3 with levels of 1.25 ng/mL produced linearity (γ2 =0.9988; Supplementary Figure S1). The detection limit was 0.1-1.6 ng/mL (Supplementary Table S3).
The intra- and inter-assay variability was examined using two pooled serum samples with average annexin A3 levels of 1.6 and 0.8 ng/mL, respectively. The mean intra- and inter-assay coefficients of variation were 5.92-8.63% and 5.15-6.42%, respectively (Supplementary Table S4).
Distribution of serum annexin A3 levels
The distribution of serum annexin A3 levels in healthy women, and in patients with benign and malignant ovarian epithelial tumors is shown in Table 1. In 113 healthy women, annexin A3 levels exhibited a similar normal distribution (Z = 0.723, P = 0.673 > 0.05), with a normal cutoff of 0.11-1.45 ng/mL (mean ± 1.96 SD).
Patient characteristics and prognosis
EOC patients (n=89) were referred to the PUMC Hospital between September 2009 and April 2012. The demographic and clinical characteristics of the study population are shown in Table 2. The median age of patients was 55 years (range, 19-83 years), with a pretreatment Gynecologic oncology group (GOG) performance status of 0-1 (83.2%). Clinically, 71.9% of EOCs were serous cell type and 47.2% were classified as tumor grade 3. Twenty-eight patients (31.5%) were given neoadjuvant chemotherapy. The majority of patients (77.5%) received optimal cytoreduction surgery with the residual tumor ≤ 1 cm.
Twenty-seven recurrences and two deaths were identified within a median follow-up period of 14 months (range, 7-39 months). The median PFS was 10 months (95% confidence interval (CI), 11.3-13.2 months). Four patients exhibited disease progression during the chemotherapy period and were defined as refractory. Seventeen patients experienced recurrent disease in under 6 months and were defined as platinum resistant. Ten patients experienced relapse after more than 6 months. Fifty-eight patients remained progression free. In total, there were 21 platinum-resistant cases and 68 platinum-sensitive cases.
Influence of debulking surgery on serum annexin A3 levels
Among the 89 enrolled patients, 28 patients (FIGO stage III-IV) received a combination of neoadjuvant chemotherapy, debulking surgery, and adjuvant chemotherapy, while the remaining 61 patients received a combination of debulking surgery plus adjuvant chemotherapy. Among these 61 cases, we evaluated the effect of debulking surgery on annexin A3 levels in 45 patients. Annexin A3 levels assessed pre-operatively (pretreatment) and post-operatively were 1.43±1.19 ng/mL(range 0.43-4.55ng/mL) and 1.86±1.06 ng/mL (range 0.4-4.32ng/mL) respectively (p=0.226). Serum annexin A3 levels (post-operatively) in patients who received optimal and suboptimal debulking were 1.53±1.28 ng/mL and 1.95±0.91 ng/mL, respectively (p=0.394).
Ability of serum annexin A3 levels to predict platinum resistance
Univariate analysis, which included age, GOG performance status, histology, tumor grade, disease staging, residual disease size, and serum annexin A3 levels, revealed that residual disease and serum annexin A3 levels were associated with platinum resistance (Table 3, P < 0.05). Other variables, including age, tumor grade, histology, or staging did not appear to have a significant association with platinum resistance. Multivariate analysis revealed that residual disease (p=0.036) and serum annexin A3 levels (p=0.004) were both independent factors associated with platinum resistance (Table 4).
Table 1
Serum annexin A3 level distribution
| Healthy women (n=113) | Ovarian benign tumor (n=70) | Epithelial ovrian cancer (n=89) | |
|---|---|---|---|
| Age, year | |||
| median | 47 | 37.5 | 55 |
| range | 17-78 | 16-79 | 19-83 |
| Annexin A3 level, ng/mL | |||
| range | 0.15-1.54 | 0.04-1.79 | 0.20-6.18 |
| mean | 0.78 | 0.76 | 1.51 |
| SD | 0.34 | 0.50 | 1.19 |
Table 2
Patient demographic and clinical characteristics (n=89)
| Characteristic | No. | % |
|---|---|---|
| Age, year | ||
| Median | 55 | |
| range | 19-83 | |
| GOG performance status | ||
| 0-1 | 74 | 83.2% |
| 2-3 | 15 | 16.8% |
| Stage | ||
| Ⅰ | 6 | 6.7% |
| Ⅱ | 12 | 13.5% |
| Ⅲ | 65 | 73.0% |
| Ⅳ | 6 | 6.7% |
| Histology | ||
| Serious | 64 | 71.9% |
| Mucinous | 6 | 6.7% |
| Clear cell | 4 | 4.5% |
| Endometrioid | 6 | 6.7% |
| Others | 9 | 10.1% |
| Tumor grade | ||
| 1 | 12 | 13.5% |
| 2 | 27 | 30.3% |
| 3 | 42 | 47.2% |
| Not available | 8 | 9.0% |
| Neoadjuvant chemotherapy | ||
| yes | 28 | 31.5% |
| no | 61 | 68.5% |
| Residual tumor, cm | ||
| ≤1cm | 69 | 77.5% |
| >1cm | 20 | 22.5% |
Table 3
Univariate analysis of platinum resistance related factors (log-rank test)
| Variables | No | % | Exp(B) (95% CI) | P |
|---|---|---|---|---|
| age | 0.997(0.958~1.038) | 0.893 | ||
| median | 55 | |||
| staging | 0.878 | |||
| Ⅰ+Ⅱ | 18 | 20.2% | 1 | |
| Ⅲ+Ⅳ | 71 | 79.8% | 1.102 (0.320~3.799) | |
| GOG performance status | 0.785 | |||
| 0-1 | 74 | 83.2% | 1 | |
| 2-3 | 15 | 16.8% | 1.235 (0.768-2.576) | |
| histology | 0.096 | |||
| serious | 62 | 69.7% | 1 | |
| Mucinous+clear cell | 10 | 11.2% | 3.429 (0.867~13.562) | 0.079 |
| other | 17 | 19.1% | 0.457(0.093~2.244) | 0.335 |
| grade | 0.352 | |||
| 1 | 12 | 13.5% | 1 | |
| 2 | 27 | 30.3% | 0.857(0.175~4.206) | 0.849 |
| 3 | 42 | 47.2% | 0.706(0.155~3.217) | 0.653 |
| Not available | 8 | 9.0% | 3.000(0.447~20.153) | 0.258 |
| Residual tumor | 0.000 | |||
| ≤1cm | 69 | 77.5% | 1 | |
| >1cm | 20 | 22.5% | 7.211 (2.384~21.814) | |
| Serum annexin A3 level (ng/mL) | 0.004 | |||
| median | 1.20 | 1.849(1.214~2.814) | ||
ROC curves were constructed to verify the capacity of serum annexin A3 levels to predict platinum resistance (Figure 1). The AUC was 0.733 (95% CI, 0.677-0.775). The optimal cutoff value of annexin A3 levels was 2.05 ng/mL. The sensitivity and specificity were 61.11% and 80.88%, respectively; positive predictive value (PPV) and negative predictive value (NPV) were 45.8% and 88.7%, respectively.
All variables considered as potential prognostic factors (i.e., age, GOG performance status, tumor grade, histology, residual tumor size, and serum annexin A3 levels) were included in a Cox proportional hazards multivariate regression model for pre-assessment. Age, GOG performance status, and histology and tumor grade were excluded secondary to lack of independent association with clinical outcomes. The final model included annexin A3 levels and residual disease size. Higher annexin A3 levels (p=0.016) and residual disease size > 1cm (p=0.002) were both associated with poor PFS (Table 5). According to the optimal annexin A3 cutoff value (2.05 ng/mL), patients were divided into high- and low-level groups. The median PFS of high- and low-level groups was 11.5 and 14 months, respectively.
Table 4
Multivariate analysis of platinum-resistance-related factors (log-rank test)
| Serum annexin A3 test | Annexin A3 expression in tissue (IHC) | ||||||||
|---|---|---|---|---|---|---|---|---|---|
| Variables | n | % | OR (95% CI) | P | Variables | n | % | OR (95% CI) | P |
| Annexin A3 level | 0.036 | Annexin A3 expression | 0.005 | ||||||
| median (ng/mL) | 1.20 | 1.648 (1.034~2.626) | Low | 67 | 75.3 | 1 | |||
| high | 22 | 24.7 | 5.992 (1.735~20.694) | ||||||
| Residual tumor | 0.004 | Residual tumor | 0.000 | ||||||
| ≤1cm | 69 | 77.5 | 1 | ≤1cm | 69 | 77.5 | 1 | ||
| >1cm | 20 | 22.5 | 5.509 (1.719~17.647) | >1cm | 20 | 22.5 | 9.598 (2.761~33.357) | ||
Figure 1
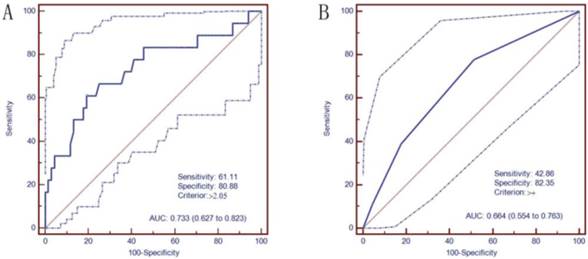
Receiver operating characteristic (ROC) curves of annexin A3 levels in predicting platinum resistance. A. Serum annexin A3 levels were examined using the chemiluminescence immunoassay kit (area under curve (AUC)=0.733, the cut-off value was 2.05 ng/mL); B. Immunohistochemical analysis of annexin A3 expression in tumor tissues (AUC=0.664, the cut-off value was '>=moderate scores').
Ability of tissue annexin A3 levels to predict platinum resistance
IHC analysis of annexin A3 protein expression in annexin A3-positive cancers revealed that expression was predominantly localized in the perinuclear area (Figure 2). Among the 89 EOC patients, 38 (42.7%) were scored as negative (-) for annexin A3 expression, 30 (33.7%) exhibited weak scores (+), 15 (16.9%) exhibited moderate scores (++), and 6 (6.7%) exhibited strong scores (+++). Negative and low scores were classified as “low expression”, while moderate and strong scores were classified as “high expression” (Table 6). Multivariate logistic analysis revealed that annexin A3 protein expression (P=0.005) and residual tumor size (P=0.000) had a significant influence on platinum resistance. The AUC of ROC curve (Figure 1) of annexin A3 protein expression was 0.664 (95% CI, 0.554-0.763) and the cut off value was “moderate scores”. The sensitivity, specificity, PPV, and NPV were 42.86%, 82.35%, 58.82%, and 87.18%, respectively. Multivariate Cox analysis revealed that annexin A3 protein expression (P=0.001) and residual tumor size (P=0.000) had a significant influence on PFS.
Table 5
Multivariate analysis of prognostic factors on progression-free survival (PFS)
| Serum annexin A3 test | Annexin A3 expression in tissue (IHC) | ||||||||
|---|---|---|---|---|---|---|---|---|---|
| Variables | n | % | OR (95% CI) | P | Variables | n | % | OR (95% CI) | P |
| Annexin A3 | 0.016 | Annexin A3 | 0.001 | ||||||
| median (ng/mL) | 1.20 | 1.364(1.060~1.756) | low | 67 | 75.3% | 1 | |||
| high | 22 | 24.7% | 3.355(1.638~6.872) | ||||||
| Residual tumor | 0.002 | Residual tumor | 0.000 | ||||||
| ≤1cm | 69 | 77.5% | 1 | ≤1cm | 69 | 77.5% | 1 | ||
| >1cm | 20 | 22.5% | 3.313 (1.5617.030) | >1cm | 20 | 22.5% | 4.151(2.009~8.576) | ||
Table 6
Immunohistochemical analysis of annexin A3 in platinum-sensitive and platinum-resistant patients
| Annexin A3 | Platinum sensitive (n=68) | Platinum resistant (n=21) | P | ||||
|---|---|---|---|---|---|---|---|
| n | % | n | % | n | % | ||
| Low expression | 68 | 75.3% | 56 | 82.4% | 12 | 57.1% | 0.017 |
| High expression | 21 | 24.7% | 12 | 17.6% | 9 | 42.9% | |
Figure 2
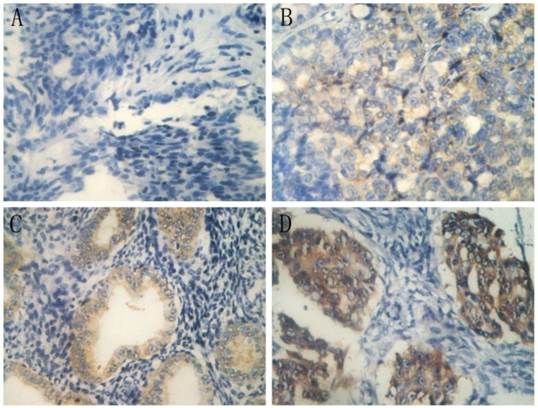
Immunohistochemical staining of annexin A3 in ovarian cancer tissues (400×). A, negative scores (-); B, weak scores (+); C, moderate scores (++); and D, strong scores (+++).
Discussion
Annexin A3 is a member of the annexin family, which are calcium-dependent phospholipid-binding proteins. The annexins participate in a diverse range of physiological activities including anti-coagulation, anti-inflammation, endocytosis and exocytosis, signal transduction, cell proliferation, differentiation, and apoptosis[15-17]. Annexin A3 is one of the least studied family members and to date, little is known about its function. Up-regulation of annexin A3 has been shown to promote the development of colorectal adenocarcinoma[18] and pancreatic carcinoma[19], and to facilitate lymph node metastases of lung adenocarcinoma[20] and hepatocarcinoma[21], while down-regulation of annexin A3 was negatively correlated with development of prostatic carcinoma[12] and renal carcinoma[22]. Until now, however, few studies have investigated the association of annexin A3 expression and chemoresistance in ovarian cancer patients. Thoenes et al. showed that annexin A3 was up-regulated in chemo-resistant prostatic cancer following metronomic cyclophosphamide therapy, both in vitro and in vivo[23], in keeping with our previous study in ovarian cancer[9,10].
In this study, we developed a chemiluminescence immunoassay kit to detect peripheral blood annexin A3 protein levels in 113 healthy women, 70 patients with benign ovarian tumors, and 89 patients with EOC. Annexin A3 protein could be detected in the peripheral blood of each group, further validating that annexin A3 is a secreted protein. In this study, we determined the cut-off for normal annexin A3 serum levels from 113 healthy women (upper limit 1.45 ng/mL). Annexin A3 levels were significantly higher in EOC patients compared with patients with benign ovarian tumors or healthy women, while levels in healthy women and patients with benign ovarian tumors were not significantly different.
In our previous study, an ELISA kit was used to detect annexin A3 levels in peripheral blood from ovarian cancer patients[10]. However, this was a retrospective study, in that the platinum-resistant or platinum-sensitive status of patients was known at the start of the study. In this study, to exclude potential selection and information bias, we used a prospective research method. Patients were included before treatment was commenced, and treatment and prognosis information was subsequently collected, increasing the reliability of the study.
The key objective of this study was to explore whether annexin A3 protein levels could predict platinum resistance in EOC patients. Theoretically, it is reasonable to choose postoperative serum annexin A3 levels as the baseline. While among the 89 enrolled patients, 28 patients received neoadjuvant chemotherapy before debulking surgery. It is therefore critical to determine whether tumor load (i.e. tumor debulking) affects annexin A3 levels. In the remaining 61 patients who received debulking surgery plus adjuvant chemotherapy, we assessed annexin A3 levels preoperatively (pretreatment) and postopertively (before chemotherapy) in 45 patients. We found that annexin A3 remained the same level pre- and post-operation. Serum annexin A3 level was not affected significantly by tumor debulking. We also assess serum annexin A3 levels in patients who received optimal and suboptimal debulking. In the suboptimal group, annexin A3 levels were higher, while there was no statistical difference between these two groups (p=0.394). It seemed that annexin A3 was not a biomarker related significantly to the tumor load. Finally, among the 89 patients, 28 (39.4% of FIGO III-IV patients in our study) had received neoadjuvant chemotherapy before surgery, therefore pretreatment serum annexin A3 levels were selected as the baseline to further exclude the effect of chemotherapy.
Of the 89 patients, 68 were platinum sensitive (76.4%) and 21 were platinum resistant (23.6%). Serum annexin A3 exhibited moderate diagnostic value (AUC=0.744), with high specificity (80.88%) and negative predictive value (88.7%), while the diagnostic sensitivity and PPV was low (61.11% and 45.8%, respectively). Our study demonstrated that optimal debulking and annexin A3 levels were both independent factors related to platinum resistance and PFS. We speculate that annexin A3 is not secreted by the majority or is secreted in small amounts of tumor cells, and it may be the unique nature of a small proportion of tumor cells, which are platinum resistant.
In this study, we also investigated whether tissue annexin A3 levels, as assessed by IHC, were capable of predicting platinum resistance. While tissue annexin A3 levels were also an independent predictor of platinum resistance, the serum test is more rapid, convenient, and accurate. First, serological samples are much easier to obtain from patients and may be collected before surgery and treatment; while tumor tissue cannot be obtained until surgery. Second, serum annexin A3 levels may be quantitatively detected in a one-step method, and our self-developed chemiluminescence immunoassay kit has high sensitivity, good reproducibility, and dilution linearity. In contrast, the immunohistochemical assay procedure was complicated, and immunostaining results were more subjective and semi-quantitative[14]. Third, the diagnostic accuracy of the two methods differed. The chemiluminescence immunoassay method exhibited higher AUC of the ROC curve (0.773 vs 0.664) and was more accurate. Therefore, the use of a serological chemiluminescence immunoassay method is superior to IHC analysis in tumor tissue.
A number of shortcomings are associated with our study. First, the sample size is small, particularly the number of patients in the platinum-resistant group (n=21). Future studies will aim to expand the patient cohort for increased statistical confidence. Second, neither the serum-based method (our self-developed chemiluminescence immunoassay kit) nor the IHC were sensitive enough. As indicated, annexin A3 is a member of the Ca2+ and phospholipid-binding annexin family and participates in a diverse range of physiological activities. Thus, annexin A3 is not only secreted by tumor cells, but also by human normal tissues. Annexin A3 was expressed at low levels in EOC tumors tissue. Indeed, in our study, 68 patients (76.4 %) exhibited low annexin A3 expression. Thus, annexin A3 was not a sufficiently sensitive marker (by serum-based methods or IHC) to predict platinum resistance. Future studies should aim to investigate additional platinum-resistance biomarkers identified in our previous study[8] that may be used in combination with annexin A3 to increase the sensitivity of the method.
In conclusion, annexin A3 is a secreted protein whose levels may be measured in peripheral blood using our self-developed chemiluminescence immunoassay kit. Serum annexin A3 levels may be a potential predictor of platinum resistance in EOC patients.
Supplementary Materials
Supplementary Table S1, S2, S3 and S4. Supplementary Figure S1.
Acknowledgements
We thank Prof. Ling Zeng (Beijing North Institute of Biotechnology) for technical assistance in the development of the chemiluminescence immunoassay kit. We thank Edanz for editorial support in the preparation of the manuscript.
Funding
The study is supported by the National Natural Science Fund of China (No. 81172481) and Beijing Natural Science Foundation (No. 7112114). We thank Prof. Ling Zeng (Beijing North Institute of Biotechnology) for technical assistance in the development of the chemiluminescence immunoassay kit.
Competing Interests
None.
References
1. ACS. Cancer Facts & Figures. American Cancer Society Atlanta. 2010
2. Bookman MA, Brady MF, McGuire WP, Harper PG, Alberts DS, Friedlander M. et al. Evaluation of new platinum-based treatment regimens in advanced-stage ovarian cancer: a Phase III Trial of the Gynecologic Cancer Intergroup. J Clin Oncol. 2009;27:1419-1425
3. McGuire WP, Hoskins WJ, Brady MF, Kucera PR, Partridge EE, Look KY. et al. Cyclophosphamide and cisplatin compared with paclitaxel and cisplatin inpatients with stage III and stage IV ovarian cancer. N Engl J Med. 1996;334:1-6
4. Berger ML, Eck S, Ruberg SJ. Raising the bar of efficacy for drug approval requires an understanding of patient diversity. J Clin Oncol. 2010;28:e343-344
5. Kern DH, Weisenthal LM. Highly specific prediction of antineoplastic drug resistance with an in vitro assay using suprapharmacologic drug exposures. J Natl Cancer Inst. 1990;82:582-588
6. Gallion H, Christopherson WA, Coleman RL, DeMars L, Herzog T, Hosford S. et al. Progression-free interval in ovarian cancer and predictive value of an ex vivo chemoresponse assay. Int J Gynecol Cancer. 2006;16:194-201
7. Cree IA, Kurbacher CM, Lamont A, Hindley AC, Love S; TCA Ovarian Cancer Trial Group. A prospective randomized controlled trial of tumour chemosensitivity assay directed chemotherapy versus physician's choice in patients with recurrent platinum- resistant ovarian cancer. Anticancer Drugs. 2007;18:1093-1101
8. Yan XD, Pan LY, Yuan Y, Lang JH, Mao N. Identification of platinum-resistance associated protein through proteomic analysis of human ovarian cancer cells and their platinum-sensitive sublines. J Proteome Res. 2007;6:772-780
9. Yin J, Yan X, Yao X, Zhang Y, Shan Y, Mao N, Yang Y, Pan L. Secretion of annexin A3 from ovarian cancer cells and its association with platinum resistance in ovarian cancer patients. J Cell Mol Med. 2012;16:337-348
10. Yan X, Yin J, Yao H, Mao N, Yang Y, Pan L. Increased expression of annexin A3 is a mechaniam of platinum resistance in ovarian cancer. Cancer Res. 2010;70:1616-1624
11. NCCN Clinical Practice Guidelines in Oncology (NCCN Guidelines): Ovarian cancer; Version 1-2014. National Comprehensive Cancer Network. http://www.nccn.org/professionals/physician_gls/pdf/ovarian.pdf
12. Powers DM. Interference Testing in Clinical Chemistry: Approved Guideline. National Committee for Clinical Laboratory Standards. 2002
13. Tholen DW. Evaluation of Precision Performance of Quantitative Measurement Methods: Approved Guideline. NCCLS. 2004
14. Köllermann J, Schlomm T, Bang H, Schwall GP, von Eichel-Streiber C, Simon R. et al. Expression and prognostic relevance of annexin A3 in prostate cancer. European urology. 2008;54:1314-1323
15. Perron B, Lewit-Bentley A, Geny B, Russo-Marie F. Can enzymatic activity, or otherwise, be inferred from structural studies of Annexin III? J Biol Chem. 1997;272:11321-11326
16. Moss SE, Morgan RO. The annexins. Genome Biol. 2004;5:219
17. Mussunoor S, Murray GI. The role of annexins in tumour development and progression. J Pathol. 2008;216:131-140
18. Yip KT, Das PK, Suria D, Lim CR, Ng GH, Liew CC. A case-controlled validation study of a blood based seven gene biomarker panel for colorectal cancer in Malaysia. J Exp Clin Cancer Res. 2010;29:128
19. Baine MJ, Chakraborty S, Smith LM, Mallya K, Sasson AR, Brand RE. et al. Transcriptional profiling of peripheral blood mononuclear cells in pancreatic cancer patients identifies novel genes with potential diagnostic utility. PLoS ONE. 2011;6:e17014
20. Liu YF, Xiao ZQ, Li MX, Li MY, Zhang PF, Li C. et al. Quantitative proteome analysis reveals annexin A3 as a novel biomarker in lung adenocarcinoma. J Pathol. 2009;217:54-64
21. Sun MZ, Liu S, Tang J, Wang Z, Gong X, Sun C. et al. Proteomics analysis of two mice hepatocarcinoma ascites syngeneic cell lines with high and low lymph node metastasis rates provide potential protein markers for tumor malignancy attributes to lymphatic metastasis. Proteomics. 2009;9:3285-3302
22. Bianchi C, Bombelli S, Raimondo F, Torsello B, Angeloni V, Ferrero S. et al. Primary cell cultures from human renal cortex and renal cell carcinoma evidence a differential expression of two spliced isoforms of annexin A3. Am J Pathol. 2010;176:1660-1670
23. Thoenes L, Hoehn M, Kashirin R, Ogris M, Arnold GJ, Wagner E. et al. In vivo chemoresistance of prostate cancer in metronomic cyclophosphamide therapy. J Proteomics. 2010;73:1342-1354
Author contact
![]() Corresponding author: Ling-ya Pan, MD, Department of Obstetrics and Gynecology, Peking Union Medical College Hospital, Chinese Academy of Medical Sciences and Peking Union Medical College, No.1 Shuai fu yuan, Dongcheng District, Beijing 100730, China. Phone: 86-10-69155731, Fax: 8610-65124875. E-mail: panlycn
Corresponding author: Ling-ya Pan, MD, Department of Obstetrics and Gynecology, Peking Union Medical College Hospital, Chinese Academy of Medical Sciences and Peking Union Medical College, No.1 Shuai fu yuan, Dongcheng District, Beijing 100730, China. Phone: 86-10-69155731, Fax: 8610-65124875. E-mail: panlycn
Citation styles
APA
Jin, Y., Feng, L.p., Jiang, X., Wang, Y.x., Yin, J., Yang, Z.p., Li, Y., Pan, L.y. (2015). Annexin A3 Is a Potential Predictor of Platinum Resistance in Epithelial Ovarian Cancer Patients in a Prospective Cohort. Journal of Cancer, 6(7), 678-685. https://doi.org/10.7150/jca.11689.
ACS
Jin, Y.; Feng, L.p.; Jiang, X.; Wang, Y.x.; Yin, J.; Yang, Z.p.; Li, Y.; Pan, L.y. Annexin A3 Is a Potential Predictor of Platinum Resistance in Epithelial Ovarian Cancer Patients in a Prospective Cohort. J. Cancer 2015, 6 (7), 678-685. DOI: 10.7150/jca.11689.
NLM
Jin Y, Feng Lp, Jiang X, Wang Yx, Yin J, Yang Zp, Li Y, Pan Ly. Annexin A3 Is a Potential Predictor of Platinum Resistance in Epithelial Ovarian Cancer Patients in a Prospective Cohort. J Cancer 2015; 6(7):678-685. doi:10.7150/jca.11689. https://www.jcancer.org/v06p0678.htm
CSE
Jin Y, Feng Lp, Jiang X, Wang Yx, Yin J, Yang Zp, Li Y, Pan Ly. 2015. Annexin A3 Is a Potential Predictor of Platinum Resistance in Epithelial Ovarian Cancer Patients in a Prospective Cohort. J Cancer. 6(7):678-685.
This is an open access article distributed under the terms of the Creative Commons Attribution (CC BY-NC) License. See http://ivyspring.com/terms for full terms and conditions.