Journal of Cancer
ISSN: 1837-9664
3.2
Impact Factor
ISSN: 1837-9664

 Global reach, higher impact
J Cancer 2016; 7(6):722-729. doi:10.7150/jca.14277 This issue Cite
Research Paper
Identification of Cathepsin K in the Peritoneal Metastasis of Ovarian Carcinoma Using In-silico, Gene Expression Analysis
Haiming Xu1*, Yu Ma 2*, Yan Zhang2, 3, Zimin Pan4, Yan Lu4,5, Pengyuan Liu5, Bingjian Lu6 ![]()
1. Institute of Bioinformatics, School of Agriculture & Biological Technology, Zhejiang University, Hangzhou, Zhejiang, China.
2. Department of Clinical Laboratory, 4Gynecologic Oncology, 6Surgical Pathology, Women's Hospital, School of Medicine, Zhejiang University, Hangzhou, Zhejiang, China.
3. Department of Clinical Laboratory, Yiwu Hospital, School of Medicine, Zhejiang University, Yiwu, Zhejiang, China.
4. Department of Gynecologic Oncology, Women's Hospital, School of Medicine, Zhejiang University, Hangzhou, Zhejiang, China.
5. Institute of Translational Medicine, School of Medicine, Zhejiang University, Hangzhou, Zhejiang, China.
6. Department of Surgical Pathology, Women's Hospital, School of Medicine, Zhejiang University, Hangzhou, Zhejiang, China.
* Both authors contributed equally to this work.
Received 2015-10-31; Accepted 2016-1-22; Published 2016-3-26
Citation:
Xu H, Ma Y, Zhang Y, Pan Z, Lu Y, Liu P, Lu B. Identification of Cathepsin K in the Peritoneal Metastasis of Ovarian Carcinoma Using In-silico, Gene Expression Analysis. J Cancer 2016; 7(6):722-729. doi:10.7150/jca.14277. https://www.jcancer.org/v07p0722.htm
Other stylesAbstract
Ovarian carcinomas (OC) are often found in the advanced stage with wide peritoneal dissemination. Differentially-expressed genes (DEGs) between primary ovarian carcinoma (POC) and peritoneal metastatic ovarian carcinomas (PMOC) may have diagnostic and therapeutic values. In this study, we identified 246 DEGs by in-silico analysis using microarrays for 153 POCs and 57 PMOCs. Pathway analysis shows that many of these genes are associated with lipid metabolism. Microfluidic, card-based, quantitative PCR validated 19 DEGs in PMOCs versus POCs (p<0.05). Immunohistochemistry confirmed overexpression of MMP13, CTSK, FGF1 and GREM1 in PMOCs (p<0.05). ELISA detection indicated that serum CTSK levels were significantly increased in OCs versus controls (p<0.001). CTSK levels discriminated between OCs and healthy controls (ROC 0.739; range 0.685-0.793). Combining CA125 and HE4 with CTSK levels produced an improved specificity in the predictive of OCs (sensitivity 88.3%, specificity 92.0%, Youden's index 80.3%). Our study suggests that CTSK levels may be helpful in the diagnosis of primary, ovarian carcinoma.
Keywords: ovarian carcinoma, metastasis, microarray, CTSK (cathepsin K).
Background
Ovarian carcinoma (OC) is the most lethal malignancy in the female genital tract with 225,500 new cases, and, 140,200 deaths worldwide each year (1). Most OCs are found at an advanced stage with wide peritoneal dissemination, which results in low cure rates despite improved surgical efficiency and optimized chemotherapy regimens recently. Understanding the spread of OC at a molecular level is critical for cancer detection and intervention.
Gene expression microarray analysis provides insights into the molecular characterization of cancers by investigating the relationship between differentially-expressed genes (DEGs) and clinicopathological phenotypes. These DEGs are useful diagnostic biomarkers or therapeutic targets. In OCs, gene expression analysis has identified many molecular profiles and potential biomarkers that are associated with cancer initiation and progression, histological subtypes, tumor grade, therapeutic response, and prognosis, etc (2-8). Gene expression fingerprints related to peritoneal metastasis have rarely been addressed previously (9, 10), possibly because of the difficulty in obtaining individually-matched, OCs and their metastatic samples. The limited sample size in these studies results in poor reproducibility between different studies even using the same microarray platforms [11]. Cumulative gene expression datasets are now available in public websites including NCBI Gene Expression Ominbus (GEO). Synthetic study on these datasets may overcome the limitation of sample size.
Prompted by this, we performed a combined strategy of the public gene expression data analysis and validation tests in clinical samples to uncover specific molecular events in peritoneal spread of OCs. We hope to find potential biomarkers for the clinical diagnosis of OCs.
Materials and Methods
Data collection and processing
We downloaded the gene expression microarray data and clinical data of OC from the GEO website. These data were from the Expression Project for Oncology (expO) of the International Genomics Consortium (http://intgen.fervorinteractive.com/expo/). We only chose cases of primary OCs (POC) and the peritoneal, metastasis of OCs (PMOC) with “bulky tissue” and “Affymetrix Human Genome U133 Plus 2.0 Array” (GPL570).
The downloaded data contained signal value, ABS_CALL, and detection P value for each probe that were generated by the Affymetrix Microarray Analysis Suite v5.0 (MAS5.0). The signal intensity values were transformed by logarithm of base 2 to make the data more close to the normal distribution. The DEGs between POC and PMOC were obtained by an in-house QTModel software, applied to hierarchical clustering, and imported into the Database for Annotation, Visualization and Integrated Discovery (DAVID) (http://david.abcc.ncifcrf.gov/) for gene annotations and molecular pathway analysis.
Clinical Samples
Thirty pairs of fresh tissues, and, 72 pairs of formalin-fixed paraffin-embedded (FFPE) tissues with individually-matched POC-PMOC were obtained from archival of the Department of Surgical Pathology, Women's Hospital, School of Medicine, Zhejiang University, China between January 2009 and February 2012. Fresh samples were snap-frozen in liquid nitrogen and stored in -80 °C freezer. Frozen sections were examined to ensure the presence of >70% of viable tumor cells in these samples. Total RNA was isolated from frozen tissues using the Qiagen RNeasy Mini Kit (Qiagen, Hilden, Germany) and reverse-transcribed using the High-Capacity cDNA Archive Kit (Applied Biosystems, Foster City, CA, USA). The FFPE tissues were routinely processed.
Blood samples were collected from patients with histologically confirmed POCs (n=162), and borderline tumors (n=32) before surgery or chemotherapy, and individually age-matched (at 5-yr intervals), healthy women with no history of cancer. Serum was obtained and centrifuged at 4 °C in the blood collection tube containing a separation gel for biochemical tests. The serum was kept in -80 °C freezer until use.
This study was approved by the Review Board on Medical Research Ethics of the Women's Hospital School of Medicine, Zhejiang University, in accordance with the principles of the Helsinki Declaration. All participants were consent with this study. The FFPE tissue or blood samples used in this study were archival from the department of surgical pathology or routine biochemical indexes of hospitalized patients before surgery, respectively. The fresh tissue samples were obtained from the hospital tissue bank. The clinicopathological information including the surgical stage and histology was obtained by reviewing the hospital medical records. All samples and patient records were anonymously used in this study.
Taqman Reverse Transcription (RT) -PCR Assay
Taqman, low-density array (micro-fluidic, card-based systems) was used in duplicate to measure the expression levels of 95 DEGs. These DEGs were selected due to their functions that were associated with secreted, extracellular matrix, and lipid metabolism. We used GAPDH (Glyceraldehyde 3 phosphate dehydrogenase) (NM_002046) as the reference gene for normalization. The Taqman quantitative PCR amplifications were done in the micro-fluidic card sample block of an ABI Prism® 7900HT sequence detection system (Applied Biosystems, Foster City, CA, USA). The ΔCt-based relatively amount of target gene was calculated as reported previously.
Immunohistochemistry
Four-μm-thick sections were stained with five specific primary antibodies by the 2-step En Vision method (DAKO, Carpinteria, CA, USA). The antibodies included Fibroblast growth factor 1 (FGF1), Cathepsin K (CTSK), Matrix metalloproteinase 13 (MMP13), Gremlin 1 (GREM1), and Tissue inhibitor of metalloproteinase 4 (TIMP4). They were all secreted proteins and most of them were associated with cancer metastasis. These antibodies were commercially available from Abcam Corporation, Hong Kong, China and properly diluted according to the manufacturer's instructions. We used the omission of primary antibodies as negative controls. Brown cytoplasmic staining was defined as positive. We focused on expression of these proteins in cancer cells although some proteins can also be expressed in stromal cells. The positive cells were scored as: 0 for <5%, 1 for 6%-25%, 2 for 26%-50%, 3 for 51%-75% and 4 for 76%-100%. Staining intensity was scored as: 0 for no staining, 1 for weak, 2 for moderate, and 3 for strong. Immunoreactive scores were calculated by multiplying these two grading scores, which ranged from 0 to 12.
ELISA measurement
Serum concentrations of CTSK, MMP13, and FGF1 were measured by commercial, double-antibody, sandwich ELISA kits (Cusabio Life Science, Wuhan, China). Serum CA125 and human epididymis-specific protein 4 (HE4) were detected by a chemiluminescent (Elecsys CA125 II Assay, Roche Diagnostics GmbH, Mannheim, Germany) and a chemiluminescent microparticle immunoassay (ARCHITECT HE4 Assay, Abbott GmbH & Co. KG, PA, USA).
Statistical analysis
The SPSS 13.0 (SPSS, Inc., Chicago, IL, USA) was applied for the statistical analyses. The clinicopathological differences between POCs and PMOCs were compared by χ2 test (Fisher's exact test). The significance of differential gene expression and immunoscore between POC and matched PMOC were detected by paired-sample T test. Serum levels of the biomarkers among groups and their associations with clinicopathological parameters were analyzed by One-way ANOVA (Tukey-Kramer Multiple Comparisons Test) and non-parametric test (Mann-Whitney U-test or Kruskal-Wallis test), respectively. The correlations between different markers were analyzed by the Spearman's correlations. The statistical threshold was set at 0.05 (two-sided). To further evaluate the diagnostic significance of serum biomarkers, we also use the SPSS software to construct a receiver operating characteristic (ROC) curve by plotting sensitivity versus specificity, and to calculate the areas under ROC for estimating the diagnostic efficiency.
Results
Analysis of microarray data
The downloaded gene expression microarray data were from 153 POCs and 57 PMOCs. The PMOCs included metastasis of OC to omentum (45 patients), pelvis (8 patients), transverse colon (2 patients), peritoneal (1 patient) and abdominal wall (1 patient). We found a total of 246 DEGs (fold change >=2 and p<0.01), including 72 downregulated and 174 upregulated transcripts, in PMOCs versus POCs (Supplementary Table S1). Unsupervised hierarchical clustering of these DEGs clearly distinguished PMOCs from POCs (Figure 1). DAVID pathway analysis (KEGG, Biocarta, Panther and Reactome) showed that these genes were significantly involved in metabolism, particularly metabolism of lipids and lipoproteins, the extracellular matrix-receptor interaction, and focal adhesion, etc.
Figure 1
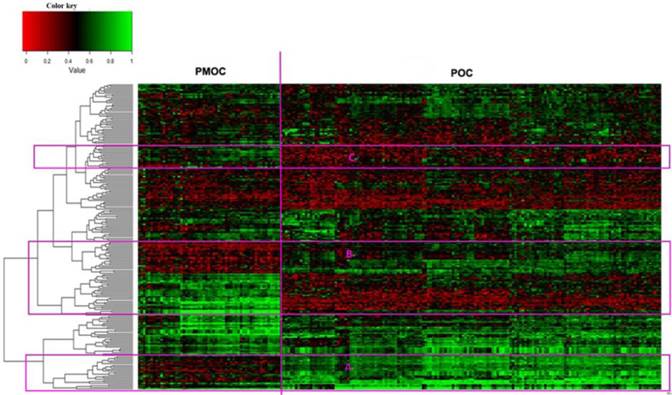
Unsupervised hierarchical clustering of 153 POCs and 57 PMOCs. Dendrogram from unsupervised hierarchical clustering of DEGs clearly distinguishes PMOCs and POCs. Three groups of characteristic genes are highlighted in the red rectangles.
Validation of DEGs by Taqman real-time RT-PCR
We applied the Taqman low density array (micro-fluidic card) to validate 95 DEGs in 30 pairs of individually-matched POC, and PMOC, fresh tissues. The results are shown in Table 1. Seventeen genes are significantly upregulated and 2 downregulated in PMOCs versus POCs (p<0.05). In addition, 14 genes show marginally-elevated, and, one decreased expression in PMOCs (p<0.1). Both microarray and Taqman real-time PCR array showed a consistently directional expression of these differentially expressed gene. The exact correlation between these two methods was not analyzed due to their differences in sensitivity.
Table 1
Validation of DEGs in POCs versus PMOCs by microfluidic cards Q-PCR.
| Gene Symbol | ΔCt in POC (Mean±SD) | ΔCt in PMOC (Mean±SD) | p value |
|---|---|---|---|
| ADAM12 | 6.69±2.22 | 5.82±1.98 | 0.103 |
| AGR2 | 9.61±3.54 | 9.67±3.27 | 0.923 |
| ALPK2 | 7.38±2.30 | 6.22±4.96 | 0.209 |
| AOC3 | 8.81±2.01 | 7.77±2.68 | 0.08 |
| ARX | 14.22±4.22 | 17.48±3.84 | 0.011 |
| ATRNL1 | 10.44±2.39 | 10.57±2.55 | 0.839 |
| BCHE | 11.19±3.32 | 9.71±2.83 | 0.005 |
| C1QTNF3 | 8.19±1.70 | 7.37±2.39 | 0.082 |
| C1QTNF6 | 8.34±1.72 | 7.52±1.98 | 0.058 |
| C4BPA | 11.53±3.37 | 12.29±3.91 | 0.289 |
| CADPS | 15.30±4.02 | 14.75±5.10 | 0.627 |
| CAMK2N1 | 6.42±2.00 | 8.37±1.68 | 0.874 |
| CCDC68 | 10.17±1.71 | 10.08±2.08 | 0.809 |
| CCDC85A | 10.40±1.60 | 10.58±2.47 | 0.748 |
| CCL19 | 10.54±2.62 | 9.05±3.97 | 0.094 |
| CD36 | 8.45±1.80 | 6.87±2.53 | 0.004 |
| CFD | 7.88±1.71 | 6.87±2,47 | 0.024 |
| CIDEA | 16.25±3.62 | 13.83±5.46 | 0.028 |
| CIDEC | 12.37±2.72 | 11.43±3.96 | 0.252 |
| CLIC6 | 7.47±3.04 | 7.92±2.11 | 0.454 |
| COLEC11 | 10.17±3.06 | 10.70±2.38 | 0.442 |
| COMP | 8.46±3.08 | 7.49±2.95 | 0.136 |
| CRISPLD2 | 6.58±2.14 | 5.50±2.06 | 0.051 |
| CRYM | 11.98±2.21 | 12.21±2.79 | 0.795 |
| CTSK | 5.28±2.01 | 4.40±1.91 | 0.04 |
| CXCL12 | 4.80±1.64 | .46±3.49 | 0.081 |
| DARC | 8.25±2.25 | 5.15±4.57 | 0.198 |
| DLK1 | 11.72±5.82 | 12.72±7.40 | 0.829 |
| DPT | 10.31±3.52 | 8.79±3.1 | 0.053 |
| ELN | 9.76±1.94 | 9.39±3.15 | 0.538 |
| ENPP6 | 16.16±4.2 | 17.28±3.87 | 0.277 |
| EPYC | 9.99±3.14 | 7.97±3.18 | 0.012 |
| F2RL1 | 8.05±1.30 | 7.97±1.88 | 0.817 |
| FAP | 6.93±2.08 | 5.83±1.99 | 0.065 |
| FBLN1 | 4.58±1.93 | 4.18±2.25 | 0.373 |
| FBLN2 | 7.99±2.13 | 7.19±2.25 | 0.108 |
| FBN1 | 5.72±1.78 | 5.17±1.69 | 0.211 |
| FGF1 | 9.67±1.47 | 8.46±2.70 | 0.058 |
| FGFR4 | 8.60±1.78 | 8.96±1.96 | 0.463 |
| FOXA2 | 9.55±2.41 | 9.66±3.17 | 0.849 |
| FOXL2 | 5.73±2.59 | 4.67±4.99 | 0.266 |
| GABRP | 10.56±3.22 | 9.91±3.29 | 0.242 |
| GATA4 | 9.83±3.73 | 11.20±3.58 | 0.159 |
| GDF15 | 7.09±1.96 | 7.32±2.11 | 0.602 |
| GHR | 9.16±1.57 | 8.65±1.87 | 0.216 |
| GREM1 | 8.57±3.2 | 6.78±2.05 | 0.011 |
| GSTA1 | 10.54±2.65 | 10.42±3.15 | 0.871 |
| GZMK | 9.85±2.21 | 8.71±2.45 | 0.046 |
| HNF1B | 11.23±4.72 | 10.97±4.22 | 0.756 |
| HS6ST2 | 18.34±2.23 | 18.38±3.58 | 0.96 |
| INHBA | 7.29±1.89 | 6.00±1.92 | 0.011 |
| ITGBL1 | 8.42±2.40 | 7.66±2.69 | 0.21 |
| KIAA1324 | 9.61±2.35 | 9.31±3.00 | 0.578 |
| LRRC15 | 5.69±1.72 | 4.10±4.22 | 0.055 |
| LUM | 3.91±2.34 | 3.08±3.63 | 0.288 |
| MEOX2 | 10.02±2.69 | 8.36±3.13 | 0.032 |
| MFAP4 | 6.87±2.31 | 6.04±2.24 | 0.15 |
| MGP | 4.97±3.16 | 4.31±2.48 | 0.409 |
| MMP11 | 4.67±2.33 | 3.20±2.32 | 0.014 |
| MMP13 | 9.40±3.71 | 7.68±2.45 | 0.015 |
| MNX1 | 15.04±3.34 | 14.71±3.95 | 0.701 |
| MSMB | 15.84±4.23 | 14.73±7.66 | 0.351 |
| MYOCD | 10.23±3.41 | 11.79±2.90 | 0.072 |
| NDP | 9.92±2.89 | 9.68±3.66 | 0.669 |
| NR1H4 | 16.32±3.59 | 17.07±3.48 | 0.437 |
| OLFM4 | 14.63±4.93 | 13.98±4.88 | 0.46 |
| OVGP1 | 11.07±1.9 | 10.69±2.28 | 0.329 |
| PCSK6 | 8.75±2.47 | 9.22±2.27 | 0.385 |
| PDLIM3 | 5.16±1.82 | 4.64±1.67 | 0.142 |
| PEG3 | 6.50±2.50 | 5.50±4.35 | 0.254 |
| PIGR | 8.93±3.52 | 9.13±3.55 | 0.722 |
| PLAC9 | 10.37±2.21 | 10.19±2.59 | 0.789 |
| PLS1 | 7.53±1.35 | 7.10±2.15 | 0.339 |
| POSTN | 3.85±2.87 | 2.34±2.29 | 0.023 |
| PPP1R1A | 8.71±1.88 | 7.83±2.47 | 0.045 |
| PRG4 | 12.96±3.48 | 10.31±4.64 | 0.001 |
| PROM1 | 8.67±3.46 | 7.85±3.29 | 0.163 |
| PRRX1 | 6.70±2.05 | 5.94±1.60 | 0.095 |
| PTGER3 | 7.55±2.14 | 6.50±2.42 | 0.067 |
| RDH10 | 6.60±1.53 | 6.32±2.19 | 0.462 |
| RSPO3 | 7.44±2.28 | 5.68±2.06 | 0.003 |
| SORBS1 | 6.93±1.30 | 6.56±1.70 | 0.258 |
| SOX11 | 7.74±2.56 | 6.66±5.02 | 0.25 |
| STAR | 10.28±4.44 | 13.62±3.87 | 0.005 |
| SVEP1 | 8.66±2.06 | 7.60±2.30 | 0.056 |
| TCF21 | 8.47±2.44 | 8.37±1.91 | 0.867 |
| TCN1 | 11.88±3.52 | 12.05±3.09 | 0.808 |
| TFF3 | 9.76±3.64 | 9.94±2.65 | 0.758 |
| THBS2 | 5.07±2.25 | 4.15±1.94 | 0.11 |
| THRSP | 10.53±2.84 | 9.36±3.55 | 0.085 |
| TIMP3 | 4.28±1.69 | 3.79±1.72 | 0.224 |
| TIMP4 | 11.39±1.92 | 10.31±3.32 | 0.072 |
| TMC5 | 10.14±2.45 | 10.23±3.19 | 0.89 |
| TMEM45B | 8.16±2.03 | 8.03±2.05 | 0.815 |
| TSPAN8 | 10.57±3.68 | 11.84±4.03 | 0.166 |
Evaluation of protein expression by immunohistochemistry
Immunohistochemistry was performed in 72 paired POC-PMOC FFPE tissues. The mean age was 55.1 (SD 10.8) years. The detailed FIGO stage distribution was 4 IIb, 2 IIIa, 11 IIIb and 55 IIIc. Extra-ovarian sites of spread included 11 omentum, 6 pelvis or uterus, 6 colorectal, and 49 wide peritoneal spread (43 with omental involvement). PMOCs for immunohistochemical staining consisted of 54 omental, 7 uterine serosa involvement, 9 colorectal, and 2 lymph nodes. Immunohistochemical staining showed that the expression of MMP13, CTSK, FGF1 or GREM1 was significantly higher in PMOCs than that in POCs (p<0.05), consistent with the results from microarray analysis and quantitative RT-PCR. Representative immunostaining patterns are shown in Figure 2. We did not find significant associations between the expression levels of these proteins in POCs and clinicopathological parameters including histological subtypes, grade and FIGO stage, etc.
Detection of serum CTSK, MMP13, and FGF1
Serum CTSK, MMP13, and FGF1 were measured in preoperative blood samples from 162 women with OC, and 194 controls. The women with OCs and controls had a mean age of 53.5 (SD 10.7) and 52.4 (SD 11.2) years, respectively. In addition, serum samples were also available from 32 women with borderline tumors. The pathological diagnosis in the borderline group included 18 serous and 14 mucinous tumors. Postoperative blood samples were also available in 6 patients with primary carcinoma including 3 serous carcinomas, 1 endometrioid adenocarcinomas, and 2 serous borderline tumors.
Serum CTSK, CA125 and HE4 levels in OCs were significantly higher than in normal controls (p<0.001) (Table 2). A weak correlation was present between serum CA125 and HE4 (RR=0.380, p<0.001), or between HE4 and CTSK (RR=0.162, p=0.001). Increased serum HE4 and CA125 were significantly associated with G2/3, serous histotype and advanced FIGO stage (p<0.05). Serum CTSK was not significantly associated with these clinicopathological parameters including histological subtypes, and grade, etc. (p>0.05). Serum concentrations of CA125, HE4 and CTSK decreased with an average of 45%, 28%, 47% in 6/6, 6/6, 5/6 post-operative versus pre-operative samples, respectively.
Figure 3 shows a receiver operating characteristic (ROC) curve of these serum biomarkers for the discrimination of OCs from healthy controls. The relative parameters including area under ROC (AUC) and Youden's index are given in Table 3. The established cutoff values of serum CA125, HE4 and CTSK predicted 22/32, 7/32, and 18/32 ovarian borderline tumors, respectively. We then defined the levels in any 2 of the 3 biomarkers over the cutoff values as the discriminator. This combination approach did not significantly improve the prediction of OCs, but improved its specificity (area under the AUC: 0.901; sensitivity 88.3%, specificity 92.0%, Youden's index 80.3%).
Figure 2
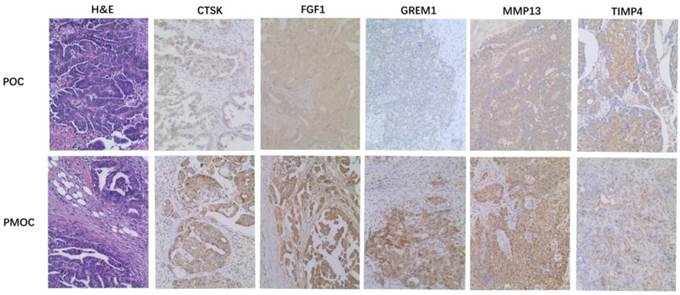
Immunohistochemistry of representative genes in PMOCs and POCs. Depicted is the representative H&E images and immunostaining pattern of CTSK, FGF1, GREM1, MMP13 and TIMP4 in POCs and PMOCs, respectively. (Original magnification: 200×).
Table 2
Serum CTSK, CA125, MMP13, FGF1 and HE4 in ovarian tumors and normal controls*.
| FGF1 (pg/mL) | CTSK (ng/mL) | MMP13 (pg/mL) | HE4 (pmol/L) | CA125 (U/mL) | |
|---|---|---|---|---|---|
| Normal control | 186.7±470.8 | 0.5±0.9 | 16.5±19.8 | 45.3±17.1 | 14.9±7.8 |
| Borderline tumor | 121.0±218.9 | 0.9±0.9 | 13.2±12.1 | 70.4±118.7 | 837.9±1036.0 |
| OC | 113.8±346.4 | 1.4±1.4 | 11.8±13.6 | 213.5±323.1 | 1095.8±2729.0 |
| p (Normal vs OC) | >0.05 | <0.001 | >0.05 | <0.001 | <0.001 |
*Mean±SD was given.
Table 3
The parameters of CA125, HE4 and CTSK for discriminating OCs from healthy controls.
| Variables | Area (95% CI) | Cutoff value | Sensitivity (%) | Specificity (%) | YI (%) |
|---|---|---|---|---|---|
| CA125 | 0.929(0.898-0.959) | 26.15 U/mL | 82.5 | 94.8 | 77.3 |
| HE4 | 0.822(0.774-0.869) | 53.25 pmol/L | 73.3 | 82.4 | 55.7 |
| CTSK | 0.739(0.685-0.793) | 0.344 ng/mL | 75.3 | 73.2 | 47.5 |
Abbreviations: CI=Confidence Interval; YI=Youden's index.
Figure 3
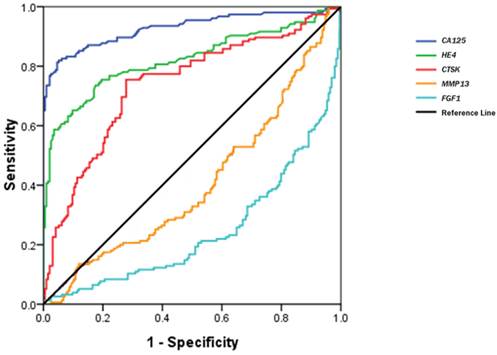
ROC curves of serum CTSK, MMP13, FGF1, CA125 and HE4 in the discrimination of OCs from normal healthy women.
Discussion
Gene expression profiling enables genome-wide, molecular characterization of OCs by providing information on various clinicopathological parameters. In this study, we showed specific gene expression profile that clearly separated PMOCs from POCs. Further exploration on these DEGs may provide insights into the molecular basis of OC spread.
We found that CTSK, an extracellular matrix protein, was overexpressed in PMOCs. The cathepsin family played essential roles in cancer metastasis. Cathepsin L can increase the proliferation and metastasis of OC cells in vivo and in vitro (12). Moreover, elevated serum cathepsin L was correlated with malignant invasion and progression in ovarian cancer, and might be useful for predicting ovarian cancer metastasis before surgery (13). Stromal cathepsin D expression correlates with microvessle density in ovarian tumors (14). Serum cathepsin D was also helpful in the detection of ovarian carcinoma (15). CTSK overexpression was present in breast cancers with metastatic potential (16). CTSK inhibitor appears to be a novel therapy for metastatic breast cancer (17). A tissue array-based study shows that CTSK expression is present in a variety of human cancers including high grade serous carcinomas (18). In keeping with that study, most OCs in our study also showed a weak to moderate staining. The role of CTSK in peritoneal spread of OCs has not been fully elucidated yet. Only one recent study suggests that CTSK might be a downstream gene of the tumor invasion-related gene, N-myc downstream regulated gene 1 (NDRG1) (19).
We also detected serum CTSK in a relatively large sample size of OCs and healthy women, and, found that CTSK might aid in the clinical diagnosis of OCs. A combination of physical examination, imaging and serum biomarkers detection remains the pillar for OC diagnosis at present (20). CA125 remains the mainstay for detection and management of ovarian cancer although it is frequently elevated in other malignancies and benign lesions. HE4 is an emerging biomarker for OCs, but its diagnostic benefits may be limited by its overexpression in other human cancers (21). Incorporating serum levels of both HE4 and CA125 is valuable in the diagnosis of OC in women with pelvic mass as suggested by the “risk of ovarian malignancy algorithm (ROMA)” (20). In this study, we confirmed the diagnostic value of these biomarkers. Moreover, we found that combining CTSK, HE4 and CA125 produced a slightly improved specificity for predicting OCs by generating a Youden's index of 80.3%. More clinical samples including both benign ovarian lesions and extra-ovarian malignancies are required to consolidate these findings.
We demonstrated that some DEGs are involved in the metabolism of lipids and lipoproteins, such as cell death-inducing DFFA-like effector A (CIDEA), complement factor D (adipsin) (CFD), butyrylcholinesterase (BCHE), and fatty acid binding protein 4 (FABP4), etc. Dysregulation of these lipid metabolism-related genes may reflect alterations in the microenvironment between adipose tissue and cancer cells. Fatty tissue may promote ovarian cancer metastasis as a direct energy resource. FABP4 plays essential roles in this process since FABP4-deficient mice have impaired, metastatic tumor growth (22). The interaction between adipose tissue and cancer cells may be an important mechanism to explain peritoneal spread in OCs. We postulate that the sites of spread are largely fatty tissues providing “suitable soil” for metastatic ovarian cancer “seeds”, and, rapid growth. These lipid-metabolism-related genes may be potential novel targets for therapeutic intervention in the future.
Other DEGs, particularly those of the extracellular matrix members, also play important roles in cancer metastasis. MMPs can promote cancer metastasis by degrading almost all structural components of extracellular matrix while TIMPs (TIMP1-4) suppress tumor invasion by inhibiting the activity of MMPs with low selectivity (23). MMP11 expression may serve as a predictor for cancer death while MMP13 can be detected in the ascites of advanced OC. TIMPs can act as negative regulators in lysophosphatidic acid-induced cancer invasion. FGF1 is involved in a variety of biological processes including cell growth, tissue repair, angiogenesis, and tumor invasion, etc (24). FGF1 expression influenced progression-free survival, and, response to platinum-based chemotherapy in high grade, ovarian serous carcinomas (25). GREM1, a secreted antagonist of bone morphogenic proteins (BMPs), may facilitate tumor progression by epithelial-mesenchymal transition induction in colorectal cancer cells (26), but its role in OC remains unknown.
A major technical advantage of our study comes from the utility of the standard public dataset and validation tests with a large sample size. The efficiency of this method was validated by the fact that a number of probe-set, ID-matched genes (32/246, 13%, data not shown) overlapped with those from a recent study using an identical technical platform (9). In contrast, a recent report has indicated that DEGs are rarely co-presented in different studies even using the same technical platforms (11). Moreover, 20% (19/95) of DEGs were validated by the Taqman low density array quantitative PCR in our studies. However, we have to admit the presence of two major limitations in this study. First, the quality of samples for microarray is variable since the percentage of viable tumor cells in these samples is unknown. Hence, we could not rule out the possibility that some DEGs may reflect the presence of stromal components rather than the true biological difference between POCs and PMOCs. Second, many differences that we observed may likely reflect the over-presentation of grade 2/3 (high grade) serous carcinoma in this study. However, this sampling bias is inevitable because high grade serous carcinomas occupy the majority of ovarian carcinomas and frequently present with wide peritoneal spread.
In conclusions, microarray data mining and systemic validation tests including microfluidic card-based quantitative PCR are useful in the identification of biomarkers for ovarian carcinoma. CTSK emerges as a useful marker for the diagnosis of primary OCs. Differential expression of the lipid metabolism-related genes suggests that the interaction between adipose tissue and cancer cells might be essential for peritoneal spread of OCs. Further studies will be necessary to develop these findings.
Supplementary Material
Table S1.
Abbreviations
OC: ovarian carcinoma; DEG: differentially-expressed gene; POC: primary ovarian carcinoma; PMOC: peritoneal, metastasis of ovarian carcinoma; FFPE: formalin-fixed paraffin-embedded; FGF1: Fibroblast growth factor 1; CTSK: Cathepsin K; MMP13: Matrix metalloproteinase 13; GREM1: Gremlin 1; TIMP4: Tissue inhibitor of metalloproteinase 4; HE4: human epididymis-specific protein 4.
Acknowledgements
This work is supported by natural science foundations of Zhejiang Province, PR China (No: Y211071; No: LQ12H16008). We thank Mr Junyan Ma, Mrs Caiyun Zhou and Ms Minghua Yu, for their excellent technical support. We especially thanks for a visiting professor from UK for his kind help in linguistic tuning.
Competing Interests
The authors have declared that no competing interest exists.
References
1. Jemal A, Bray F, Center MM. et al. Global cancer statistics. CA Cancer J Clin. 2011;61:69-90
2. Mok SC, Chao J, Skates S. et al. Prostasin, a potential serum marker for ovarian cancer: identification through microarray technology. J Natl Cancer Inst. 2001;93:1458-64
3. Bonome T, Levine DA, Shih J. et al. A gene signature predicting for survival in suboptimally debulked patients with ovarian cancer. Cancer Res. 2008;68:5478-86
4. Sabatier R, Finetti P, Bonensea J. et al. A seven-gene prognostic model for platinum-treated ovarian carcinomas. Br J Cancer. 2011;105:304-11
5. Ouellet V, Guyot MC, Le Page C. et al. Tissue array analysis of expression microarray candidates identifies markers associated with tumor grade and outcome in serous epithelial ovarian cancer. Int J Cancer. 2006;119:599-607
6. Selvanayagam ZE, Cheung TH, Wei N. et al. Prediction of chemotherapeutic response in ovarian cancer with DNA microarray expression profiling. Cancer Genet Cytogenet. 2004;154:63-6
7. Gómez-Raposo C, Mendiola M, Barriuso J. et al. Molecular characterization of ovarian cancer by gene-expression profiling. Gynecol Oncol. 2010;118:88-92
8. Fekete T, Rásó E, Pete I. et al. Meta-analysis of gene expression profiles associated with histological classification and survival in 829 ovarian cancer samples. Int J Cancer. 2012;131:95-105
9. Bignotti E, Tassi RA, Calza S. et al. Gene expression profile of ovarian serous papillary carcinomas: identification of metastasis-associated genes. Am J Obstet Gynecol. 2007;196:245.e1-11
10. Lancaster JM, Dressman HK, Clarke JP. et al. Identification of genes associated with ovarian cancer metastasis using microarray expression analysis. Int J Gynecol Cancer. 2006;16:1733-45
11. Györffy B, Dietel M, Fekete T. et al. A snapshot of microarray-generated gene expression signatures associated with ovarian carcinoma. Int J Gynecol Cancer. 2008;18:1215-33
12. Zhang L, Wei L, Shen G. et al. Cathepsin L is involved in proliferation and invasion of ovarian cancer cells. Mol Med Rep. 2015;11:468-74
13. Zhang W, Yang HC, Wang Q. et al. Clinical value of combined detection of serum matrix metalloproteinase-9, heparanase, and cathepsin for determining ovarian cancer invasion and metastasis. Anticancer Res. 2011;31:3423-8
14. Lösch A, Schindl M, Kohlberger P. et al. Cathepsin D in ovarian cancer: prognostic value and correlation with p53 expression and microvessel density. Gynecol Oncol. 2004;92:545-52
15. Tang HY, Beer LA, Chang-Wong T. et al. A xenograft mouse model coupled with in-depth plasma proteome analysis facilitates identification of novel serum biomarkers for human ovarian cancer. J Proteome Res. 2012;11:678-91
16. Kleer CG, Bloushtain-Qimron N, Chen YH. et al. Epithelial and stromal cathepsin K and CXCL14 expression in breast tumor progression. Clin Cancer Res. 2008;14:5357-67
17. Duong LT, Wesolowski GA, Leung P. et al. Efficacy of a Cathepsin K Inhibitor in a Preclinical Model for Prevention and Treatment of Breast Cancer Bone Metastasis. Mol Cancer Ther. 2014;13:2898-909
18. Zheng G, Martignoni G, Antonescu C. et al. A broad survey of cathepsin K immunoreactivity in human neoplasms. Am J Clin Pathol. 2013;139:151-9
19. Zhao G, Chen J, Deng Y. et al. Identification of NDRG1-regulated genes associated with invasive potential in cervical and ovarian cancer cells. Biochem Biophys Res Commun. 2011;408:154-9
20. Karlsen MA, Sandhu N, Høgdall C. et al. Evaluation of HE4, CA125, risk of ovarian malignancy algorithm (ROMA) and risk of malignancy index (RMI) as diagnostic tools of epithelial ovarian cancer in patients with a pelvic mass. Gynecol Oncol. 2012;127:379-3
21. Karlsen NS, Karlsen MA, Høgdall CK. et al. HE4 Tissue Expression and Serum HE4 Levels in Healthy Individuals and Patients with Benign or Malignant Tumors: A Systematic Review. Cancer Epidemiol Biomarkers Prev. 2014;23:2285-95
22. Nieman KM, Kenny HA, Penicka CV. et al. Adipocytes promote ovarian cancer metastasis and provide energy for rapid tumor growth. Nat Med. 2011;17:1498-503
23. Stetler-Stevenson WG. The tumor microenvironment: regulation by MMP-independent effects of tissue inhibitor of metalloproteinases-2. Cancer Metastasis Rev. 2008;27:57-66
24. Kwabi-Addo B, Ozen M, Ittmann M. The role of fibroblast growth factors and their receptors in prostate cancer. Endocr Relat Cancer. 2004;11:709-24
25. Smith G, Ng MT, Shepherd L. et al. Individuality in FGF1 expression significantly influences platinum resistance and progression-free survival in ovarian cancer. Br J Cancer. 2012;107:1327-36
26. Karagiannis GS, Musrap N, Saraon P. et al. Bone morphogenetic protein antagonist gremlin-1 regulates colon cancer progression. Biol Chem. 2015;396:163-83
Author contact
![]() Corresponding author: Bingjian Lu, MD. Department of Surgical Pathology, the Affiliated Women's Hospital, School of Medicine, Zhejiang University, 1 Xueshi Road, Hangzhou, Zhejiang Province, PR China, 310006. Email: lbjedu.cn Tel: 86-571-89991702.
Corresponding author: Bingjian Lu, MD. Department of Surgical Pathology, the Affiliated Women's Hospital, School of Medicine, Zhejiang University, 1 Xueshi Road, Hangzhou, Zhejiang Province, PR China, 310006. Email: lbjedu.cn Tel: 86-571-89991702.
Citation styles
APA
Xu, H., Ma, Y., Zhang, Y., Pan, Z., Lu, Y., Liu, P., Lu, B. (2016). Identification of Cathepsin K in the Peritoneal Metastasis of Ovarian Carcinoma Using In-silico, Gene Expression Analysis. Journal of Cancer, 7(6), 722-729. https://doi.org/10.7150/jca.14277.
ACS
Xu, H.; Ma, Y.; Zhang, Y.; Pan, Z.; Lu, Y.; Liu, P.; Lu, B. Identification of Cathepsin K in the Peritoneal Metastasis of Ovarian Carcinoma Using In-silico, Gene Expression Analysis. J. Cancer 2016, 7 (6), 722-729. DOI: 10.7150/jca.14277.
NLM
Xu H, Ma Y, Zhang Y, Pan Z, Lu Y, Liu P, Lu B. Identification of Cathepsin K in the Peritoneal Metastasis of Ovarian Carcinoma Using In-silico, Gene Expression Analysis. J Cancer 2016; 7(6):722-729. doi:10.7150/jca.14277. https://www.jcancer.org/v07p0722.htm
CSE
Xu H, Ma Y, Zhang Y, Pan Z, Lu Y, Liu P, Lu B. 2016. Identification of Cathepsin K in the Peritoneal Metastasis of Ovarian Carcinoma Using In-silico, Gene Expression Analysis. J Cancer. 7(6):722-729.
This is an open access article distributed under the terms of the Creative Commons Attribution (CC BY-NC) License. See http://ivyspring.com/terms for full terms and conditions.