Journal of Cancer
ISSN: 1837-9664
3.2
Impact Factor
ISSN: 1837-9664

 Global reach, higher impact
J Cancer 2016; 7(12):1701-1710. doi:10.7150/jca.15486 This issue Cite
Research Paper
Sample Level Enrichment Analysis of KEGG Pathways Identifies Clinically Relevant Subtypes of Glioblastoma
Siyi Wanggou, Chengyuan Feng, Yuanyang Xie, Linrong Ye, Feiyifan Wang, Xuejun Li ![]()
Department of Neurosurgery, Xiangya Hospital, Central South University.
Received 2016-3-9; Accepted 2016-6-2; Published 2016-7-26
Citation:
Wanggou S, Feng C, Xie Y, Ye L, Wang F, Li X. Sample Level Enrichment Analysis of KEGG Pathways Identifies Clinically Relevant Subtypes of Glioblastoma. J Cancer 2016; 7(12):1701-1710. doi:10.7150/jca.15486. https://www.jcancer.org/v07p1701.htm
Other stylesAbstract
Background: Glioblastoma is the most lethal primary brain tumor in adults. Aberrant signal transduction pathways, associated with the progression of glioblastoma, have been identified recently and may offer a potential gene therapy strategy.
Methods and Findings: We first used the sample level enrichment analysis to transfer gene expression profile of TCGA dataset into pathway enrichment z-score matrix. Then, we classified glioblastoma into five subtypes (Cluster A to Cluster E) by the consensus clustering and silhouette analysis. Principle component analysis showed the five subtype could be separated by first three principle components. Integrative omics data showed that mesenchymal subtype was rich in Cluster A, neural subtype was centered in Cluster D and proneural subtype was gathered in Cluster E, while Cluster E showed a high percentage of G-CIMP subtype. Additionally, according to analyze the overall survival and progression free survival of each subtype by Kaplan-Merie analysis and Cox hazard proportion model, we identified Cluster D and Cluster E received a better prognosis.
Conclusions: We report a clinically relevant classification of glioblastoma based on sample level KEGG pathway enrichment profile and this novel classification system provided new insights into the heterogeneity of glioblastoma, and may be used as an important clinical tool to predict the prognosis.
Keywords: Glioblastoma, KEGG pathway, Sample level enrichment analysis, Classification, Prognosis.
Background
Glioblastoma is the most lethal and common malignant brain tumor in adults [1]. With a median survival time of only 14 months, the relative survival estimates for glioblastoma are quite low: less than 5% of patients survive 5 years post-diagnosis [2]. Histological heterogeneity of glioblastoma had been recognized by the early 1980s [3]. Recent works provided molecular definitions of these tumors: somatic mutations, copy number alterations, expression profiling, gene methylation, miRNA expression and cancer stem cells define molecular heterogeneity of glioblastoma at different aspects [4]. Recently, cancer genome studies suggested that distinct types of alterations in different genes tend to accumulate in pathways central to the control of cell growth and cell fate determination, while pan-cancer analysis of TCGA (The Cancer Genome Atlas) data established connections between aberrant signal transduction pathways and glioblastoma[5, 6].
A signal transduction pathway (STP) is a network of intercellular information flow initiated when extracellular signaling molecules bind to cell-surface receptors. Kyoto Encyclopedia of Genes and Genomes (KEGG) pathway is a collection of manually drawn pathway maps representing our knowledge of the molecular interaction and reaction networks [7-9]. Signaling pathways are not isolated, but rather it is believed there is inter-pathway communications [10]. Furthermore, the molecular heterogeneity of cancers will result different signaling pathways status that may show clinical relevance [4]. For high-dimensional genetic data, it is reasonable to make pathways to be seen as low-dimensional projections of numerous gene. In this study, we collected TCGA dataset as training set and Rembrandt dataset as validation set and analyzed individual KEGG pathway enrichment profile of glioblastoma by the sample level enrichment analysis as described by Gundem and identified five subtypes of this kind of tumor [11]. Principle component analysis then explained these five subtypes by first three principle components. Integrative omics data showed their functional annotation. Finally, we estimated the situation of overall survival and progression free survival of the five subtypes using Kaplan-Meier test and Cox hazard proportion model.
Materials and methods
Transcriptomic and clinical data
No human subject was involved in the study. We utilized the publically available datasets from the cancer genome atlas (TCGA).
The TCGA glioblastoma multiforme (GBM) gene expression data can be acquired from https://genome-cancer.ucsc.edu/proj/site/hgHeatmap/?datasetSearch=GBM. The dataset contains data on the expression levels of 17,814 genes in the tumor tissues and the normal tissues. A total of 529 tumors were included in TCGA dataset.
The Rembrandt data set was acquired from https://wiki.nci.nih.gov/display/caIntegrator/caIntegrator+Directory. The dataset contained data on 228 cases of glioblastoma, 171 cases of Astrocytoma, 86 cases of oligodendroglioma and 31 cases of normal tissue. We selected the 228 glioblastoma samples as Rembrandt glioblastoma dataset for validation.
The data normalization and processing were conducted by R software with a Bioconductor package. Then the input cancer versus normal data were obtained by mean-centering expression value of each gene across all the samples and dividing the value by the standard deviation for the following sample level enrichment analysis [11].
Sample level enrichment analysis and KEGG pathway module
The sample level enrichment analysis (SLEA) is a novel methodology that has a more general use for enrichment analysis at the level of individual samples and is widely accepted recently [11-17]. The pathways or modules are represented as lists of genes, which can be obtained from the literature or online repositories such as Gene Ontology and KEGG, as well as determined through other high-throughput assays. Without using a priori phenotypic information about the samples, the SLEA calculates an enrichment score per sample per gene set using the z-test. This score is used to determine the relative importance of the corresponding module or pathway in different patient groups [11, 13].
In this study, the enrichment analysis for each sample was performed using Gitools version 1.6.0. We used the z-score method as described above. This method compares the mean (or median) expression value of genes in each module to a distribution of mean (or median) of 10, 000 random modules of the same size drawn from the expression values for the same sample. The result of this enrichment analysis is a z-score, which is a measure of the difference between the observed and the expected mean (or median) expression values for a gene set. The P value related to the z-score was corrected for multiple testing using Benjamini-Hochberg false discovery rate (FDR) method. A module is “positively enriched” in a sample if it has a positive z-score with a corrected P-value < 0.05 and is “negatively enriched” if the z-score is negative with a corrected P-value < 0.05[11, 13, 17]. Besides the enrichment condition for individual samples, we also used the enrichment values for pathway clustering and principle component analysis as described [14, 17]. The results were visualized as heat maps in Gitools, which is useful for identification and interpretation of the enrichment patterns among the samples.
The KEGG pathway modules were downloaded at http://www.genome.jp/kegg/pathway.html. We investigated a total of 294 signaling pathways in the KEGG databases. For each pathway, we identified all the related genes. By mapping the gene names in the gene sets identified using KEGG pathways and the gene names in the TCGA dataset and Rembrandt dataset, we extracted the gene expression profiles for each of the 294 pathways from the 529 tumor samples in training set and the 228 tumor samples in validation set.
Identification of pathway enrichment-based subtypes
Hierarchical clustering with agglomerative average linkage was applied through the R ConsensusClusterPlus package, as our basis for consensus clustering, to detect robust clusters [18, 19]. The distance metric was 1-(Pearson's correlation coefficient) and the procedure was run over 1000 iterations and a subsampling ratio of 0.8 using the 529 GBM samples and enrichment z-scores of 294 KEGG pathways. Silhouette analysis was used as graphical aid to the interpretation and validation of clusters [20, 21]. “Silhouette” of R was selected for calculating. As described by Verhaak, silhouette width is defined as the ratio of each sample's average distance to samples in the same cluster to the smallest distance to samples not in the same cluster and only samples with positive silhouette values were retained for further analysis as they best represented each subtype [21].
Principle component analysis
The principle component analysis (PCA) was conducted by R software. Individual z-scores generated from SLEA were applied for analysis. A data set of 294 KEGG pathways in 529 glioblastomas was included. To reduce the dimensionality of the data, we first performed a “scree-plot” to determine how many principal components needed to explain most of the variance in the data. Thus, we plotted the transformed eigenvalue coefficients of each cluster against the first three principal components. Finally, we used combination of frequency distribution of each cluster from the first three principal components to describe the features of different subtypes.
Statistical analysis
We used the Chi-square test to analyze the impact of the clinical features on the enrichment conditions of each pathway. Kaplan-Meier survival analysis was used to estimate the survival distributions. The log-rank test was used to assess the statistical significance. The Cox proportional hazard model was selected for multifactor analysis. “Survdiff” and “coxph” from R Bioconductor package were used to calculate the significance and the hazard ratios for the log rank test and the Cox proportional hazards. “Survplot” was used for the Kaplan-Meier curves. P < 0.05 was considered as significant.
Results
KEGG pathway enrichment status in glioblastoma
In our study, 17814 genes were projected to 294 KEGG pathways from 529 glioblastoma samples. We used the enrichment rate to rank the pathways in glioblastoma. The top 50 positively enriched pathways were shown in Figure 1, and the top 50 negatively enriched pathways were shown in Supplementary Figure 1. Among the 294 pathways, the most positively and the most negatively enriched pathways are the neuroactive ligand-receptor interaction pathway (42.0%) and the ribosome pathway (37.9%), respectively. The global enrichment rate of KEGG pathways were shown in Supplementary Table 1. From pathways ranking of both positive and negative enrichment rate, we found that more positively enriched pathways were more likely to be more enriched in the contrary direction (Supplementary Figure 2).
Figure 1
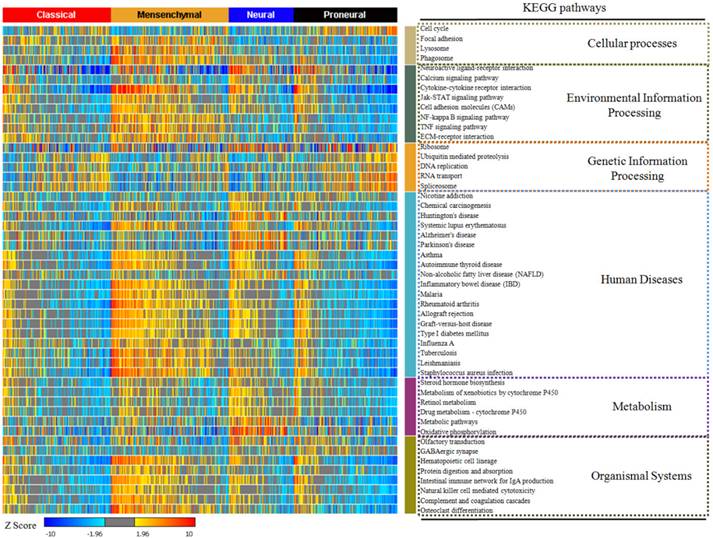
The top 50 enriched KEGG pathways in glioblastoma. The enrichment rate of each pathway was generated from Sample Level Enrichment Analysis. The pathways were regrouped by their classification belonging. All the samples were classified by molecular subtypes. Each subtype showed a differential enrichment status, which reflected an intrinsic association between KEGG pathways and molecular subtypes.
Figure 2
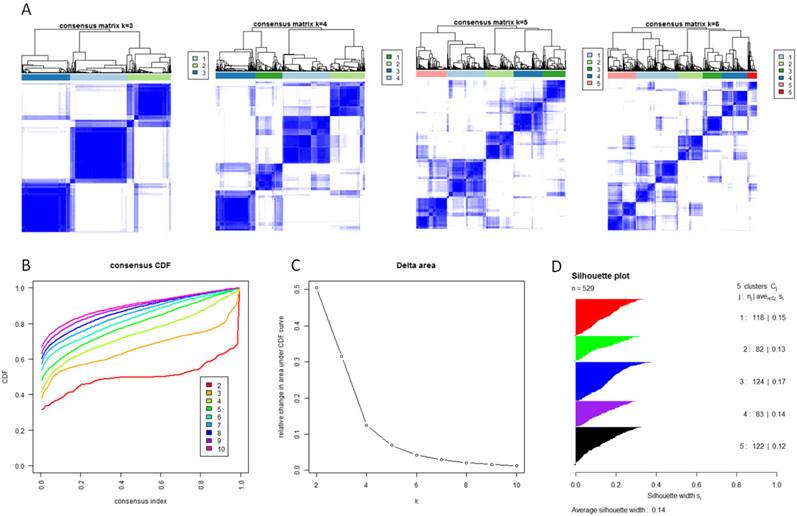
Identification of five GBM subtypes based on individual KEGG pathway enrichment. (A) Consensus clustering matrix of 529 TCGA samples for k=3 to k=6. (B) Consensus clustering CDF for k=2 to k=10. (C) Relative change in area under CDF curve for k=2 to k=10. (D) Silhouette plot for identification of each clusters.
After describing the global view of the pathway enrichment, we analyzed the relationship between the pathway enrichment and the clinical features including gender, age, molecular subtypes and G-CIMP subtypes. We found that age and gender had minimal impact on the pathway enrichment. Among the 294 KEGG pathways, only 2.38% were associated with age and 5.10% with gender. However, 24.5% were associated with the G-CIMP subtypes indicating that the G-CIMP status also interacted with the molecular phenotype at the signaling pathway level. The molecular subtypes showed an even stronger relationship with the pathway enrichment. 75.5% of the pathways showed significantly different enrichment among the classical, mesenchymal, neural and proneural subtypes (Supplementary Table 2).
Consensus clustering identified five subtypes in glioblastoma
With the low dimensional data generated from sample level enrichment analysis, consensus clustering of 529 samples and 294 pathways identified five clusters. The clustering stability increased significantly from k=2 to k=5, but not for k>5 (Figure 2 A, B and C). Samples in each cluster were identified based on their positive silhouette width, indicating more similarity in their own class than in other classes (Figure 2 D). The results are visualized in Figure 3 (left panel). In addition, five characteristic pathway signatures were identified.
Principal component analysis indicating independence of each subtype
We first evaluated the variance of the principal components (PCs). 23 components were included to reach the cumulative variance proportion point (0.85) (Figure 4). The contribution rates of the first three components (PC1, PC2 and PC3) were 23.6%, 17.6% and 13.6%, respectively. The cumulative contribution rates of the top three were 55.8%. As seen in Figure 4 C, the two-dimensional plot showed that the first two components could not only separate clusters A, B and C from each other, but also separate them from clusters D and E. But PC1 and PC2 could not discriminate cluster D from cluster E. PC1 and PC2 accounted for 41.2% of the total variance. PC3, plotted against PC2 in Figure 4 D and against PC1 in Figure 4 E, accounted for the majority of the variance between clusters D and E, but introduced little variance among clusters A, B and C. Thus, categorizing the pathway enrichment patterns of the glioblastoma by consensus clustering in our study accounts for most variance in the data set and demonstrates the subtypes generated from SLEA were independent from each other.
Figure 3
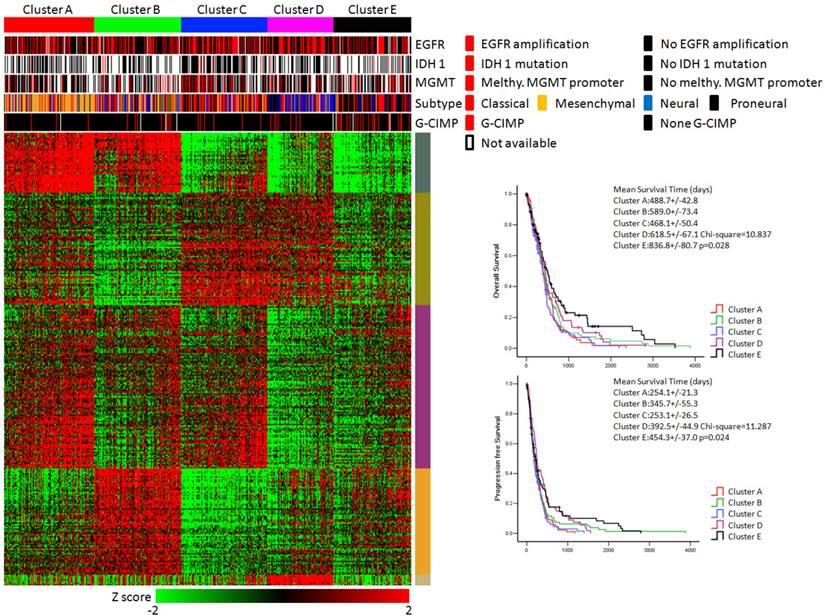
KEGG pathway enrichment data identified five subtypes of glioblastoma. (Left panel) Clusters based on differently enriched KEGG pathways and integrated view of EGFR amplification, IDH1 mutation, MGMT promoter melthylation, G-CIMP status and molecular subtypes across these five clusters. (Right panel) Kaplan-Meier estimates of overall survival and progression survival in patients with five subtypes.
KEGG pathway enrichment based subtypes in validation dataset
For 228 samples from Rembrandt dataset, patients of glioblastoma can also be classified into five subtypes based on KEGG pathway enrichment z-score profile. Pathway order from the TCGA samples was maintained in validation set and the data were visualized in supplementary figure 3A. By keeping the same pathway order as in training set, the glioblastoma sample groups were clearly regained.
Functional annotation of each subtype
According to the calculation of principal component loadings of the first three components, we identified 40 pathways as the annotation of the novel subtypes.
As seen in Figure 5, we grouped the pathways mainly contributing to PC1 (absolute value of PC loadings>0.1) into PC1 module A (negative PC loadings) and PC1 module B (positive PC loadings). We found that clusters A and B were highly positively enriched in PC1 module A pathways, while clusters C, D and E were markedly negatively enriched in these pathways. In contrast, for the pathways in PC1 module B, cluster A was hardly enriched, cluster B was highly negatively enriched, cluster C was highly positively enriched, and clusters D and E were moderately enriched. The pathways that mainly contributed for principal PC2 were listed under PC2 module. The PC loadings of all these pathways were above 0.1, which meant they contributed to PC2 in the same direction. Clusters A and C were positively enriched in PC2 module, while clusters B, D and E were negatively enriched.
PC3 module included pathways contributing to PC3. Using the same classification principles for PC1 module, PC3 module was divided as module A and module B. This module can separate cluster D from cluster E. Cluster D was positively enriched in PC3 module A pathways, negatively enriched in PC3 module B pathways, while cluster E was vice versa (Figure 5).
Figure 4
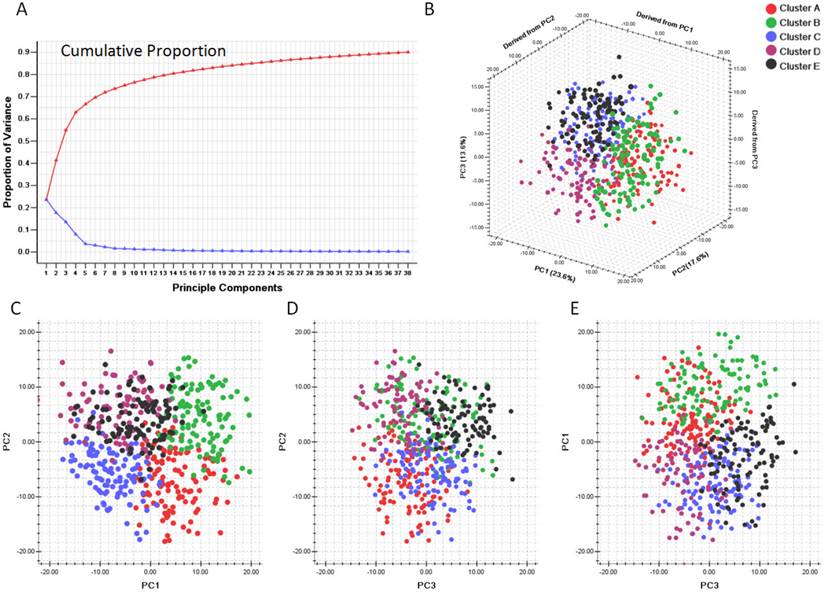
Principle component analysis based on clusters generated by consensus clustering from SLEA data. A. Variance of principle components evaluated. B. Three dimensional plot of five clusters with top three principle components. C. PCA plot with PC1 and PC2. D. PCA plot with PC1 and PC3. E. PCA plot with PC2 and PC3. PC1: Principle component 1; PC2: Principle component 2; PC3: Principle component 3. The generated five clusters of glioblastoma were differently colored.
As shown in Figure 3, the integrative view of the omics data showed that G-CIMP subtype was majorly gathered in cluster E, but was hardly found in other clusters. Samples of the mesenchymal subtype, the neuronal subtype and the proneural subtype were mostly enriched in clusters A,D and E, respectively. Samples of the classical subtype were found in every cluster. On the other hand, EGFR amplification, IDH 1 mutation and MGMT promoter melthylation showed no difference among these five subtypes (Figure 3).
Clinical correlations of each subtype
The overall survival rate and the progression free survival rate of each subtype estimated by Kaplan-Meier were significantly different. The overall survival rates as well as the progression free survival rates of clusters D and E were much higher than the other three subtypes (Figure 3). Patients in cluster E had the best prognosis with a mean overall survival time of 836.8 days and a mean progression free survival time of 454.3 days. Patients in clusters A, B and C had the very poor prognosis. According to the estimated prognosis, we combined clusters D and E into one group and the rest clusters into the other group. The survival curves of combined groups showed that the prognosis of cluster D & E group was much better in both the overall survival time (cluster D & E group vs cluster A, B & C group:725.1+/-66.9 days vs 520.9 +/- 34.6 days) and the progression free survival time (cluster D & E group vs cluster A, B & C group: 423.6+/-43.6 days vs 287.1+/-22.8 days) (Figure 6). These results were further validated in Rembrandt dataset (Supplementary figure 3 B,C and Supplementary figure 4).
In addition, we introduced age, gender, karnorfsky performance scoring, G-CIMP subtypes, molecular subtypes, treatment modalities, surgical resection level and combined clustering groups into Cox hazard proportion model. This multi-factor analysis showed that cluster D & E group received a significantly better prognosis in both overall survival and progression free survival (Table 1A & Table 1B).
Table 1A
Cox proportional hazards model for overall survival.
| Co.ef | Std.Err. | P Value | Haz.ratio(95% CI) | |
|---|---|---|---|---|
| Combined pathway enrichment clustering | -0.341 | 0.141 | 0.015 | 0.711 (0.540-0.937) |
| G-CIMP | -0.909 | 0.238 | <0.001 | 0.403 (0.253-0.642) |
| Treatment modality | -1.479 | 0.233 | <0.001 | 0.228 (0.144-0.360) |
| Age | 0.755 | 0.138 | <0.001 | 2.129 (1.623-2.792) |
| KPS | -0.419 | 0.152 | 0.006 | 0.658 (0.489-0.886) |
No. of subjects = 366; No. of event = 278; No. of censored = 88. Log likelihood = 2692.483. Method: Backward likewise
Combined pathway enrichment clustering: 0=Cluster A,B &C group. 1= Cluster D & E group.
Molecular subtype: 0= Non-proneural subtype. 1= Proneural subtype.
G-CIMP: 0=Non-C-CIMP, 1=G-CIMP
Treatment modality: 0= Without chemotherapy or radiotherapy, 1= Chemotherapy with/or radiotherapy.
Age: 0=Age<65 years, 1= Age>65 years.
KPS:0= KPS<70, 1=KPS>=70.
Gender: 0=Female, 1= Male.
Table 1B
Cox proportional hazards model for progression free survival.
| Co.ef | Std.Err. | P Value | Haz.ratio(95% CI) | |
|---|---|---|---|---|
| Combined pathway enrichment clustering | -0.255 | 0.134 | 0.048 | 0.775 (0.596-1.009) |
| Molecular subtype | -0.319 | 0.157 | 0.042 | 0.727 (0.535-0.988) |
| G-CIMP | -1.194 | 0.244 | <0.001 | 0.303 (0.188-0.489) |
| Treatment modality | -0.783 | 0.211 | <0.001 | 0.457 (0.302-0.692) |
| Age | 0.435 | 0.124 | <0.001 | 1.545 (1.211-1.972) |
No. of subjects = 368; No. of event = 328; No. of censored = 40. Log likelihood = 3226.034. Method: Backward likewise
Combined pathway enrichment clustering: 0=Cluster A,B &C group. 1= Cluster D & E group.
Molecular subtype: 0= Non-proneural subtype. 1= Proneural subtype.
G-CIMP: 0=Non-C-CIMP, 1=G-CIMP
Treatment modality: 0= Without chemotherapy or radiotherapy, 1= Chemotherapy with/or radiotherapy.
Age: 0=Age<65 years, 1= Age>65 years.
KPS:0= KPS<70, 1=KPS>=70.
Gender: 0=Female, 1= Male.
Figure 5
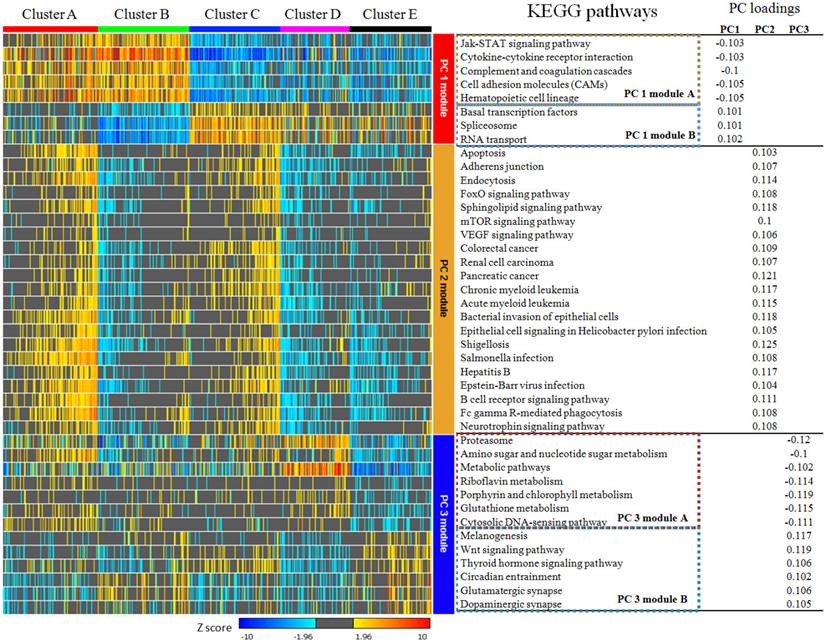
KEGG pathways with absolute value of principal component loadings (PC loadings)>0.1 in first three components. PC 1 module can be divided into module A and module B according to PC loadings, which indicated they play different role in PC 1 at contrast direction. Pathways in PC 2 module are consistently positive. PC 3 module was also divided into two sub-modules. PC 1 module and PC 2 module were able to separate cluster A,B and C from each other and identify cluster D & E from cluster A,B & C obviously, but they can hardly discriminate cluster D and E from each other. Pathways in PC 3 module showed no differences among cluster A,B & C, but they can be used to separate cluster D from E.
Figure 6
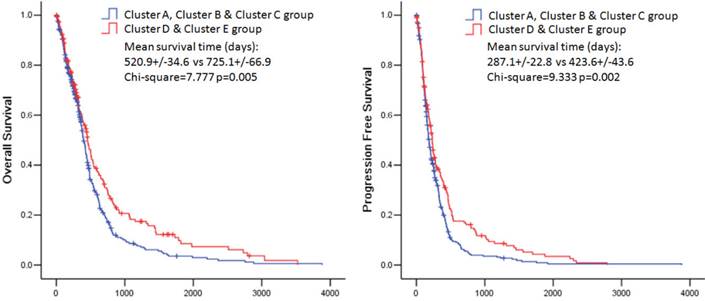
Kaplan-Meier estimates of overall survival and progression free survival in patients with combined pathway enrichment clustering groups. Left panel: overall survival. Right panel: progression free survival.
Discussion
Glioblastoma is a heterogeneous disease [4]. Besides the morphological and clinical heterogeneity, molecular profiling variation also plays a role. Glioblastoma share common traits, e.g. recurrent mutations, deletions, amplifications, rearrangements and resembling gene expression; however they also display many genetic differences [4]. As the first cancer with comprehensive genomic profiles mapped by TCGA project, glioblastoma is also considered to be associated with aberrant signal transduction pathways [5, 6].
Enrichment analysis is based on the idea that analysis of pathway-level differences among samples could have an advantage of reflecting the true oncogenic phenotypes achieved through consistent expression of a set of genes compared with the acute expression of a single gene [11]. The sample level enrichment analysis could make pathways seen as low-dimensional projections of numerous genes. The main advantage of SLEA is that every sample could generate a new enrichment map of gene sets. Based on the maps from different samples, a novel matrix will occur and it could be used for further analysis at the pathway level [11, 13]. In this study, we generated a novel data matrix of glioblastoma samples by SLEA, which contained the enrichment status of 294 signaling pathways. According to the analysis, we found that the heterogeneity of glioblastoma can also be reflected on the pathway level. For example, compared with normal brain tissues, the enrichment status of Cytokine-cytokine receptor interaction pathway fluctuated dramatically among glioblastoma samples. This pathway was positively enriched in 40.0% of all samples, and negatively enriched in 36.0% of them. We found that more than 75% of all the KEGG pathways had significantly different enrichment statuses among various glioblastoma molecular subtypes and 24.5% of all the pathways were associated with genomic melthylation status. Therefore the pathway status of glioblastoma is unstable among samples. Serdar Bozdag et al. also identified such instability. According to their analysis, some GBM subtype-specific or melthylation subtype-specific pathways were found [22]. These results provided an important clue that the pathway enrichment status of glioblastoma is associated with the molecular expression pattern or the genomic melthylation pattern. The heterogeneity of glioblastoma on the molecular level resulted in differently enriched pathways.
Based on the heterogeneity of glioblastoma, recent development of molecular classification regrouped GBM samples into several molecular subtypes according to their transcriptomic and epigenetic profiles. Based on mRNA expression, micro-RNA expression, long noncoding RNA expression, DNA melthylation or computer-generated nuclear morphometric analyses of large-scale microscopic images, many different classification systems were established [21, 23-30]. However, none of these classification systems was discovered at the molecular network or pathway level. According to the consensus clustering analysis and Silhouette analysis, we identified a novel classification system for glioblastoma. Based on the pathway enrichment status, glioblastoma samples could be divided into five sub-groups from cluster A to cluster E. These subtypes represented the pathway-level differences among the samples. According to the principal component analysis, we found that the first three components were able to separate all five subtypes from each other. We established three pathway modules containing 40 pathways as the annotation of each subtype by selecting the principal component loadings from the top three components (PC1, 2, and 3). Different from PC2, PC1 and PC3 modules both contained module A and module B. These results provided a novel classification system for glioblastoma and suggested that differences at the pathway-level were an important aspect of glioblastoma heterogeneity.
The G-CIMP and molecular signature subtypes were associated with this novel classification. G-CIMP positive samples were mainly enriched in cluster E and the average z-score of each pathway in this cluster was relatively small, which implied that the CpG island methylator phenotype influenced molecular expression pattern at the pathway level. On the other hand, the KEGG pathway enrichment based classification was also associated with the molecular signatures. These results implied that the transcriptomic and epigenetic profiles might affect pathway enrichment status of glioblastoma.
An important advantage of the molecular classification is to predict prognosis of glioblastoma. Although the classification based on signature gene expression did not reveal significant survival benefits by Verhaak, the analysis from Kim et al. distinguished three groups with different survival characteristics and showed that specific gene expression variations and CNAs had an important role in signaling pathways associated with gliomagenesis and the clinical outcomes of glioblastoma patients [21, 26]. On the other hand, CpG island methylator phenotype is also assocaited with the prognosis [28, 31, 32]. Noushmehr et al. suggested that patients with G-CIMP tumors were younger at the time of diagnosis and had relatively longer survival time [28]. Li et al. revealed a novel proneural/G-CIMP+ subtype with distinct molecular and clinical features [32]. Additionally, micro-RNA and long noncoding RNA expression patterns are also associated with prognosis[29, 30] In our study, with Kaplan-Meier survival analysis and Cox hazard proportion model, the novel subtypes based on the KEGG pathway enrichment were correlated with clinical outcomes of glioblastoma patients. Patients in cluster D & cluster E showed a better clinical prognosis in both overall survival time and progression-free survival time. Based on these findings, we suggest that KEGG pathway enrichment based classification is prognostic for glioblastoma patients.
Conclusion
In our study, we have shown that glioblastoma can be divided into five subtypes based on the signaling pathway enrichment status. This novel classification system provided new insights into the heterogeneity of glioblastoma, and may be used as an important clinical tool to predict the prognosis.
Supplementary Material
Supplementary figures.
Competing Interests
The authors have declared that no competing interest exists.
References
1. Fuller GN, Scheithauer BW. The 2007 Revised World Health Organization (WHO) Classification of Tumours of the Central Nervous System: newly codified entities. Brain pathology. 2007;17:304-7
2. Ostrom QT, Gittleman H, Fulop J, Liu M, Blanda R, Kromer C. et al. CBTRUS Statistical Report: Primary Brain and Central Nervous System Tumors Diagnosed in the United States in 2008-2012. Neuro-oncology. 2015;17(Suppl 4):iv1-iv62
3. Burger PC, Green SB. Patient age, histologic features, and length of survival in patients with glioblastoma multiforme. Cancer. 1987;59:1617-25
4. Eder K, Kalman B. Molecular heterogeneity of glioblastoma and its clinical relevance. Pathology oncology research: POR. 2014;20:777-87
5. Neapolitan R, Horvath CM, Jiang X. Pan-cancer analysis of TCGA data reveals notable signaling pathways. BMC cancer. 2015;15:516
6. Cerami E, Demir E, Schultz N, Taylor BS, Sander C. Automated network analysis identifies core pathways in glioblastoma. PloS one. 2010;5:e8918
7. Kanehisa M, Sato Y, Kawashima M, Furumichi M, Tanabe M. KEGG as a reference resource for gene and protein annotation. Nucleic acids research. 2016;44:D457-62
8. Kanehisa M, Goto S, Sato Y, Furumichi M, Tanabe M. KEGG for integration and interpretation of large-scale molecular data sets. Nucleic acids research. 2012;40:D109-14
9. Kanehisa M, Goto S. KEGG: kyoto encyclopedia of genes and genomes. Nucleic acids research. 2000;28:27-30
10. Ideker T, Galitski T, Hood L. A new approach to decoding life: systems biology. Annual review of genomics and human genetics. 2001;2:343-72
11. Gundem G, Lopez-Bigas N. Sample-level enrichment analysis unravels shared stress phenotypes among multiple cancer types. Genome medicine. 2012;4:28
12. Altschuler GM, Hofmann O, Kalatskaya I, Payne R, Ho Sui SJ, Saxena U. et al. Pathprinting: An integrative approach to understand the functional basis of disease. Genome medicine. 2013;5:68
13. Lopez-Bigas N, De S, Teichmann SA. Functional protein divergence in the evolution of Homo sapiens. Genome biology. 2008;9:R33
14. Ingles-Esteve J, Morales M, Dalmases A, Garcia-Carbonell R, Jene-Sanz A, Lopez-Bigas N. et al. Inhibition of specific NF-kappaB activity contributes to the tumor suppressor function of 14-3-3sigma in breast cancer. PloS one. 2012;7:e38347
15. Gonzalez-Perez A, Jene-Sanz A, Lopez-Bigas N. The mutational landscape of chromatin regulatory factors across 4,623 tumor samples. Genome biology. 2013;14:r106
16. Ferreira PG, Jares P, Rico D, Gomez-Lopez G, Martinez-Trillos A, Villamor N. et al. Transcriptome characterization by RNA sequencing identifies a major molecular and clinical subdivision in chronic lymphocytic leukemia. Genome research. 2014;24:212-26
17. Jene-Sanz A, Varaljai R, Vilkova AV, Khramtsova GF, Khramtsov AI, Olopade OI. et al. Expression of polycomb targets predicts breast cancer prognosis. Molecular and cellular biology. 2013;33:3951-61
18. Swift S, Tucker A, Vinciotti V, Martin N, Orengo C, Liu X. et al. Consensus clustering and functional interpretation of gene-expression data. Genome biology. 2004;5:R94
19. Monti S TP, Mesirov J, Golub TR. Consensus Clustering: A Resampling-Based Method for Class Discovery and Visualization of Gene Expression Microarray Data. Machine Learning. 2003;52:91-118
20. PJ. R. Silhouettes: A graphical aid to the interpretation and validation of cluster analysis. J Comput Appl Math. 1987;20:53-65
21. Verhaak RG, Hoadley KA, Purdom E, Wang V, Qi Y, Wilkerson MD. et al. Integrated genomic analysis identifies clinically relevant subtypes of glioblastoma characterized by abnormalities in PDGFRA, IDH1, EGFR, and NF1. Cancer cell. 2010;17:98-110
22. Bozdag S, Li A, Baysan M, Fine HA. Master regulators, regulatory networks, and pathways of glioblastoma subtypes. Cancer informatics. 2014;13:33-44
23. Freije WA, Castro-Vargas FE, Fang Z, Horvath S, Cloughesy T, Liau LM. et al. Gene expression profiling of gliomas strongly predicts survival. Cancer research. 2004;64:6503-10
24. Liang Y, Diehn M, Watson N, Bollen AW, Aldape KD, Nicholas MK. et al. Gene expression profiling reveals molecularly and clinically distinct subtypes of glioblastoma multiforme. Proceedings of the National Academy of Sciences of the United States of America. 2005;102:5814-9
25. Kong J CL, Wang F, Gutman DA, Gao J, Chisolm C, Sharma A, Pan T, Van Meir EG, Kurc TM. Integrative, multimodal analysis of glioblastoma using TCGA molecular data, pathology images, and clinical outcomes. Biomed Eng, IEEE Trans on. 2011;58:3469-74
26. Kim YW, Koul D, Kim SH, Lucio-Eterovic AK, Freire PR, Yao J. et al. Identification of prognostic gene signatures of glioblastoma: a study based on TCGA data analysis. Neuro-oncology. 2013;15:829-39
27. Doucette T, Rao G, Rao A, Shen L, Aldape K, Wei J. et al. Immune heterogeneity of glioblastoma subtypes: extrapolation from the cancer genome atlas. Cancer immunology research. 2013;1:112-22
28. Noushmehr H, Weisenberger DJ, Diefes K, Phillips HS, Pujara K, Berman BP. et al. Identification of a CpG island methylator phenotype that defines a distinct subgroup of glioma. Cancer cell. 2010;17:510-22
29. Li R, Gao K, Luo H, Wang X, Shi Y, Dong Q. et al. Identification of intrinsic subtype-specific prognostic microRNAs in primary glioblastoma. Journal of experimental & clinical cancer research: CR. 2014;33:9
30. Li R, Qian J, Wang YY, Zhang JX, You YP. Long noncoding RNA profiles reveal three molecular subtypes in glioma. CNS neuroscience & therapeutics. 2014;20:339-43
31. Baysan M, Bozdag S, Cam MC, Kotliarova S, Ahn S, Walling J. et al. G-cimp status prediction of glioblastoma samples using mRNA expression data. PloS one. 2012;7:e47839
32. Li B, Senbabaoglu Y, Peng W, Yang ML, Xu J, Li JZ. Genomic estimates of aneuploid content in glioblastoma multiforme and improved classification. Clinical cancer research: an official journal of the American Association for Cancer Research. 2012;18:5595-605
Author contact
![]() Corresponding author: Xuejun Li, Phone: +86 0731 89753035 Address: Department of Neurosurgery, Xiangya Hospital, Central South University, 87 Xiangya Road, Changsha, Hunan Province, 410008, China. Email: lxjneuroedu.cn.
Corresponding author: Xuejun Li, Phone: +86 0731 89753035 Address: Department of Neurosurgery, Xiangya Hospital, Central South University, 87 Xiangya Road, Changsha, Hunan Province, 410008, China. Email: lxjneuroedu.cn.
Citation styles
APA
Wanggou, S., Feng, C., Xie, Y., Ye, L., Wang, F., Li, X. (2016). Sample Level Enrichment Analysis of KEGG Pathways Identifies Clinically Relevant Subtypes of Glioblastoma. Journal of Cancer, 7(12), 1701-1710. https://doi.org/10.7150/jca.15486.
ACS
Wanggou, S.; Feng, C.; Xie, Y.; Ye, L.; Wang, F.; Li, X. Sample Level Enrichment Analysis of KEGG Pathways Identifies Clinically Relevant Subtypes of Glioblastoma. J. Cancer 2016, 7 (12), 1701-1710. DOI: 10.7150/jca.15486.
NLM
Wanggou S, Feng C, Xie Y, Ye L, Wang F, Li X. Sample Level Enrichment Analysis of KEGG Pathways Identifies Clinically Relevant Subtypes of Glioblastoma. J Cancer 2016; 7(12):1701-1710. doi:10.7150/jca.15486. https://www.jcancer.org/v07p1701.htm
CSE
Wanggou S, Feng C, Xie Y, Ye L, Wang F, Li X. 2016. Sample Level Enrichment Analysis of KEGG Pathways Identifies Clinically Relevant Subtypes of Glioblastoma. J Cancer. 7(12):1701-1710.
This is an open access article distributed under the terms of the Creative Commons Attribution (CC BY-NC) License. See http://ivyspring.com/terms for full terms and conditions.