Journal of Cancer
ISSN: 1837-9664
3.2
Impact Factor
ISSN: 1837-9664

 Global reach, higher impact
J Cancer 2018; 9(3):460-468. doi:10.7150/jca.22310 This issue Cite
Research Paper
MK2 and ETV1 Are Prognostic Factors in Esophageal Adenocarcinomas
Gerd Jomrich1, Florian Maroske1, Jasmin Stieger1, Matthias Preusser2, Aysegül Ilhan-Mutlu2, Daniel Winkler3, Ivan Kristo1, Matthias Paireder1, Sebastian Friedrich Schoppmann1 ![]()
1. Department of Surgery, Medical University of Vienna, and Gastroesophageal Tumor Unit, Comprehensive Cancer Center (CCC), Spitalgasse 23, 1090 Vienna, Austria
2. Department of Medicine 1, Medical University of Vienna, Vienna, Austria. Comprehensive Cancer Center (CCC), Spitalgasse 23, 1090 Vienna, Austria
3. Vienna University of Economics and Business, Welthandelsplatz 1, AD, 1020 Vienna, Austria
Received 2017-8-9; Accepted 2017-11-26; Published 2018-1-1
Citation:
Jomrich G, Maroske F, Stieger J, Preusser M, Ilhan-Mutlu A, Winkler D, Kristo I, Paireder M, Schoppmann SF. MK2 and ETV1 Are Prognostic Factors in Esophageal Adenocarcinomas. J Cancer 2018; 9(3):460-468. doi:10.7150/jca.22310. https://www.jcancer.org/v09p0460.htm
Other stylesAbstract
Background. Esophageal cancer is ranked in the top ten of diagnosed tumors worldwide. Even though improvements in survival could be noticed over the last years, prognosis remains poor. ETS translocation variant 1 (ETV1) is a member of a family of transcription factors and is phosphorylated by mitogen-activated protein kinase (MAPK)-activated protein kinase 2 (MK2). Aim of this study was to evaluate the prognostic role of MK2 and ETV1 in esophageal cancer.
Methods. Consecutive patients that underwent surgical resection at the department of surgery at the Medical University of Vienna between 1991 and 2012 were included into this study. After microscopic analysis, tissue micro arrays (TMAs) were created and immunohistochemistry was performed with antibodies against MK2 and ETV1.
Results. 323 patients were included in this study. Clinical data was achieved from a prospective patient data base. Nuclear overexpression of MK2 was observed in 143 (44.3%) cases for nuclear staining and in 142 (44.0%) cases a cytoplasmic overexpression of MK2 was observed. Nuclear and cytoplasmic ETV1 overexpression was detected in 20 cases (6.2%) and 30 cases (9.3%), respectively. In univariate survival analysis, cMK2 and nETV1 were found to be significantly associated with patients' overall survival. Whereas overexpression of cMK2 was associated with shorter, nETV1 was associated with longer overall survival. In multivariate survival analysis, both cMK2 and nETV1 were found to be independent prognostic factors for the subgroup of EAC as well.
Discussion. Expression of MK2 and ETV1 are prognostic factors in patients, with esophageal adenocarcinoma.
Keywords: Esophageal Adenocarcinoma, Mitogen-activated protein kinase (MAPK)-activated protein kinase 2 (MK2), ETS translocation variant 1 (ETV1)
Introduction
Even though improvements in diagnosis, surgical techniques and multimodal therapeutically approaches have led to significant improvement, prognosis for patients suffering from EC remain poor [1-3]. Therefore, it is important to investigate other, more effective molecular markers for the treatment of gastroesophageal cancers. The mitogen-activated protein kinase (MAPK)-activated protein kinase 2 (MK2) is an intracellular mediator of stress and is stimulated by signals such as heat-shock and tumor necrosis factor α (TNF-α) mediated by the p38-MAP kinase pathway [4, 5]. MK2 is an important intracellular mediator of stress signals such as inflammation. Due to its role in regulation of cytokines, MK2 emerged as a possible anti-inflammatory target. It's role in carcinogenesis has been examined in a number of malignancies, but no data exists on its role in esophageal cancer until now.
A variety of proteins are phosphorylated by MK2. Previously published data shows, that transcriptional activity (ETV1) can be stimulated by ERK-MAK kinases and ETV1 was identified as target of the protein kinase MK2 [6, 7].
Ets variant gene 1 (ETV1), also known as ER81, is a member of the E-twenty-six (ETS) family, one of the largest families of transcription factors and oncogenes. Beside its physiological functions it plays a major role in cell differentiation, is upregulated in a number of tumors and interact with many factors resulting in oncogenesis [8-11]. ETV1 has been found to cooperate with the p38 pathway and to promote tumor progression and metastasis in a number of human malignancies, upregulating matrix metalloproteinases (MMP) involved in tumor cell migration and invasion [6, 12, 13]. In prostate cancer, upregulation of MMP-7 (matrilysin) for example leads to an oncogenic effect of ETV1 [14, 15]. In melanoma genesis, a deregulation of ETV1 could be observed, implicating the pivotal lineage dependency mediated by ETS transcription factors [16].
Whereas the role of MK2 and ETV1 in gastrointestinal stromal tumors (GIST) were investigated intensively, little is known about the expression and the influence on survival of MK2 and ETV1 in gastroesophageal cancer [10, 17-19].
Material and Methods
Patients collective
This study was approved by the Ethics Committee of the Medical University of Vienna, Austria, and was conducted in accordance with the Declaration of Helsinki Principals. All patients included in this study underwent surgical resection of EC during the period from October 1991 to June 2012 at the Department of Surgery, Medical University of Vienna. All tumors were restaged according to the UICC 7th edition TNM classification. Patients showing complete respond to neoadjuvant therapy (complete responders) and patients with distant metastasis at time of surgery were excluded from this study.
Formalin-fixed, paraffin-embedded tissue blocks were established. Per case, two tissue cylinders with a 2.0 mm diameter were punched from representative tissue areas. Histological types were confirmed by experienced pathologists (Figure 1). The TMA contained well-documented clinico-pathological data, including patients' age, sex, tumor location, tumor differentiation, TNM staging and follow-up data.
Immunohistochemistry
Immunohistochemistry (IHC) was performed on paraffin-embedded specimens fixed in 4% buffered formalin, using 3µm thick histological sections. MK2 expression was detected by using an anti-human MAPKAPK-2 rabbit polyclonal antibody (ab63574 Cambridge, UK) in a dilution of 1:200. ETV1 expression was detected by using a polyclonal rabbit anti-ER81 antibody (ab81086, Abcam, Cambridge, UK) in a dilution of 1:200. This antibody is active against a synthetic peptide, interacting with the C-end of the protein. In case of a gene translocation (hypothysing, that ER81 has a 5' fusion-partner [20]) this antibody is able to detect an overexpression caused by these protein products. Staining was performed on a Benchmark Ultra Immunostainer (Roche Diagnostics, Basel, Switzerland). Immunohistochemistry for MK2 and ETV1 were validated as described previously [17, 18, 21, 22]. Two observers (S.F.S. and M.F.) independently reviewed all slides. Immunostaining scores of MK2 and ETV1 (IHC score 0-300) were calculated as the semi quantitative products of the staining intensity (1 = weak, 2 = moderate or 3 = strong) and the rates of staining were given in percentages of tumor cells showing positive staining (0-100%). Tumors showing expression equal or below the median were considered as low or absent as described previously [23]. Analyzing the specimens, between cytoplasmic and nuclear staining intensity was discriminated. A tumor specimen was considered as positive for the expression of MK2 and ETV1, when >90% of tumor cells showed cytoplasmic staining.
Statistics
Overall survival (OS) was defined as the time between primary surgery and the patients' death. Death from cause other than gastric, gastroesophageal or esophageal cancer or survival until the end of the observation period was considered as censored observations. Disease free survival (DFS) was defined from the day of primary surgery until the first evidence of disease progression. The significance of differences in survival times were determined with a log-rank test. Uni- and multivariate analyses were performed with Cox proportional hazards models. Correlations between clinicopathological parameters and MK2 expression and ETV1 expression levels were analyzed with the χ2. A two-tailed Mann-Whitney U test was used as appropriate (to determine differences in continuous variables between the groups. i.e. in OS, DFS and age). p-values ≤0.05 were considered as significant. Statistical analysis was performed with the R statistical package [24, 25].
Figure 1
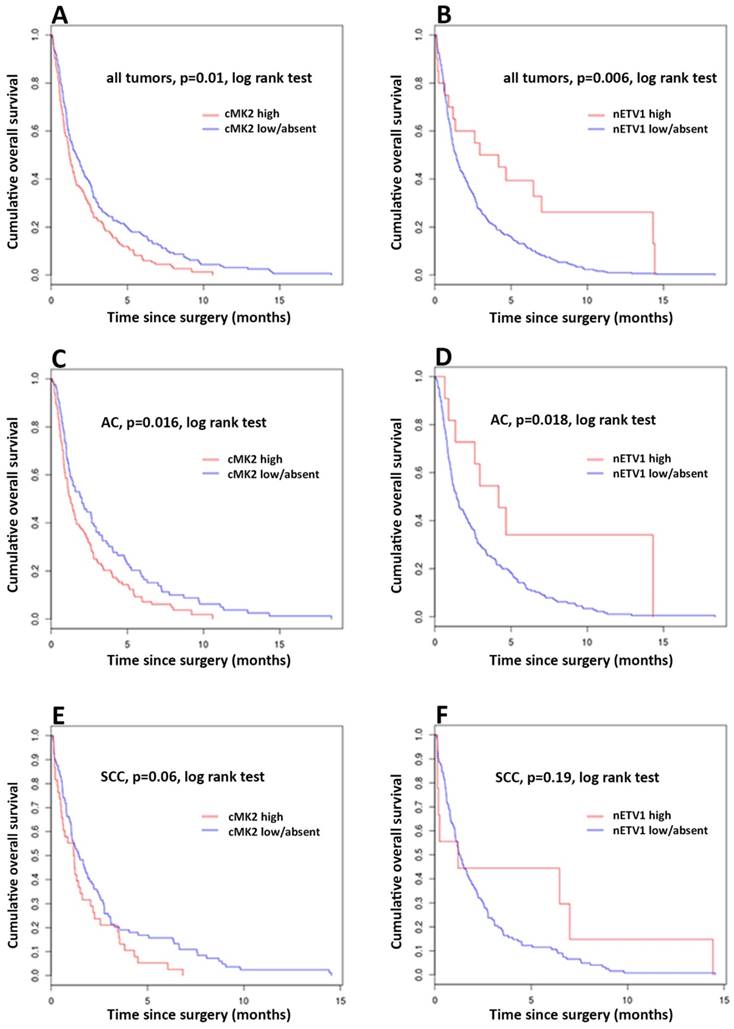
Kaplan-Meier curves of survival of esophageal cancer patients with cMK2 overexpression (high) compared with those with low/absent cMK2 expression. (A) Overall survival (OS) of all patients. (C) OS of patients with adenocarcinoma (AC). (E) OS of patients with squamous cell carcinoma (SCC). Kaplan-Meier curves of survival of esophageal cancer patients with nETV1 overexpression (high) compared with those with low/absent nETV1 expression. (B) OS of all patients. (D) OS of patients with AC. (F) OS of patients with SCC.
Results
Finally, 323 patients were included in this study. The majority of patients 248 (77.8%) were male and the mean age at time of surgery was 65.8 (±10.6) years (standard deviation). 192 (59.4%) cases were adenocarcinomas (AC) and 131 (40.6%) squamous cell carcinomas (SCC). Seventy-three (22.6%) patients underwent neoadjuvant therapy (NT).
After restaging all cases according to the UICC 7th edition TNM classification, the majority of carcinomas were staged as (y)pT3 (170 cases, 52.6%), followed by stage (y)pT2 (80 cases, 24.8%), (y)pT1 (58 cases, 17.9%) and (y)pT4 (15 cases, 4.7%). Beside the histological verified carcinomas, 19 cases of high-grade-dysplasia (HGD) were included into this study. 4 cases of HGD (21.1%) showed overexpression of cETV1, and in 6 cases of HGD (46.2%) we found cMK2 overexpressed (6 cases of HGD were not available for analysis due to technical problems). The majority of cases showed (y)N0 stage (111 cases, 34.4%). 91 cases (28.2%) were staged as (y)N1, 61 cases (18.9%) as (y)N2 and 60 cases (18.5%) as (y)N3. 167 (51.7%) of patients received adjuvant chemotherapy. Details for clinicopathological characteristics are shown in Table 1.
Staining for MK2 was performed in 314 cases. Overexpression was observed in 143 (44.3%) cases for nuclear staining and in 142 (44.0%) cases of cytoplasmic staining. Due to technical problems, in 9 (2.7%) cases no staining for nuclear and cytoplasmic MK2 expression was possible.
Staining for ETV1 expression, was performed in 323 cases. The majority of cases showed absent or low nuclear staining (303 cases, 87.2%), 20 cases (6.2%) were considered as positive. Analyzing the cytoplasmic staining intensity, 293 cases (90.7%) showed absent or low expression and 30 cases (9.3%) positive result.
Detailed information on nuclear and cytoplasmic MK2 and ETV1 staining results are shown in Table 2.
Table 1
Association of cMK2 expression and nETV1 expression with clinicopathologic parameters in patients with esophageal cancer.
| Factors | All (n=323) | cMK2 (n=314) | nETV1 (n=323) | ||||||||||||
|---|---|---|---|---|---|---|---|---|---|---|---|---|---|---|---|
| (%) | high | (%) | low/absent | (%) | p-value | high | (%) | low/absent | (%) | p-value | |||||
| Age (SD) | 65.8 | (10.6) | 65.3 (10.6) | 66.0 (10.8) | >0.05 | 63.7 (11.1) | 66.0 (10.6) | >0.05 | |||||||
| Sex | >0.05 | >0.05 | |||||||||||||
| Male | 248 | (76.8) | 115 | (36.6) | 126 | (40.1) | 16 | (5.0) | 232 | (71.8) | |||||
| Female | 75 | (23.2) | 27 | (8.6) | 46 | (14.6) | 4 | (1.2) | 71 | (22.0) | |||||
| Tumor Type | <0.001 | >0.05 | |||||||||||||
| AC | 192 | (59.4) | 104 | (33.1) | 83 | (26.4) | 11 | (3.4) | 181 | (56.0) | |||||
| SCC | 131 | (40.6) | 38 | (12.1) | 89 | (28.3) | 9 | (2.8) | 122 | (37.8) | |||||
| (y)pT | 0.009 | <0.001 | |||||||||||||
| 1 | 58 | (17.9) | 32 | (10.2) | 21 | (6.7) | 13 | (4.0) | 45 | (13.9) | |||||
| 2 | 80 | (24.8) | 24 | (7.6) | 54 | (17.2) | 2 | (0.6) | 78 | (24.1) | |||||
| 3 | 170 | (52.6) | 80 | (25.5) | 88 | (28.0) | 5 | (1.5) | 165 | (51.1) | |||||
| 4 | 15 | (4.7) | 6 | (1.9) | 9 | (2.9) | 0 | (0.0) | 15 | (4.6) | |||||
| (y)pN | 0.009 | 0.002 | |||||||||||||
| 0 | 111 | (34.4) | 38 | (12.1) | 66 | (21.0) | 14 | (4.3) | 97 | (30.0) | |||||
| 1 | 91 | (28.2) | 38 | (12.1) | 52 | (16.6) | 6 | (1.9) | 85 | (26.3) | |||||
| 2 | 61 | (18.9) | 28 | (8.9) | 32 | (10.2) | 0 | (0.0) | 61 | (18.9) | |||||
| 3 | 60 | (18.5) | 38 | (12.1) | 22 | (7.0) | 0 | (0.0) | 60 | (18.6) | |||||
| (y)G | 0.04 | 0.01 | |||||||||||||
| 1 | 18 | (5.6) | 6 | (1.9) | 11 | (3.5) | 4 | (1.2) | 14 | (4.3) | |||||
| 2 | 175 | (54.2) | 67 | (21.3) | 101 | (32.2) | 11 | (3.4) | 164 | (50.8) | |||||
| 3 | 130 | (40.2) | 69 | (21.9) | 60 | (19.1) | 5 | (1.5) | 125 | (38.7) | |||||
| R | >0.05 | >0.05 | |||||||||||||
| 0 | 282 | (87.3) | 127 | (40.4) | 148 | (47.1) | 18 | (5.6) | 264 | (81.7) | |||||
| 1 | 41 | (12.7) | 15 | (4.8) | 24 | (7.6) | 2 | (0.6) | 39 | (12.1) | |||||
| UICC Staging | 0.02 | <0.001 | |||||||||||||
| I | 73 | (22.6) | 26 | (8.3) | 41 | (13.1) | 12 | (3.7) | 61 | (18.9) | |||||
| II | 71 | (21.9) | 28 | (8.9) | 42 | (13.4) | 5 | (1.5) | 66 | (20.4) | |||||
| III | 179 | (55.5) | 88 | (28.0) | 89 | (28.3) | 3 | (0.9) | 176 | (54.5) | |||||
| NT | 0.04 | >0.05 | |||||||||||||
| yes | 73 | (22.6) | 40 | (12.7) | 31 | (9.9) | 5 | (1.5) | 68 | (21.1) | |||||
| no | 250 | (77.4) | 102 | (32.5) | 141 | (44.9) | 15 | (4.6) | 235 | (72.8) | |||||
| Adjuvant Treatment | >0.05 | 0.03 | |||||||||||||
| yes | 156 | (48.3) | 73 | (23.2) | 80 | (25.5) | 5 | (1.5) | 151 | (46.7) | |||||
| no | 167 | (51.7) | 69 | (22.0) | 92 | (29.3) | 15 | (4.6) | 152 | (47.1) | |||||
cMK2 = cytoplasmic (MAPK)-activated protein kinase 2; nETV1 nuclear of Ets variant gene 1; SD = standard deviation; AC = adenocarcinomas; SCC = squamous cell carcinomas; R = resection margin; UICC = Union for International Cancer Control; NT = neoadjuvant therapy; AT = adjuvant therapy
Table 2
Contribution of nETV1, cETV1, nMK2 and cMK2 expression.
| ETV1 | MK2 | ||||||||
|---|---|---|---|---|---|---|---|---|---|
| nETV1 | (%) | cETV1 | (%) | nMK2 | (%) | cMK2 | (%) | ||
| All | High | 20 | (6.2) | 30 | (9.3) | 143 | (44.3) | 142 | (44.0) |
| Low/Absent | 303 | (93.8) | 293 | (90.7) | 171 | (53.0) | 172 | (53.3) | |
| NA | 0 | (0.0) | 0 | (0.0) | 9 | (2.7) | 9 | (2.7) | |
| AC | High | 11 | (5.7) | 25 | (13.0) | 65 | (33.8) | 104 | (54.2) |
| Low/Absent | 181 | (49.3) | 167 | (87.0) | 122 | (63.5) | 83 | (43.2) | |
| NA | 0 | (0.0) | 0 | (0.0) | 5 | (2.7) | 5 | (2.6) | |
| SCC | High | 9 | (6.9) | 5 | (3.8) | 78 | (59.6) | 38 | (29.1) |
| Low/Absent | 122 | (93.1) | 126 | (96.2) | 49 | (37.4) | 89 | (67.9) | |
| NA | 0 | (0.0) | 0 | (0.0) | 4 | (3.0) | 4 | (3.0) | |
nETV1 = nuclear Ets variant gene 1; cETV1 = cytoplasmic Ets variant gene 1; nMK2 = nuclear (MAPK)-activated protein kinase 2; cMK2 =cytoplasmic (MAPK)-activated protein kinase 2; AC = adenocarcinomas; SCC = squamous cell carcinomas.
Significant association of cMK2 overexpression could be found for tumor staging (p<0.01), lymphnode status (p<0.01), UICC staging (p=0.02), tumor differentiation (p=0.04), neoadjuvant therapy (p=0.04), and tumor type (p<0.01). Evaluating nETV1, significant correlation was observed for tumor staging (p<0.01), lymphnode status (p<0.01), UICC staging (p<0.01), tumor type (p<0.01) and adjuvant therapy (p=0.03) (all Pearson's Chi-square test) - Table 1.
Analyzing the distribution of nETV1 overexpressing cases, we found, that nETV1 overexpression is significantly associated with a lower tumor stage (pT1: 13 (65%) cases; pT2: 2 (10%) cases; pT3: 5 (25%) cases; p<0.001).
Univariate Survival Analysis
Overall Survival - All Patients
Evaluating the expression status of cMK2, nMK2, cETV1 and nETV1 for association with OS, the log-rank test was used to determine statistical significance. Kaplan-Meier analysis shows a significant correlation between high cMK2 expression and reduced patients' survival. Patients with high expression of cMK2 showed a significantly lower (median = 14.5, mean = 24.9 months), while patients with low or absent cMK2 levels had longer OS (median = 20, mean = 35.35 months), p= 0.00949 log-rank test (= Mantel-Haenszel test). Patients with high cMK2 expression had a 5 years OS at of 11.27% compared with 19.19% for patients with low or absent cMK2. No significant correlation of levels of nMK2 expression and OS were found. Analyzing expression levels of nETV1 and cETV1, Kaplan-Meier analysis demonstrated a significant correlation with high nETV1 expression and improved patients' OS. Patients with high nETV1 levels showed significantly better OS (median = 42.82, mean = 53.5 months), p= 0.00507 log-rank test, while patients with low or absent nETV1 expression had a shorter OS (median = 16.89, mean = 30 months). Patients with high nETV1 expression had an OS at 5 years of 35% compared with 15.5% for patients with low or absent nETV1 (Figure X). No significant correlation of cETV1 and OS could be found. Data for univariate analysis, using Cox proportional hazards model, is shown in Table 3.
Disease Free Survival - All Patients
The expression status of cMK2, nMK2, cETV1 and nETV1 was also evaluated for association with DFS. No significance regarding DFS could be observed.
Overall Survival - Subgroup AC
In subgroup analysis of patients with AC, cases with high expression of cMK2 showed a significantly lower OS (median = 15.31, mean = 26.64 months), while patients with low or absent cMK2 levels had longer OS (median = 24.24, mean = 40 months), p=0.0156 log-rank test. Patients with high cMK2 expression had an OS at 5 years of 13.5% compared with 21.69% for patients with low or absent cMK2 (Figure X). Evaluating the expression of ETV1 in AC, patients with high nETV1 levels showed significantly better OS (median = 50.26, mean = 57.97 months) while patients with low or absent nETV1 expression had a shorter OS (median = 17.15, mean 32.17 months). Log-rank p=0.015. Patients with high nETV1 expression had an OS at 5 years of 27.27% compared with 17.68% for patients with low or absent nETV1 (Figure X). No significant correlation of nMK2 and cETV1 and OS in the subgroup of AC could be found.
Disease Free Survival - Subgroup AC
No significance regarding DFS could be observed in the subgroup of AC patients.
Overall Survival - Subgroup SCC
With p=0.06 for cMK2 and cETV1, respectively, statistical trends, but no statistical significance regarding OS could be observed in the subgroup of SCC (Figure X).
Disease Free Survival - Subgroup SCC
No significance regarding DFS could be observed in the subgroup of SCC patients.
Multivariate Survival Analysis
Using the Cox proportional hazards model for multivariable analysis was carried out to assess the prognostic value of cMK2 and nETV1 expression for both OS and DFS (Table 3 and 4). The following prognostic variables were included in the regression model: age, sex, UICC stage, tumor differentiation, resection margin, neoadjuvant- and adjuvant therapy.
Overall Survival
In multivariate analysis of AC tumors, high cMK2 expression was an independent negative prognostic factor for OS (p=0.04; RR 1.38, 1.01-1.89) (Table 3). Evaluating nETV1 expression in AC tumors with multivariate analysis, a nearly significant (p=0.05; RR 0.47, 0.22-1.00) decrease of 53% in risk in OS for patients with high nETV1 expression could be found (Table 4).
Table 3
Univariate Cox regression analyses estimating the influence of cMK2 and nETV1 and clinicopathologic parameters on overall survival (OS) and disease free survival (DFS).
| p-value univariate | RR | 95% CI | p-value univariate | RR | 95% CI | |||||
|---|---|---|---|---|---|---|---|---|---|---|
| Overall Survival | Disease Free Survival | |||||||||
| All | All | |||||||||
| cMK2 | 0.01 | 1.352 | 1.08 - 1.70 | cMK2 | 0.076 | 1.23 | 0.98 - 1.55 | |||
| nETV1 | 0.006 | 0.491 | 0.30 - 0.82 | nETV1 | 0.091 | 0.662 | 0.41 - 1.07 | |||
| (y)pT | < 0.001 | 1.484 | 1.23 - 1.70 | (y)pT | < 0.001 | 1.411 | 1.23 - 1.62 | |||
| (y)pN | < 0.001 | 1.336 | 1.21 - 1.48 | (y)pN | < 0.001 | 1.361 | 1.23 - 1.51 | |||
| UICC Staging | < 0.001 | 1.903 | 1.45 - 2.49 | UICC Staging | < 0.001 | 1.739 | 1.33 - 2.28 | |||
| (y)pG | < 0.001 | 1.402 | 1.17 - 1.69 | (y)pG | 0.002 | 1.336 | 1.11 - 1.61 | |||
| R | 0.92 | 1.017 | 0.73 - 1.42 | R | 0.579 | 1.1 | 0.79 - 1.54 | |||
| Age | < 0.001 | 0.976 | 0.97 - 0.99 | Age | < 0.001 | 0.975 | 0.97 - 0.99 | |||
| Sex | 0.0518 | 0.765 | 0.58 - 1.00 | Sex | 0.208 | 0.841 | 0.64 - 1.10 | |||
| NT | < 0.001 | 1.714 | 1.30 - 2.25 | NT | < 0.001 | 1.77 | 1.35 - 2.33 | |||
| AT | < 0.001 | 0.623 | 0.50 - 0.78 | AT | < 0.001 | 0.66 | 0.53 - 0.83 | |||
| AC | AC | |||||||||
| cMK2 | 0.016 | 1.445 | 1.07 - 1.95 | cMK2 | 0.125 | 1.261 | 0.94 - 1.70 | |||
| nETV1 | 0.018 | 0.423 | 0.21 - 0.86 | nETV1 | 0.102 | 0.571 | 0.29 - 1.12 | |||
| (y)pT | < 0.001 | 1.579 | 1.31 - 1.91 | (y)pT | < 0.001 | 1.575 | 1.30 - 1.91 | |||
| (y)pN | < 0.001 | 1.389 | 1.22 - 1.58 | (y)pN | < 0.001 | 1.384 | 1.21 - 1.60 | |||
| UICC Staging | < 0.001 | 1.927 | 1.36 - 2.73 | UICC Staging | < 0.001 | 1.828 | 1.29 - 2.60 | |||
| (y)pG | < 0.001 | 1.566 | 1.20 - 2.04 | (y)pG | 0.002 | 1.508 | 1.16 - 1.96 | |||
| R | 0.699 | 1.092 | 0.70 - 1.71 | R | 0.435 | 1.196 | 0.76 - 1.88 | |||
| Age | 0.001 | 0.979 | 0.97 - 0.99 | Age | < 0.001 | 0.976 | 0.96 - 0.99 | |||
| Sex | 0.532 | 0.887 | 0.61 - 1.29 | Sex | 0.713 | 0.932 | 0.64 - 1.36 | |||
| NT | < 0.001 | 1.812 | 1.27 - 2.58 | NT | < 0.001 | 2.087 | 1.46 - 2.98 | |||
| AT | 0.008 | 0.676 | 0.51 - 0.90 | AT | 0.032 | 0.728 | 0.54 - 0.97 | |||
| SCC | SCC | |||||||||
| cMK2 | 0.064 | 1.447 | 0.98 - 2.14 | cMK2 | 0.06 | 1.44 | 0.98 - 2.12 | |||
| nETV1 | 0.199 | 0.621 | 0.30 - 1.29 | nETV1 | 0.437 | 0.76 | 0.38 - 1.52 | |||
| (y)pT | 0.002 | 1.3 | 1.12 - 1.66 | (y)pT | 0.029 | 1.241 | 1.02 - 1.51 | |||
| (y)pN | < 0.001 | 1.366 | 1.14 - 1.64 | (y)pN | < 0.001 | 1.518 | 1.25 - 1.85 | |||
| UICC Staging | 0.005 | 1.831 | 1.20 - 2.80 | UICC Staging | 0.0256 | 1.62 | 1.06 - 2.48 | |||
| (y)pG | 0.01 | 1.474 | 1.09 - 1.99 | (y)pG | 0.03 | 1.386 | 1.03 - 1.86 | |||
| R | 0.652 | 0.888 | 0.53 - 1.49 | R | 0.883 | 0.96 | 0.57 - 1.63 | |||
| Age | 0.002 | 0.973 | 0.96 - 0.99 | Age | 0.006 | 0.976 | 0.96 - 0.99 | |||
| Sex | 0.022 | 0.631 | 0.43 - 0.93 | Sex | 0.052 | 0.674 | 0.45 - 1.00 | |||
| NT | 0.036 | 1.6 | 1.03 - 2.48 | NT | 0.079 | 1.488 | 0.96 - 2.32 | |||
| AT | < 0.001 | 0.495 | 0.34 - 0.71 | AT | < 0.001 | 0.474 | 0.33 - 0.69 |
RR = relative risk; CI = confidence interval; cMK2 = cytoplasmic (MAPK)-activated protein kinase 2; nETV1 nuclear of Ets variant gene 1; AC = adenocarcinomas; SCC = squamous cell carcinomas; R = resection margin; UICC = Union for International Cancer Control; NT = neoadjuvant therapy; AT = adjuvant therapy
Table 4
Multivariate Cox regression analyses estimating the influence of cMK2 and nETV1 and clinicopathologic parameters on overall survival (OS) and disease free survival (DFS).
| p-value multivariate | RR | 95% CI | p-value multivariate | RR | 95% CI | |||||
|---|---|---|---|---|---|---|---|---|---|---|
| Overall Survival | ||||||||||
| All | ||||||||||
| cMK2 | 0.16 | 1.187 | 0.93 - 1.51 | nETV1 | 0.091 | 0.625 | 0.36 - 1.08 | |||
| UICC Staging | 0.02 | 1.443 | 1.05 - 1.98 | UICC Staging | 0.056 | 1.365 | 0.99 - 1.88 | |||
| (y)pG | 0.07 | 1.201 | 0.98 - 1.47 | (y)pG | 0.09 | 1.187 | 0.97 - 1.45 | |||
| R | 0.81 | 1.044 | 0.73 - 1.48 | R | 0.588 | 1.098 | 0.78 - 1.54 | |||
| Age | <0.001 | 0.981 | 0.97 - 0.99 | Age | <0.001 | 0.979 | 0.97 - 0.99 | |||
| Sex | 0.35 | 0.874 | 0.66 -1.16 | Sex | 0.387 | 0.885 | 0.67 - 1.17 | |||
| NT | 0.04 | 1.352 | 1.01 - 1.81 | NT | 0.005 | 1.491 | 1.13 - 1.97 | |||
| AT | 0.08 | 0.793 | 0.61 - 1.02 | AT | 0.089 | 0.803 | 0.62 - 1.03 | |||
| AC | ||||||||||
| cMK2 | 0.043 | 1.381 | 1.01 - 1.89 | nETV1 | 0.053 | 0.467 | 0.22 - 1.01 | |||
| UICC Staging | 0.087 | 1.460 | 0.95 - 2.25 | UICC Staging | 0.218 | 1.31 | 0.85 - 2.01 | |||
| (y)pG | 0.058 | 1.324 | 0.99 - 1.77 | (y)pG | 1.267 | 0.107 | 0.95 - 1.69 | |||
| R | 0.891 | 1.033 | 0.65 - 1.65 | R | 0.487 | 1.179 | 0.74 - 1.88 | |||
| Age | 0.103 | 0.988 | 0.97 - 1.00 | Age | 0.025 | 0.984 | 0.97 - 1.00 | |||
| Sex | 0.769 | 1.062 | 0.71 - 1.57 | Sex | 0.972 | 0.888 | 0.66 - 1.44 | |||
| NT | 0.034 | 1.498 | 1.03 - 2.18 | NT | 1.626 | 0.01 | 1.12 - 2.36 | |||
| AT | 0.341 | 0.848 | 0.60 -1.19 | AT | 0.888 | 0.488 | 0.64 - 1.24 | |||
| SCC | ||||||||||
| cMK2 | 0.336 | 1.238 | 0.80 - 1.91 | nETV1 | 0.628 | 1.228 | 0.54 - 2.82 | |||
| UICC Staging | 0.526 | 1.177 | 0.71 - 1.95 | UICC Staging | 0.283 | 1.334 | 0.788 - 2.26 | |||
| (y)pG | 0.05 | 1.402 | 0.99 - 1.98 | (y)pG | 0.041 | 1.431 | 1.02 - 2.02 | |||
| R | 0.488 | 1.223 | 0.69 - 2.16 | R | 0.476 | 1.225 | 0.70 - 2.14 | |||
| Age | 0.01 | 0.975 | 0.96 - 0.99 | Age | 0.009 | 0.976 | 0.96 - 0.99 | |||
| Sex | 0.06 | 0.671 | 0.44 - 1.02 | Sex | 0.15 | 0.742 | 0.49 - 1.11 | |||
| NT | 0.725 | 1.097 | 0.66 - 1.83 | NT | 0.188 | 1.359 | 0.86 - 2.14 | |||
| AT | 0.016 | 0.599 | 0.39 - 0.91 | AT | 0.011 | 0.584 | 0.39 - 0.89 | |||
| Disease Free Survival | ||||||||||
| All | ||||||||||
| cMK2 | 0.755 | 1.04 | 0.81 - 1.33 | nETV1 | 0.464 | 0.826 | 0.49 - 1.39 | |||
| UICC Staging | 0.071 | 1.34 | 0.98 - 1.84 | UICC Staging | 0.084 | 1.329 | 0.96 - 1.84 | |||
| (y)pG | 0.084 | 1.20 | 0.98 - 1.47 | (y)pG | 0.099 | 1.184 | 0.97 - 1.45 | |||
| R | 0.615 | 1.094 | 0.91 - 1.55 | R | 0.38 | 1.17 | 0.83 - 1.64 | |||
| Age | < 0.001 | 0.98 | 0.97 - 0.99 | Age | <0.001 | 0.979 | 0.97 - 0.99 | |||
| Sex | 0.752 | 0.955 | 0.72 - 1.27 | Sex | 0.945 | 0.99 | 0.75 - 1.31 | |||
| NT | 0.016 | 1.435 | 1.07 - 1.93 | NT | 0.004 | 1.515 | 1.14 - 2.00 | |||
| AT | 0.084 | 0.80 | 0.61 - 1.03 | AT | 0.11 | 0.812 | 0.63 - 1.05 | |||
| AC | ||||||||||
| cMK2 | 0.403 | 1.145 | 0.83 - 1.57 | nETV1 | 0.216 | 0.637 | 0.31 - 1.30 | |||
| UICC Staging | 0.067 | 1.503 | 0.97 - 2.33 | UICC Staging | 0.144 | 1.38 | 0.90 - 2.12 | |||
| (y)pG | 0.092 | 1.282 | 0.96 - 1.71 | (y)pG | 0.138 | 1.244 | 0.93 - 1.66 | |||
| R | 0.82 | 1.056 | 0.66 - 1.70 | R | 0.494 | 1.176 | 0.74 - 1.87 | |||
| Age | 0.02 | 0.983 | 0.97 - 0.99 | Age | 0.006 | 0.981 | 0.97 - 0.99 | |||
| Sex | 0.70 | 1.082 | 0.73 - 1.61 | Sex | 0.858 | 1.036 | 0.70 - 1.53 | |||
| NT | 0.004 | 1.754 | 1.20 - 2.60 | NT | 0.002 | 1.846 | 1.27 - 2.70 | |||
| AT | 0.488 | 0.887 | 0.63 - 1.24 | AT | 0.597 | 0.914 | 0.65 - 1.28 | |||
| SCC | ||||||||||
| cMK2 | 0.297 | 1.267 | 0.81 - 1.98 | nETV1 | 0.406 | 1.406 | 0.63 - 3.14 | |||
| UICC Staging | 0.793 | 0.932 | 0.55 - 1.57 | UICC Staging | 0.649 | 1.135 | 0.66 - 1.96 | |||
| (y)pG | 0.072 | 1.364 | 0.97 - 1.91 | (y)pG | 0.044 | 1.419 | 1.01 - 1.99 | |||
| R | 0.228 | 1.443 | 0.80 - 2.62 | R | 0.17 | 1.506 | 0.84 - 2.70 | |||
| Age | 0.02 | 0.977 | 0.96 - 0.99 | Age | 0.018 | 0.978 | 0.96 - 1.00 | |||
| Sex | 0.101 | 0.70 | 0.45 - 1.07 | Sex | 0.235 | 0.775 | 0.51 - 1.18 | |||
| NT | 0.684 | 0.895 | 0.52 - 1.53 | NT | 0.609 | 1.129 | 0.71 - 1.80 | |||
| AT | 0.004 | 0.53 | 0.34 - 0.82 | AT | 0.004 | 0.533 | 0.35 - 0.82 | |||
RR = relative risk; CI = confidence interval; cMK2 = cytoplasmic (MAPK)-activated protein kinase 2; nETV1 nuclear of Ets variant gene 1; AC = adenocarcinoma; SCC = squamous cell carcinomas; R = resection margin; UICC = Union for International Cancer Control; NT = neoadjuvant therapy; AT = adjuvant therapy
No significant correlation of cMK2, nMK2, cETV1 and nETV1 and OS in the groups of all and SCC patients could be found.
Disease Free Survival - All Patients, AC and SCC Patients
No significance regarding DFS could be observed for cMK2, nMK2, cETV1 and nETV1 in the groups of all, AC and SCC patients.
Discussion
Beside recent improvements in multimodal treatment modalities, prognosis for patients with esophageal cancer remain poor. In this study, IHC was performed to investigate the clinical relevance of MK2 and ETV1 in esophageal cancer patients. We demonstrated that overexpression of cMK2 in AEC is associated with significantly poorer OS and that overexpression of nETV1 in EAC is associated with significantly better OS.
Yamamoto et al. could show an expression of ETV1 in 61% of cases of gastric cancer. Furthermore, ETV1 correlated significantly with patients' survival, tumor staging, lymphnode status und metastasis. The focus of that study was on the connection between the expression of matrix metalloproteinases (MMP7) and ETV4/PEA3, explaining the strong tendency to tumor invasion and metastasis [26].
In this underlying study we found cytoplasmic overexpression of MK2 in 44.0% and nuclear overexpression in 44.3% of all cases. Cytoplasmic and nuclear expression of ETV1 was found in only 9.3% and 6.2% of cases, respectively. Our data go in good accordance with the in-vivo and in-vitro findings from Jahnknecht R., describing MK2 and its suppressive effect on ETV1 [6].
Overexpression of cMK2 correlated with tumor type, higher tumor stage, positive lymph node status and tumor differentiation. For nETV1 we found significant correlation with tumor staging, lymphnode status, UICC staging, tumor type and adjuvant therapy. Furthermore, supporting our hypothesis, that ETV1 is strongly suppressed by MK2 in higher tumor stages, we found, that nETV1 overexpression is significantly associated with a lower tumor stage in our patients' collective.
Keld et al. examined the expression of ETV1 in EAC, not discriminating between cytoplasmic and nuclear expression, and found higher expression in EAC samples than in normal tissue and an association with metastatic disease [19].
In contrast, we found cytoplasmic and nuclear overexpression of ETV1 in only 13.0% and 5.7% of EAC patients, respectively. Even more surprising, patients in our study seem to benefit from nuclear overexpression of ETV1, showing a significantly better overall survival than patients without ETV1 overexpression. In the same subgroup of patients (EAC) we observed a significantly impaired overall survival of patients with cytoplasmic overexpressing of MK2. These findings might be supported by data from Jahnknecht R., reporting a suppressive effect in the expression of ETV1, as well [6].
One of the main reasons for the development of EAC is gastroesophageal reflux disease (GERD). EAC typically develops in intestinal metaplasia (Barretts' disease) caused by constant inflammation due to the washback of stomach content into the esophagus. Based on that constant, local inflammation and later due to inflammatory tumor response, upregulated and overexpressed MK2 might lead to downregulation of ETV1. This hypothesis is supported by our findings, that ETV1 overexpression correlates with a lower tumor stage, is frequently found in high-grade dysplasia and is therefore significantly associated with an increased overall survival.
Investigating the role of ETV1 in ESCC, the recently published study from Yuen et al. found no significantly difference between non-tumor esophageal epithelium and ESCC specimens. Furthermore, Yuen et al. described no overexpression of ETV1 and no positive correlation between ETV1 and clinicopathological parameters in their study [10]. These findings go in good accordance with our data, due to no correlation of cytoplasmic or nuclear ETV1 overexpression and clinical parameters could be observed as well. Furthermore, our data on expression of ETV1 in ESCC support our hypothesis, that the suppressing effect of MK2 on ETV1, based on inflammation is relevant in EAC, but not in ESCC.
Conclusion
The oncogenic potential of ETV1 is proven for a number of malignancies [12, 16, 17, 27]. Based on the data from Keld et al. and Yuen et al. the knowledge about the oncogenic role of ETV1 in esophageal cancer is limited. Even though interactions due to structural similarities with PEA3 and other related ETS family members could be shown, impact on patients and details of biological mechanisms are not fully understood yet. Until now, only few data exist on the clinical role of ETV1 in patients suffering from esophageal cancer.
In this study, multivariate analysis has shown that the overexpression of cMK2 and nETV1 are independent prognostic factors.
The observations of this study underline the importance of further investigations in the field of the ETV family and its role in the MAPKinase pathway as a potential therapeutic onset.
Figure 2
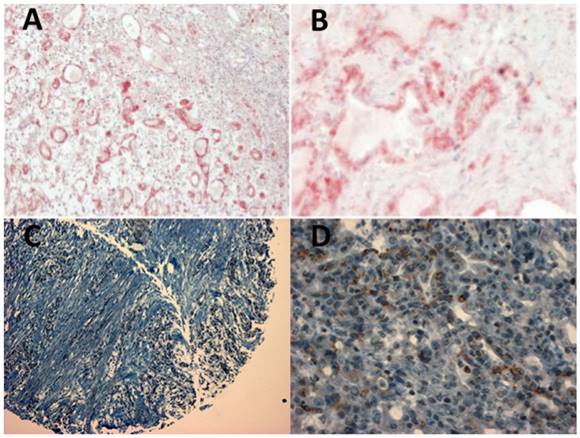
(A and B) Positive staining of an esophageal adenocarcinoma specimen with MK2 antibody ab63574 and blue counterstaining of nuclei with hematoxylin. (C and D) Positive staining of an esophageal adenocarcinoma specimen (tissue micro array) with ETV1 antibody ab81086. Left panels (A and C) 40x magnification, right panels (B and D) 400x magnification.
Competing Interests
The authors have declared that no competing interest exists.
References
1. Burmeister BH, Smithers BM, Gebski V, Fitzgerald L, Simes RJ, Devitt P. et al. Surgery alone versus chemoradiotherapy followed by surgery for resectable cancer of the oesophagus: a randomised controlled phase III trial. Lancet Oncol. 2005;6:659-68
2. Reynolds JV, Muldoon C, Hollywood D, Ravi N, Rowley S, O'Byrne K. et al. Long-term outcomes following neoadjuvant chemoradiotherapy for esophageal cancer. Ann Surg. 2007;245:707-16
3. J. Zacherl RA, E. Fleischmann, B. Karbon, S. Rasoul-Rockenschaub, G. Prager, F.M. Riegler, S.F. Schoppmann. Fast-track Ivor Lewis esophageal resection. European Surgery. 2015;47:59-64
4. Engel K, Ahlers A, Brach MA, Herrmann F, Gaestel M. MAPKAP kinase 2 is activated by heat shock and TNF-alpha: in vivo phosphorylation of small heat shock protein results from stimulation of the MAP kinase cascade. J Cell Biochem. 1995;57:321-30
5. Rouse J, Cohen P, Trigon S, Morange M, Alonso-Llamazares A, Zamanillo D. et al. A novel kinase cascade triggered by stress and heat shock that stimulates MAPKAP kinase-2 and phosphorylation of the small heat shock proteins. Cell. 1994;78:1027-37
6. Janknecht R. Cell type-specific inhibition of the ETS transcription factor ER81 by mitogen-activated protein kinase-activated protein kinase 2. J Biol Chem. 2001;276:41856-61
7. Janknecht R. Analysis of the ERK-stimulated ETS transcription factor ER81. Mol Cell Biol. 1996;16:1550-6
8. Gutierrez-Hartmann A, Duval DL, Bradford AP. ETS transcription factors in endocrine systems. Trends Endocrinol Metab. 2007;18:150-8
9. Jedlicka P, Gutierrez-Hartmann A. Ets transcription factors in intestinal morphogenesis, homeostasis and disease. Histol Histopathol. 2008;23:1417-24
10. Yuen HF, McCrudden CM, Chan KK, Chan YP, Wong ML, Chan KY. et al. The role of Pea3 group transcription factors in esophageal squamous cell carcinoma. Am J Pathol. 2011;179:992-1003
11. Crawford HC, Fingleton B, Gustavson MD, Kurpios N, Wagenaar RA, Hassell JA. et al. The PEA3 subfamily of Ets transcription factors synergizes with beta-catenin-LEF-1 to activate matrilysin transcription in intestinal tumors. Mol Cell Biol. 2001;21:1370-83
12. Oh S, Shin S, Janknecht R. ETV1, 4 and 5: an oncogenic subfamily of ETS transcription factors. Biochim Biophys Acta. 2012;1826:1-12
13. Brinckerhoff CE, Matrisian LM. Matrix metalloproteinases: a tail of a frog that became a prince. Nat Rev Mol Cell Biol. 2002;3:207-14
14. Shin S, Kim TD, Jin F, van Deursen JM, Dehm SM, Tindall DJ. et al. Induction of prostatic intraepithelial neoplasia and modulation of androgen receptor by ETS variant 1/ETS-related protein 81. Cancer Res. 2009;69:8102-10
15. Shin S, Oh S, An S, Janknecht R. ETS variant 1 regulates matrix metalloproteinase-7 transcription in LNCaP prostate cancer cells. Oncol Rep. 2013;29:306-14
16. Jane-Valbuena J, Widlund HR, Perner S, Johnson LA, Dibner AC, Lin WM. et al. An oncogenic role for ETV1 in melanoma. Cancer Res. 2010;70:2075-84
17. Birner P, Beer A, Vinatzer U, Stary S, Hoftberger R, Nirtl N. et al. MAPKAP kinase 2 overexpression influences prognosis in gastrointestinal stromal tumors and associates with copy number variations on chromosome 1 and expression of p38 MAP kinase and ETV1. Clin Cancer Res. 2012;18:1879-87
18. Schoppmann SF, Ricken G, Ilhan-Mutlu A, Nirtl N, Streubel B, Preusser M. et al. Downregulation of CIC does not associate with overexpression of ETV1 or MAP kinase pathway activation in gastrointestinal stromal tumors. Cancer Invest. 2014;32:363-7
19. Keld R, Guo B, Downey P, Gulmann C, Ang YS, Sharrocks AD. The ERK MAP kinase-PEA3/ETV4-MMP-1 axis is operative in oesophageal adenocarcinoma. Mol Cancer. 2010;9:313
20. Clark JP, Cooper CS. ETS gene fusions in prostate cancer. Nat Rev Urol. 2009;6:429-39
21. Birner P, Berghoff AS, Dinhof C, Pirker C, Capper D, Schoppmann SF. et al. MAP kinase activity supported by BRAF (V600E) mutation rather than gene amplification is associated with ETV1 expression in melanoma brain metastases. Arch Dermatol Res. 2014;306:873-84
22. Schoppmann SF, Beer A, Nirtl N, Ba-Ssalamah A, Brodowicz T, Streubel B. et al. Downregulation of phosphatidylethanolamine binding protein 1 associates with clinical risk factors in gastrointestinal stromal tumors, but not with activation of the RAF-1-MEK-ETV1 pathway. Cancer Lett. 2013;335:26-30
23. Pham NA, Morrison A, Schwock J, Aviel-Ronen S, Iakovlev V, Tsao MS. et al. Quantitative image analysis of immunohistochemical stains using a CMYK color model. Diagn Pathol. 2007;2:8
24. R Development Core Team. R: A language and environment for statistical computing. Vienna, Austria: R Foundation for Statistical Computing. 2017
25. Therneau T. A Package for Survival Analysis in S. 2.38 ed. 2015
26. Yamamoto H, Horiuchi S, Adachi Y, Taniguchi H, Nosho K, Min Y. et al. Expression of ets-related transcriptional factor E1AF is associated with tumor progression and over-expression of matrilysin in human gastric cancer. Carcinogenesis. 2004;25:325-32
27. Chi P, Chen Y, Zhang L, Guo X, Wongvipat J, Shamu T. et al. ETV1 is a lineage survival factor that cooperates with KIT in gastrointestinal stromal tumours. Nature. 2010;467:849-53
Author contact
![]() Corresponding author: Email: sebastian.schoppmannac.at; Tel.: +43 1 40400 56210; Fax: +43 1 40400 56220
Corresponding author: Email: sebastian.schoppmannac.at; Tel.: +43 1 40400 56210; Fax: +43 1 40400 56220
Citation styles
APA
Jomrich, G., Maroske, F., Stieger, J., Preusser, M., Ilhan-Mutlu, A., Winkler, D., Kristo, I., Paireder, M., Schoppmann, S.F. (2018). MK2 and ETV1 Are Prognostic Factors in Esophageal Adenocarcinomas. Journal of Cancer, 9(3), 460-468. https://doi.org/10.7150/jca.22310.
ACS
Jomrich, G.; Maroske, F.; Stieger, J.; Preusser, M.; Ilhan-Mutlu, A.; Winkler, D.; Kristo, I.; Paireder, M.; Schoppmann, S.F. MK2 and ETV1 Are Prognostic Factors in Esophageal Adenocarcinomas. J. Cancer 2018, 9 (3), 460-468. DOI: 10.7150/jca.22310.
NLM
Jomrich G, Maroske F, Stieger J, Preusser M, Ilhan-Mutlu A, Winkler D, Kristo I, Paireder M, Schoppmann SF. MK2 and ETV1 Are Prognostic Factors in Esophageal Adenocarcinomas. J Cancer 2018; 9(3):460-468. doi:10.7150/jca.22310. https://www.jcancer.org/v09p0460.htm
CSE
Jomrich G, Maroske F, Stieger J, Preusser M, Ilhan-Mutlu A, Winkler D, Kristo I, Paireder M, Schoppmann SF. 2018. MK2 and ETV1 Are Prognostic Factors in Esophageal Adenocarcinomas. J Cancer. 9(3):460-468.
This is an open access article distributed under the terms of the Creative Commons Attribution (CC BY-NC) license (https://creativecommons.org/licenses/by-nc/4.0/). See http://ivyspring.com/terms for full terms and conditions.