Journal of Cancer
ISSN: 1837-9664
3.2
Impact Factor
ISSN: 1837-9664

 Global reach, higher impact
J Cancer 2018; 9(5):816-833. doi:10.7150/jca.23737 This issue Cite
Research Paper
A New and Safe Mode of Ventilation for Interventional Pulmonary Medicine: The Ease of Nasal Superimposed High Frequency Jet Ventilation
Wolfgang Hohenforst-Schmidt1, Paul Zarogoulidis2 ![]() , Haidong Huang3, Yan-Gao Man4, Stella Laskou, Charilaos Koulouris, Dimitris Giannakidis, Stylianos Mantalobas, Maria C. Florou5, Aikaterini Amaniti6, Michael Steinheimer1, Anil Sinha1, Lutz Freitag7, J Francis Turner8, Robert Browning9, Thomas Vogl10, Andrei Roman10, Naim Benhassen11, Isaak Kesisoglou5, Konstantinos Sapalidis5
, Haidong Huang3, Yan-Gao Man4, Stella Laskou, Charilaos Koulouris, Dimitris Giannakidis, Stylianos Mantalobas, Maria C. Florou5, Aikaterini Amaniti6, Michael Steinheimer1, Anil Sinha1, Lutz Freitag7, J Francis Turner8, Robert Browning9, Thomas Vogl10, Andrei Roman10, Naim Benhassen11, Isaak Kesisoglou5, Konstantinos Sapalidis5
1. Sana Clinic Group Franken, Department of Cardiology / Pulmonology / Intensive Care / Nephrology, ''Hof'' Clinics, University of Erlangen, Hof, Germany
2. Pulmonary-Oncology Department, ``Theageneio`` Cancer Hospital, Thessaloniki, Greece
3. Department of Respiratory Diseases Shanghai Hospital, II Military University Hospital, Shanghai, People's Republic of China.
4. Research Laboratory and International Collaboration, Bon Secours Cancer Institute, VA, USA
5. 3rd Department of Surgery, “AHEPA” University Hospital, Aristotle University of Thessaloniki, Medical School, Thessaloniki, Greece
6. Anesthesiology Department, “AHEPA” University General Hospital, Aristotle University of Thessaloniki, Thessaloniki, Greece
7. Department of Interventional Pneumology, Ruhrlandklinik, University Hospital Essen, University of Essen-Duisburg, Tueschener Weg 40, 45239 Essen, Germany.
8. Division of Interventional Pulmonology & Medical Oncology, Cancer Treatment Centers of America, Western Regional Medical Center, Goodyear, AZ.
9. Pulmonary & Critical Care Medicine, Interventional Pulmonology, National Naval Medical Center, Walter Reed Army Medical Center, Bethesda, U.S.A.
10. Department of Diagnostic and Interventional Radiology, Goethe University of Frankfurt, Frankfurt, Germany.
11. Medical Clinic I, "Fuerth" Hospital, University of Erlangen, Fuerth, Germany.
Received 2017-11-8; Accepted 2017-12-3; Published 2018-2-12
Citation:
Hohenforst-Schmidt W, Zarogoulidis P, Huang H, Man YG, Laskou S, Koulouris C, Giannakidis D, Mantalobas S, Florou MC, Amaniti A, Steinheimer M, Sinha A, Freitag L, Turner JF, Browning R, Vogl T, Roman A, Benhassen N, Kesisoglou I, Sapalidis K. A New and Safe Mode of Ventilation for Interventional Pulmonary Medicine: The Ease of Nasal Superimposed High Frequency Jet Ventilation. J Cancer 2018; 9(5):816-833. doi:10.7150/jca.23737. https://www.jcancer.org/v09p0816.htm
Other stylesAbstract
We use pulmonary interventional procedures for the diagnosis of pulmonary diseases either for benign or malignant lesions. Flexible bronchoscopy with or without radial endobronchial ultrasound, convex-probe endobronchial ultrasound and electromagnetic navigation are procedures performed in centers with experience in diagnostic pulmonary medicine. The method of sedation and ventilation is very important in order to avoid or handle with success complications. Proper respiration during pulmonary (or other interventional) procedures is a key factor. Apart from the proper sedation method we have to choose the proper ventilation method which decides respiratory movement. Superimposed high-frequency jet ventilation (SHFJV) is supposed to be safe and effective in clinical practice. Although this perception is commonly accepted, there is no study proving its safety on the basic of reliable data. We analyzed the data of 100 patients in different interventional settings (bronchoscopy with or without navigational approach, left atrial appendage closure (LAAC) or intracardiac catheterization) using nasal SHFJV. Mainly analyzed were capillary ABG-Data at the beginning and end of the intervention under sedation. The aim was to analyze if a risk scenario for the patient by using the nasal SHFJV can be derived by measuring the changes of pCO2, pO2, cBase Excess, cHCO3 and PH. Due to our data we conclude that this method of ventilation can be easily and safely used in interventional medicine for patients with all kind of comorbidities such as; chronic respiratory disease, lung cancer, interstitial lung disease, structural heart disease and heart failure.
Keywords: lung cancer, bronchoscopy, endobronchial navigation, endobronchial ultrasound, interventional medicine, minimal-invasive techniques, conebeam computertomography, jet-ventilation.
Introduction
The first approaches, to maintain the pulmonary gas exchange without conventional ventilation arose at the beginning of the 20th century and went with the Volhards animal experimental settings back.[1] 1954 refined Barth the method using the introduction of a oxygen insufflation into the trachea for bridging apnea during bronchoscopy and lung resections.[2] The injector method was developed by Sanders end of the sixties. The concept behind that method is to apply breathing gas in portion with high pressure over a fine cannula, which was inserted in a bronchoscope.[3] At this stage, jet ventilation was delivered using only physiological frequencies, which may have disadvantages, like the risk of debris seeding, aspiration of blood as well as undesired vocal cord movements which may impede surgery.[4-6] Sjöstrand and coworkers discovered that it was possible to maintain adequate gas exchange with a high frequency (> 60 min-1) and low tidal volume ventilation.[7, 8] Klain and Smith developed 1977 the high frequency jet ventilation (HFJV). The HFJV initially was only connected to percutaneous transtracheal catheter. The catheter was connected to an air source that provided a jet injection of air controlled by a fluidic logic ventilator. Rates up to 600 breaths/min (10 Hz) were used. Later this technique used a catheter that allowed for air entrainment. HFJV offers rates of approximately 100 to 600 breaths/min (1,7 to 10 Hz, respectively) with a volume smaller than anatomic dead space volume.[9]
HFJV might not provide adequate carbon dioxide elimination and oxygenation in patients with severe airway stenosis or other complicating respiratory diseases. To address this problem, the combination of HFJV with a low-frequency jet component (superimposed high-frequency-jet ventilation, SHFJV) has been proposed. This method was developed 1990 by Alexander Aloy and his team. It was first described in the study “Tube-free translaryngeal superposed jet ventilation” published in the Anaesthesist. [10][12]. Superimposed high-frequency jet ventilation (SHFJV) involves simultaneously a normal frequency (12-20 min-1) and a high-frequency jet ventilation (HFJV) (>500 min-1). It may increase end-expiratory lung volume (EELV) and improve oxygenation. The proposed mechanism is a positive end-exspiratory pressure (PEEP) effect by the superimposed high-frequency jet component. Ventilation is usually delivered to the patient via two separate injector lines that are driven by one ventilator, allowing for separate adjustment of variables such as working pressure, inspiratory/ expiratory ratio (I/E ratio), and frequency. Figure 1 shows how the low frequent ventilation causes fluctuations in pressure analogous to conventional ventilation. Its jet frequency ranges regularly from 12-20 impulses per minute (0,2-0,3 Hz) with a (theoretical) maximum of up to 100/min. It produces an upper pressure plateau.[10] The superimposed high frequency jet gas frequency ranges in general from 100-1500 impulses per minute (1,6-25 Hz). It produces a lower pressure plateau, which correspond to a positive end-exspiratory pressure (PEEP), however, the upper pressure plateau caused by the normofrequent ventilation is additionally increased by the superposition of high frequencies.[10] An important problem for the evaluation of jet ventilation is that there are no bedside techniques available for measurement of end-expiratory volume, tidal volume (VT), and minute ventilation. The reason for the lack of volumetric techniques is that HFJV is usually applied in open systems in which air entrainment occurs to a varying extent, depending on the route of administration and the degree of airway obstruction, and thus a pneumotachograph will not provide accurate values. Likewise, because of gas leakage and mixing with entrained gas, conventional inert gas methods are unsuitable for the assessment of EELV changes during jet ventilation.[11] Leiter compared systematically in a study published 2012 four modes of jet-ventilation (JV). These are supraglottic superimposed highfrequency jet ventilation (SHFJV-SG), supraglottic normal frequency (NFJV-SG), supraglottic high frequency (HFJV-SG), and infraglottic highfrequency jet ventilation (HFJV-IG). All four modes of HFJV provided adequate ventilation and oxygenation but the use of supraglottic SHFJV produced the largest end-expiratory chest wall volume and tidal volume.[2] Superimposed high-frequency jet ventilation (SHFJV) is supposed to be safe and effective in clinical practice. Although this perception is commonly accepted, there is no study proving its safety based on reliable data. This may be a major reason why this ventilation method despite many years of secure and effective use in clinical practice, still is a rarity in hospitals worldwide. Dedicated publications on nasal jet-catheter ventilation with double frequencies in different interventional settings are extremely rare. Instead of jet-catheter the mainstream of traditional lung centres apply rigid bronchoscopy with anesthesia, although not essentially needed for the intervention. Reports about use in interventional cardiology or radiology are also seldom.
Patients and Methods
After achieving informed consent from all patients we reviewed the records of 100 patients submitted a flexible bronchoscopy in whom we measured before and after the intervention capillary blood gases with or without dedicated navigation for pulmonary diagnostic approaches, for a left atrial appendage closure (LAAC) or an intracardiac catheterization between 2012 and 2015, all of them treated using nasal SHFJV, in the II Medical Clinic, Coburg Hospital, University of Wuerzburg, Coburg, Germany and in the Medical Clinic I, Fuerth Hospital, University of Erlangen, Fuerth, Germany. Patients were arbitrary included. No systematic exclusion of patients took place, the database was an all-comers dataset. All interventions were carried out by the same interventionalist Dr. Wolfgang Hohenforst-Schmidt with a sophisticated dual-frequency nasal jet ventilator (Carl Reiner, Vienna). Major aim was to compare the arterial blood gas (ABG) at the beginning and end of the intervention in order to find out if one can derive a risk scenario for the individual patient. The nasal jet catheter was put through the nose into the trachea. The diameter of the catheter is less than 2mm and includes 2 channels. It works as an open ventilation-system. The patients can breathe at any time due to the depth of general sedation without relaxation. Different parameters can be varied such us working pressure, frequencies, PEEP, FiO2 and Inspiratory : Expiratory ratio (I:E). During the intervention patients were standardly monitored including clinical inspection (thorax excursion, skin color, side stream, auscultation, jet-noise), non-invasive blood pressure measurement and continuous measurement of peripheral oxygen saturation. Sedation was performed with a maximum of 5mg Midazolam and varying amount of Propofol in order to perform the desired intervention. A capillary arterial blood gas analysis (ABG) was taken at the beginning and end of each intervention. The first ABG was taken while starting the sedation, the patients were awake lying on the table. The ABG directly after intervention was taken while the patients were still deeply sedated, the sedation has been stopped just in this moment, the patient was still on nasal jet-catheter ventilation. Beside ABGs (ph, pCO2, pO2, cBASE(EcF)C, cHCO3 measured on ABL90 FLEX (Radiometer, Krefeld, Germany) before and after the intervention we recorded the following measurements due to some pre-defined hypothesis at the day of intervention: Age, gender, weight, height, derived Body Mass Index (BMI), duration of intervention by measuring time point of start and end of intervention due to the definition of ,,before'' and ,,after'', purpose (e.g. 58 navigational endobronchial approaches under conebeam computertomography (CBCT) guidance (of those 17 with an additional navigated transthoracic approach by CBCT), 42 non-navigational purposes (of those 11 other bronchoscopies for lung diseases and 31 intracardiac catheterizations (of those 10 LAAC) ), ejection fraction of the left ventricle in percentage (LVEF) (in all patients) (of those heart failure NYHA class >1 in 34 patients), existence of lung disease (72 patients) and / or existence of any structural heart disease (s.h.d.) (65 patients) including disease type according to the patient's record. In total the raw data excel sheet consists of 3300 cells. Table 1.
Figure 1
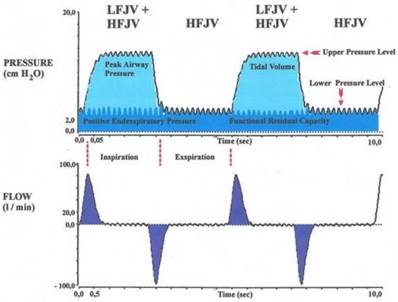
Relation between flow and pressure during inspiration and expiration while ventilation using SHFJV.
Table 1
Structure of the patients
| Characteristics | Number of Patients |
|---|---|
| Male | 66 |
| Female | 34 |
| Age >50 | 95 |
| Age ≤50 | 5 |
| BMI 25-30 | 34 |
| BMI ≤25 | 36 |
| BMI >30 | 30 |
| Group A (patients with lung disease) | 72 |
| Group B (patients with a lung disease undergoing endobronchial navigation bronchoscopy with conebeam CT) | 58 |
| Group C (patients without endobronchial navigation) | 42 |
| Group D (patients without lung disease) | 28 |
| Total | 100 |
In general the modes of each above mentioned group of ventilation were set to achieve unrisky blood gases and hemodynamics according to the publication of Minana et al. [12] with well accepted thresholds for pO2<60mmHg, pCO2>50mmHg and pH<7,35. Of note is the fact that during the intervention there was only a live recording of non-invasive oxygen saturation and blood pressure. Therefore the development during intervention of blood gases in regards to the above mentioned thresholds were especially blinded to the figures of pCO2 and pH.
The above mentioned subgroups were separated due to the fact that endobronchial navigation with CBCT is depending on intermittent low frequency ventilation with a very long inspiratory time (e.g. I:E was set to 2:1 with 2/min) and higher working pressures (e.g. at least 2,5bar in the low frequency jet setting) in order to achieve a maximum tolerable and constant hyperinflation of the lung for dataset acquisition and navigation at the decisive endobronchial path separations: Applying the same hyperinflation pressure mode in acquisition and navigation guarantees a perfect overlay of 2-dimensional fluoroscopy with 3-dimensional segmentation due to the same positionning of the diaphragm.[13] Furthermore it is possible to detect more peripheral airways with hyperinflation as seen in regular thoracical computer tomography. Ventilation mode in group B (with intermittent low frequency hyperinflation) differs therefore from all other groups. In patients with intended diagnostic navigational approach towards a nodule bigger than 9mm in all diameters we added onto the endobronchial approach a transthoracic approach when we perceived that we could not reach the nodule in the inner 2/3 of a volume due to anatomy. This transthoracic approach was performed in apnea for dataset acquisition and transthoracic needle puncture which means an additional risk for deteriorated ABG analysis. However, the nasal jet ventilation approach with SHFJV was always adapted to the desired interventional needs. All patients were asked for informed consent and none of the asked all-comers patients were excluded. All interventions were performed without any unintended interruption or major complication like death, pneumothorax, major bleeding, heart attack or intensive care referral. There were no short term (day 30 post intervention) or long term hazard (day 180 post intervention) recorded according to telephone calls with all patients at these days.
Statistical Analysis and Results
All analyzes were done with SPSS 23.0 and Microsoft Excel 2013, the images were also created with these two programs. The error probability was set at α = 0,05. The following static methods were used:
Descriptive statistics
- mean, standard deviation, minimum, maximum
- absolute and relative frequencies
- Crosstabs incl. Χ2 tests
Examination of procedural requirements / distribution assumptions
- Kolmogorov-Smirnov test
- Levene´s test
Examination of mean differences
- t-tests for dependent samples to test mean differences
- t-tests for independent samples (homogene/heterogene variances)
- U-test
- Wilcoxon-Signed-Ranks-test
- Kruskal-Wallis-test
- Simple analysis of variance
- Examination of relationships
- Pearson-correlation
Age and gender
The sample consists of 100 patients of whom 34 are female and 66 are male. The average age of all patients was 70 years (ys) with a standard deviation (SD) of 11.2 with a minimum age of 23 and a maximum age of 89. Between female and male there was no significant difference (t-test for independent samples and homogeneous variances, p = .955). In the total sample the age is not normally distributed (Kolmogorov-Smirnov test: p = .000 *). Figure 2,3
Figure 2
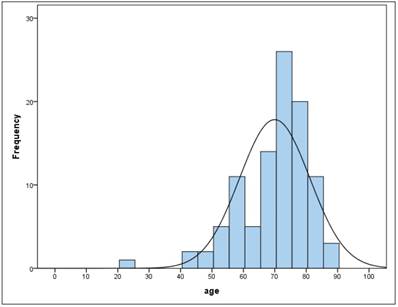
Frequency of age
BMI
The mean BMI (kg/m2) in the total sample was 27.1 (SD = 5.5) (Figure 2). There is no gender difference (t-test for independent samples and homogeneous variances, p = .240). The BMI follows a normal distribution (Kolmogorov-Smirnov test) both in the total sample (p = 0.240), as well as in men (p = 0.054) and women (p = 0.109).
Blood gas analysis (BGA) parameter
Blood gas parameters were measured as capillary blood gases with ABL90 FLEX and labelled according to the above mentioned definition.
Figure 3
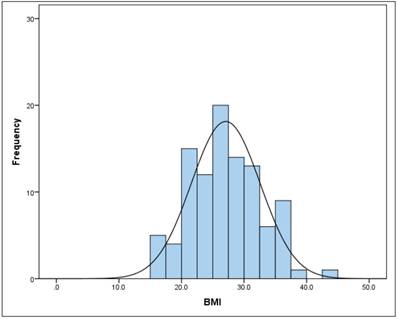
Frequency of BMI
pH
The pH was "before" between 7.19 and 7.56, the mean at 7.40 (SD = 0.08), "after" between 7.07 and 7.66, with the mean decreasing to 7.33 (SD = 0.09).
The mean drop in the pH between "before" and "after" is significant (t-test for dependent samples: p = .000 * The average absolute change (difference) was -0.08, the average percentage change was -1% (basis: individual baseline). (Figure 4) The change is therefore significant, but very low.
Figure 4
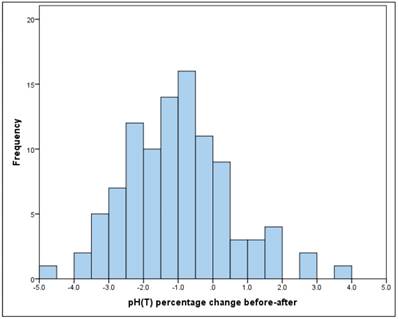
Frequency of pH percentage change before-after
There is no significant linear relationship between "before" and "after" (Pearson correlation: r = 0.10, p = 0.302).
pCO2 mmHg
The pCO2 value showed "before" a mean with 42.6mmHg (SD = 10.7), "after" with a mean rising to 50.7mmHg (SD = 13.2.).
The mean increase in pCO2 between "before" and "after" is significant (t-test for dependent samples: p = .000 *) The average absolute change (difference) was + 8.1mmHg, the average percentage change was + 22.8% (basis: individual initial value). Figure 5.
Figure 5
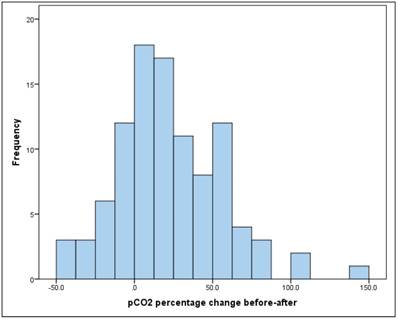
pCO2 percentage change before-after.
There is a significant, but relatively small, linear relationship between pCO2 "before" and "after" of r = 0.32 (Pearson correlation: p = 0.001*).
pO2 mmHg
The pO2 value showed "before" a mean at 63.6mmHg (SD = 12.7), "after" a mean rising to 203.1mmHg (SD = 134.4), which is significant (Wilcoxon-Signed-Ranks-test: p = .000 *)
The average absolute change (difference) was + 139.5mmHg, the average percentage change was + 224.3% (basis: individual baseline). Closer examination reveals that only 3.0% of the patients showed a reduction in the pO2 value, while the remaining 97.0% showed an increase. The increase showed a mean of + 144.5mmHg (SD = 132.1). Looking at the relative (percentage) change in the value {[100 * [pO2 (after) -pO2 (before)]] / pO2 (before)}, the increase was between + 0.7% and + 907%.
There is no significant relationship between "before" and "after" with r = 0.15 (Pearson correlation: p = 0.148). Figure 6.
The scatter plot in Fig. 6 shows the respective values "before" and "after". There one can see very well that the spread "after" is much larger than "before" (SDb = 12.7, SDa = 134.4).
cBase(Ecf)
The cBase value showed "before" a mean at +1.6 (SD = 3.4), "after" a mean decreasing to +0.2 (SD = 4.7), The mean decrease in the cBase value between "before" and "after" is significant (Wilcoxon-Signed-Ranks test: p = .000*). Closer inspection reveals that 87% of patients had a cBase reduction, while the remaining 13% experienced an increase. The reduction cases showed a mean value of -2.2 (SD = 1.5).
Figure 6
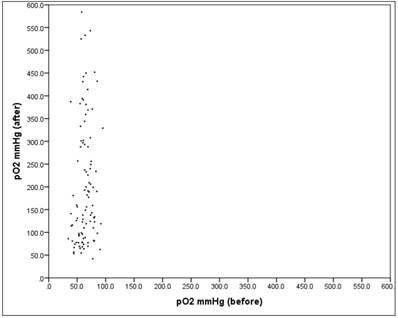
Scatter plot pO2 "before" vs. "after"
Between "before" and "after" there is a mean, relevant and significant linear correlation (correlation according to Pearson: r = 0.67, p = 0.000). The scatter plot in figure 7 shows the respectively associated values "before" and "after", the structure of the point cloud can be clearly seen here, but also some extreme outliers.
Figure 7
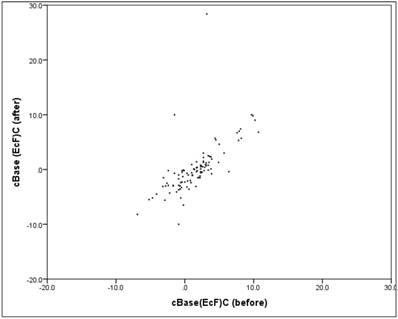
Scatter plot cBase "before" vs. "after".
cHCO3 (mmol/l)
The HCO3 value showed "before" a mean at 25.6 (SD = 2.8), "after" a mean decreasing to 23.8 (SD = 3.2). The mean decrease in the HCO3 value between "before" and "after" is significant (t-test for dependent samples: p = .000*), The average absolute change (difference) was -1.8mmol/l, the average percentage change was -6.7% (basis: individual baseline). A closer look reveals that 86% of patients had a reduction in HCO3, while the remaining 14% experienced an increase. The reduction showed a mean of -2.4 (SD = 1.6). Between "before" and "after" there is a mean, content-relevant and significant linear correlation (correlation according to Pearson: r = 0.71, p = 0.000*).The scatter plot in figure 8 shows the respectively associated values "before" and "after", the structure of the point cloud is easy to recognize, but also some outliers.
Figure 8
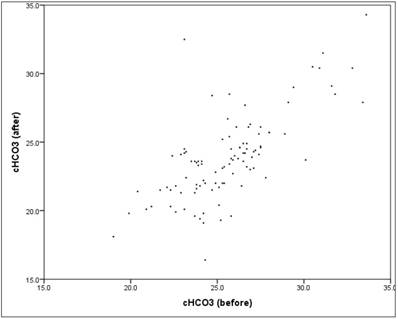
Scatter plot HCO3 "before" vs. "after".
ABG parameters: Examination for a potential risk from nasal jet ventilation
Hypothesis A: Jet-ventilation for navigational purpose has a different influence on pCO2 values after the intervention than jet-ventilation for non-navigational purposes
This was supposed to be true as for navigation we had to apply intermittent low frequency JV or even apnea. Both settings increase the risk of reduction of CO2-clearance. Table 2.
Between the non-navigational group and the navigational group there are the following descriptions:
a) There is a significant difference in ''before'' mean values in regards to pCO2 and pH, but not in pO2.
b) “After” values showed no significant differences in the mean values of all 3 blood gas determinants, especially no difference in pCO2.
Table 2
Aa) Consideration of the continuous variables
| Non-Navigation (w/o CBCT) (n=42) | Navigation+ with CBCT (n=58) | Mean differences (U-test) | |||
|---|---|---|---|---|---|
| mean | SD | mean | SD | p | |
| pCO2 mmHg (before) | 45.1 | 11.5 | 40.7 | 9.6 | 0.010* |
| pO2 mmHg (before) | 61.7 | 11.8 | 65.1 | 13.3 | 0.270 |
| pH (before) | 7.36 | 0.08 | 7.43 | 0.07 | 0.000* |
| pCO2 mmHg (after) | 48.4 | 12.8 | 52.4 | 13.3 | 0.182 |
| pO2 mmHg (after) | 195.2 | 121.6 | 209.1 | 144.1 | 0.978 |
| pH (after) | 7.34 | 0.08 | 7.32 | 0.09 | 0.237 |
| pCO2 difference before/after absolute | 3.3 | 10.5 | 11.7 | 15.4 | 0.001* |
| pO2 difference before/after absolute | 133.5 | 120.5 | 144.0 | 142.8 | 0.876 |
| pH difference before/after absolute | -0.03 | 0.1 | -.109 | 0.1 | 0.000* |
| pCO2 percentage change before/after | 9.7 | 25.4 | 32.7 | 35.9 | 0.001* |
| pO2 percentage change before-after | 222.8 | 211.3 | 225.4 | 224.3 | 0.762 |
| pH percentage change before-after | -0.4 | 1.2 | -1.5 | 1.6 | 0.000* |
c) In both groups there is an increase in the pCO2 mean (the mean of the differences is positive), but the increase in the navigational group is significantly higher (11.7 vs. 3.3mmHg) which was expected. However as mentioned above there is no significant difference in the absolute value of pCO2 after the intervention in both groups.
d) In both groups there is an increase in the pO2 value (the mean of the differences is positive), but there is no difference between the two groups (the increase is comparably high in both groups).
e) The pH decreases in both groups (the mean of the differences is negative), but in the navigational group the extent of the pH reduction is significantly more pronounced (-1,5, SD = 1,6).
The above points apply both to the absolute difference and to the relative (percentage) difference.
Ab) Dichotomization of variables (cut-off scores)
In the next step, the 3 parameters were dichotomised along the cut-off scores that have been defined in advance:
- pCO2>50mmHg
- pO2<60mmHg
- pH<7.35
Hypothesis B: The initial level of pCO2 > 50mmHg has a greater and significant influence in the navigational group
AbI) pCO2>50mmHg
In the navigational group "Before" only 8.8% of patients are found with a pCO2 value> 50mmHg, in the non-navigational group it is 32.6%. The proportion increases to "after" in both groups, with a much more pronounced increase in the navigational group from 8.8% to 50.9%, while in the non-navigational group it is only from 32.6% to 41.9%. Figure 9.
If one considers only the sub-sample in which the pCO2 value was already above the cut-off value at the beginning (pCO2 initial> 50 mmHg), it turns out that in the non-navigational group, 71.4% of these patients have reached this cut-off value in the "after" measurement, in the navigation group it is only 60.0%.
Therefore the proportion of patients who are "after" above the pCO2 threshold of 50mmHg is not different between the navigation and the non-navigational group, but only in the subsample that is "before" already above the cut-off value (Χ2 test: p = 0.520). Figure 10.
Figure 9
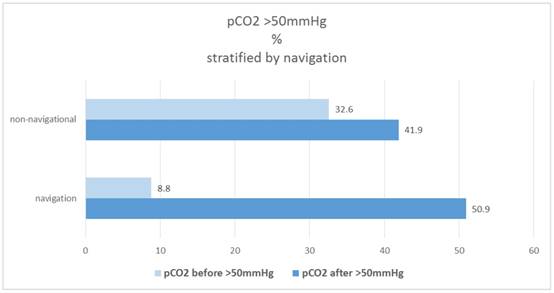
Percentage of patients pCO2(before/after)>50mmHg, stratified by navigation.
Figure 10
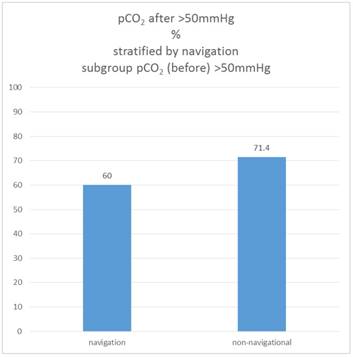
Percentage of patients pCO2 (after)>50mmHg, subgroup pCO2(before)>50mmHg, stratified by navigation.
AbII) pO2<60mmHg
In the navigation group "Before" there are 36.8% who have a pO2 value <60mmHg, in the non-navigational group it is 39.5% (no group difference). The proportion falls to "after" in both groups to 2.3% and 5.3%, therefore the probability of a low pO2 after the intervention with JV is neglectable. The proportion of patients situated ''after''below the pO2 threshold of 60mmHg is not different between navigation and the non-navigational group (Χ2 test: p = 0.422).
AbIII) pH<7.35
In the navigation group 8.8%, which have a pH <7.35, are found in the "before" category; in the non-navigational group it is 37.2% (significant group difference: X2-test: p = 0.0221). The proportion increases to "after" in both groups to 63.2% and 53.5%. Figure 11.
If only the subsample with the initial pCO2 value above the cut-off value (pCO2 initial> 50mmHg) is considered, 57.1% of these patients in the non-navigational group are "after" below the cutoff value pH cut-off value, in the navigation group is 40.0%. The group difference is not significant (Χ2 test: p = 0.412).
As pH is clearly depending on pCO2 it is obvious that the proportion of patients who show "after" a pH below 7.35 does not differ between the navigation and the non-navigational group (Χ2 test: p = 0.628) - irrespective if the initial pCO2 is above 50mmHg.
Hypothesis C: Blood gas parameters are depending on LVEF under JV
In a first step the ejection classes were formed in 10% stages. Table 3. Figure 12.
Figure 13. shows the percentage of "critical" patients in the 10% EF stages.
For pO2 there are no differences to EF, the proportion is comparably high in all classes (random fluctuations, Χ2 test: p = 0.725 and 0.868, respectively).
For pH, there are also only random fluctuations, the% rate of "critical" patients is independent of the EF class (Χ2 test: p = 0.880 and 0.188 respectively).
For pCO2 there are also only random fluctuations, the% set of "critical" patients is independent of the EF class (Χ2 test: p = 0.360 and 0.451 respectively).
Figure 11
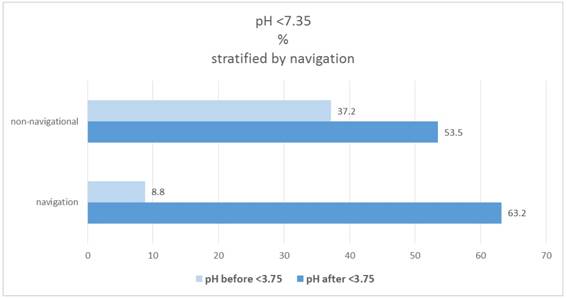
Percentage of patients pH(before/after)<7.35, stratified by navigation.
Figure 12
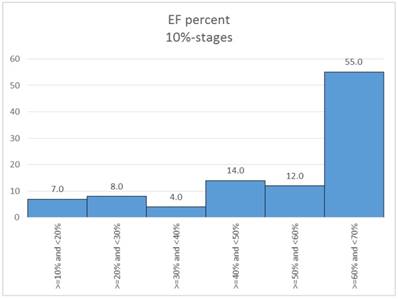
Distribution of EF percent (10%-stages).
Hypothesis D: A higher BMI is influencing blood gas parameters under JV
In the first step, the BMI was dichotomized (≤32 vs.> 32; per definition strong adipositas with a BMI>32). 20% of patients fall into the critical stage of BMI> 32, in the navigation group the proportion is 12.3%, in the non-navigational group it is 30.2%. Table 4.
There is no significant correlation between BMI and pCO2 (Χ2 test: p = 0.764 and 0.482, respectively).
There is no significant correlation between BMI and pO2 (Χ2 test: p = 0.799 and 0.379, respectively).
There is no significant correlation between BMI and pH (Χ2 test: p = 0.684 and 0.717, respectively).
Table 3
Measurements EF: ejection fraction, partial Ogygene and Carbon Dioxide (before/after)
| EF | pCO2>50mmHG | pO2<60mmHg | pH<7.35 | pCO2(after)>pCO2(before) | pO2(after)<pO2(before) | pH(after)<pH(before) |
|---|---|---|---|---|---|---|
| >=10% and <20% | 57.1% | 0.0% | 57.1% | 85.7% | 0.0% | 85.7% |
| >=20% and <30% | 37.5% | 12.5% | 75.0% | 75.0% | 0.0% | 62.5% |
| >=30% and <40% | 100.0% | 0.0% | 75.0% | 100.0% | 0.0% | 100.0% |
| >=40% and <50% | 42.9% | 7.1% | 50.0% | 57.1% | 7.1% | 57.1% |
| >=50% and <60% | 50.0% | 0.0% | 58.3% | 83.3% | 0.0% | 91.7% |
| >=60% and <70% | 50.0% | 3.6% | 58.2% | 76.4% | 3.6% | 80.0% |
Table 4
Whole database (n=100)
| BMI | pCO2>50mmHG | pO2<60mmHg | pH<7.35 | pCO2(after)>pCO2(before) | pO2(after)<pO2(before) | pH(after)<pH(before) |
|---|---|---|---|---|---|---|
| ≤32 | 46.3% | 3.8% | 60.0% | 77.5% | 3.8% | 78.8% |
| >32 | 50.0% | 5.0% | 55.0% | 70.0% | 0.0% | 75.0% |
Figure 13
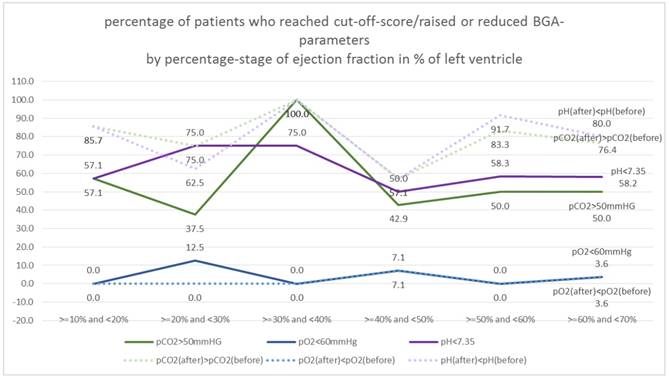
Percentage of patients who reached cut-off-score/raised or reduced BGA-parameters by percentage-stage of ejection fraction in % of left ventricle (10%-stages).
Table 5
Measurements EF: ejection fraction, partial Ogygene and Carbon Dioxide (before/after)
| EF | pCO2>50mmHG | pO2<60mmHg | pH<7.35 | pCO2(after)>pCO2(before) | pO2(after)<pO2(before) | pH(after)<pH(before) |
|---|---|---|---|---|---|---|
| < 60 years | 38.1% | 0.0% | 66.7% | 81.0% | 0.0% | 85.7% |
| 60 - <70 years | 52.6% | 0.0% | 47.4% | 89.5% | 5.3% | 94.7% |
| 70- <80 years | 47.8% | 8.7% | 58.7% | 71.7% | 4.3% | 69.6% |
| ≥80 years | 50.0% | 0.0% | 64.3% | 64.3% | 0.0% | 71.4% |
Hypothesis E: Age increases deterioration of blood gas parameters under JV
Based on the age distribution of the sample (figure 2), age is categorized into 10-year classes, with 1st grade comprising persons under the age of 60. 21% of patients fall into the category <60 years, 19% are 60- <70 years, 46% are 70- <80 years and the remaining 14% are 80 years or older. Table 5.
There is no significant correlation between the age groups and pCO2 (Χ2 test: p = 0.808 and 0.298, respectively).
There is no significant correlation between the age groups and pO2 (Χ2 test: p = 0.180 and 0.379, respectively).
There is no significant correlation between age groups and pH (Χ2 test: p = 0.629 and 0.107, respectively).
Correlation between pH change and pCO2 change
The correlation between the before-after pH change and the before-after pCO2 change is high (Pearson correlation: r = -0.913) and significant (p = 0.000 *). Figure 14.
Figure 14
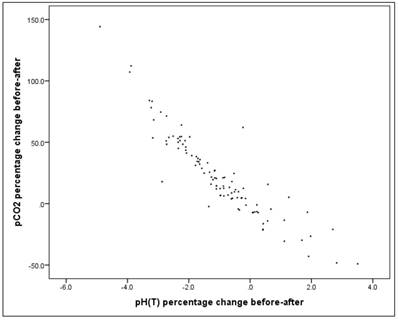
Scatterplot for pH percentage change and pCO2 percentage change.
Before the intervention there is a significant correlation between the pH value and the pCO2 value (Pearson correlation: r = -0.803, p = 0.000*), as well as "after" the intervention (Pearson correlation: r = -0.816, p = 0.000*), Figures 15-17. Therefore pH and pCO2 always correlate highly and significantly with each other, in all subsets.
Figure 15
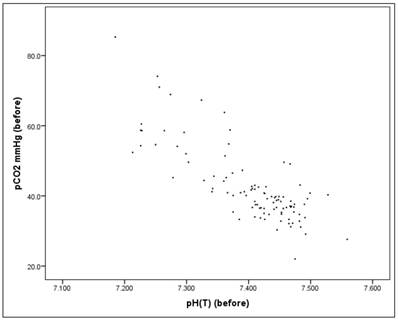
Scatterplot for pH(before) and pCO2(before).
Figure 16
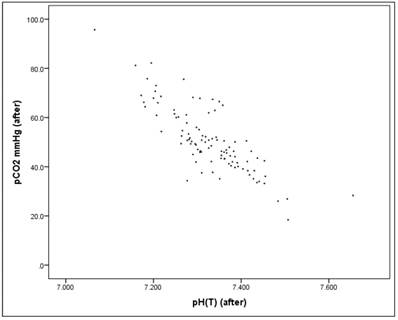
Scatterplot for pH(after) and pCO2(after).
Hypothesis F: The duration of the intervention has a positive correlation with the level of pCO2, since CO2 elimination is a critical function of jet ventilation
For the whole dataset (n=100) the linear correlation between the duration (minutes) and the pCO2 value "after" is not significant in univariate analysis (r = 0.034, p = 0.739), it is no "simple" relationship.
Figure 17
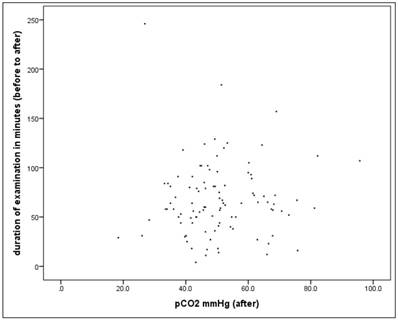
Scatterplot for duration and pCO2(after).
Alternatively, if the percent change in the pCO2 value is considered, the correlation is rather small but significant (r = 0.209, p = 0.037).
In the next step we have considered the proportion of patients who exceed the critical pCO2 value (> 50mmHg) along a defined time interval. The time intervals in each case comprise 10 minutes, with the 1st interval comprising <20 minutes, and the last interval> = 100 minutes.
There are no differences in the frequency with patients exceeding the critical pCO2 value of 50mmHg after the intervention as defined between duration classes (X2-test: p = 0.644).
72 patients have lung disease. There is also no significant difference in univariate analysis in this subsample (X2-test: p = 0.768)
Subsamples navigation vs. non-navigational group
Dividing the total sample into 2 groups with navigational vs. non-navigational purpose, neither of these two subgroups showed a correlation between duration and pCO2 (after)> 50mmHg (X2-test: p = 0.740 and 0.459, respectively), Figure 18.
Hypothesis G: Lung disease tend to increase pCO2 after the intervention
In univariate analysis there is no significant effect of lung disease detectable: In patients without lung disease, the proportion of pCO2> 50mmHg is 42.9%, and in those with lung disease 48.6% (t-test for independent samples and homogeneous variances: p = 0.650).
We also looked at the mean pCO2 values in the two groups. The mean pCO2 value (after) is 50.16mmHg in the group without lung disease and 50.90mmHg in the lung disease group. The mean difference is not significant (t-test for independent samples and homogeneous variances: p = 0.311). The same applies to the percentage change in pCO2, which is 28.3% for patients without lung disease and 20.7% for patients with lung disease. The mean difference is also not significant here (t-test for independent samples and homogeneous variances: p = 0.801).
Figure 18
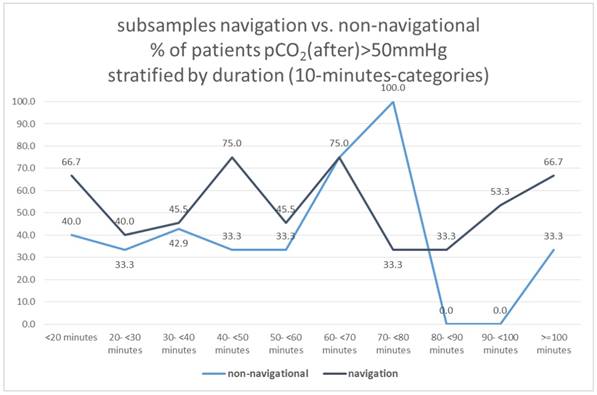
Subsamples navigation vs. non-navigational, % of patients pCO2(after)>50mmHg stratified by duration (10-minutes-categories).
Hypothesis H: An increased initial pCO2>50mmHg increases the probability of the same value over the above mentioned cut-off after the intervention
Here is a significant relation. Patients who were above the threshold before intervention showed in 68.4% of the cases a value above the cut-off score (50mmHg) after the intervention, patients who were below the threshold before the intervention have only 42.0% a value> 50mmHg (p = 0.038*) after the intervention.
Likewise, there is a significant linear correlation between the "before" and "after" values (raw values of the whole database), as already shown: Between pCO2 "before" and "after" there is a significant, but only relatively linear relationship of r = 0.32 (Pearson correlation: p = 0.001*).
Multivariate analysis
What is promising for jet ventilation (JV) is the different size effects produced between bronchoscopy and catheterization meaning that metric JV attributes can be quantified through the following procedure:
a) Comparative effects between JV modes in groups ABC versus D,
b) same effects between groups BC versus D and
c) same effects between groups BC vs AD.
The mode A alone cannot be discriminated from the rest of the modes, due to the low sample size and perhaps to modest similarities with BC and also with D. Thus, its effect is deduced subtractive.
d) Most decisive factors for JV technique are history events such as, lung disease and s.h.d., most important gas (really prevailing) is pCO2 and duration of intervention.
c) The reliability of the technique (models under study) was calculated using lift plots and ROC curves (with caution anyway).
Gas variables were relativized to remove individual effects as follows: V= (V after - V before)/V before
The simple change (after - before) does not take into account the initial values which are very different among the patients, causing statistical troubles in the interpretation.
Data after relativization appears very normal apart from pO2 whose transformation did not help much. Moreover, pO2 did not have any effect on all the various statistical analyses. Table 6. Figure 19.
Gas variables pCO2 and pH correlate strongly and negatively (r=-0.913) as the next figure manifests. Figure 20.
The values of pH caused enormous problems in the statistical analysis, so it was precluded from further manipulation, but bearing in mind the high correlation with pCO2, it is easy to conclude an inverse situation whenever pCO2 is engaged. For instance, an increase of pCO2 corresponds to a decrease in pH in all statistical analyses following.
The dependent variables were three: Venti (2) (names will be changed upon request) including ABC and D, Venti (3) including BC and D and finally Venti (5) including BC and AD.
Figure 19
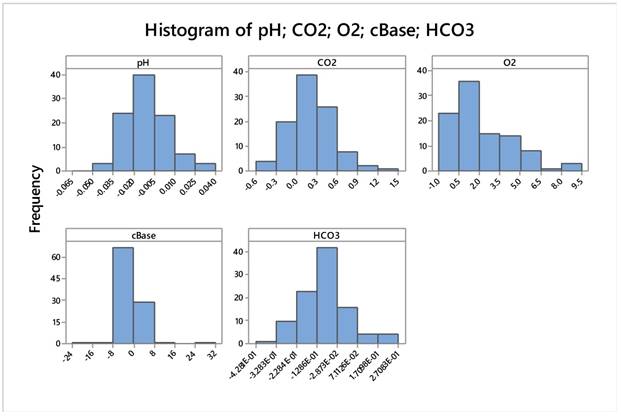
Gas variables were relativized to remove individual effects as follows: V= (V after - V before)/V before
Table 6
Descriptive Statistics: pH; CO2; O2; cBase; HCO3 after above mentioned transformation
| Variable | N | Mean | SE Mean | StDev | Minimum | Q1 | Median | Q3 | Maximum | |
|---|---|---|---|---|---|---|---|---|---|---|
| pH | 100 | -,01004 | 0,00151 | 0,01513 | -0,04899 | -0,02099 | -0,01100 | -0,00224 | 0,03507 | |
| CO2 | 100 | 0,2279 | 0,0337 | 0,3368 | -0,4900 | 0,0400 | 0,1793 | 0,4584 | 1,4413 | |
| O2 | 100 | 2,243 | 0,218 | 2,177 | -0,455 | 0,601 | 1,601 | 3,798 | 9,069 | |
| cBase | 100 | -0,211 | 0,482 | 4,820 | -24,000 | -1,054 | -0,487 | 0,111 | 31,500 | |
| HCO3 | 100 | -0,0913 | 0,0119 | 0,1192 | -0,4281 | -0,1590 | -0,0932 | -0,0328 | 0,2708 | |
| Variable | Skewness | Kurtosis | ||||||||
| pH | 0,40 | 0,57 | ||||||||
| CO2 | 0,65 | 1,25 | ||||||||
| O2 | 1,21 | 0,95 | ||||||||
| cBase | 1,70 | 24,31 | ||||||||
| HCO3 | 0,33 | 1,15 | ||||||||
Figure 20
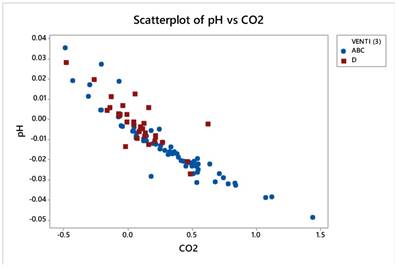
Gas variables pCO2 and pH correlate strongly and negatively (r=-0.913) as the next figure manifests.
The predictor variables were:
Quantitative variables: Age, BMI (and coded as well), Duration of intervention (transformed to square root minutes) and the five relativized blood gases.
Coded variables: gender, heart insufficiency, structural heart disease (s.h.d.), lung disease, LVEF dichotomized (<55% and >55%).
The dependent variables were treated as follows:
First, with multiple discriminant analysis (MDA) in order to find the most effective variables using forward selection of variables (step-wise regression) the power of prediction was tested. This technique was very powerful only for the discrimination between ABC and D.
The regression and classification of cases technique followed the MDA results, a really innovating statistical tool.
Second, with binary logistic regression (and forward selection) to detect again the most influential variables and also to calculate odds ratios between the two modes under study each time.
Moreover; comparison between ABC and D modes. This can be thought as all cases on bronchoscopy approaches versus cardiac catheterization.
Multiple discriminant analysis proved a very efficient technique predicting 91% of the two classes. Table 7.
Table 7
Classification Matrix (Spreadsheet1.sta) Classifications: Rows(Observed) Columns(Predicted) (Analysis sample)
| Class | Classification Matrix (Spreadsheet1.sta) Classifications: Rows(Observed) Columns(Predicted) (Analysis sample) | ||
|---|---|---|---|
| PercentCorrect | ABCp=.6900 | Dp=.3100 | |
| ABC | 95.65217 | 66.00000 | 3.00000 |
| D | 80.64516 | 6.00000 | 25.00000 |
| Total | 91.00000 | 72.00000 | 28.00000 |
Three patients were mismatched from the ABC group and 6 from the D group.
Lung disease was the most prevailing discriminant variable (expected so) in joint with operational duration (square root in min), then s.h.d, pCO2, and the interaction between EF% and s.h.d.
Table 8
Multivariate Tests of Significance (Spreadsheet1.sta) Sigma-restricted parameterization Effective hypothesis decomposition
| Effect | Multivariate Tests of Significance (Spreadsheet1.sta) Sigma-restricted parameterization Effective hypothesis decomposition | |||||
|---|---|---|---|---|---|---|
| Test | Value | F | Effectdf | Errordf | p | |
| s.h.d. | Wilks | 0.906355 | 9.60880 | 1 | 93 | 0.002562 |
| Lung disease | Wilks | 0.564719 | 71.68370 | 1 | 93 | 0.000000 |
| EF-2*s.h.d. | Wilks | 0.915636 | 8.56875 | 1 | 93 | 0.004299 |
| sqrtmin | Wilks | 0.855760 | 15.67536 | 1 | 93 | 0.000147 |
| "CO2" | Wilks | 0.926259 | 7.40393 | 1 | 93 | 0.007769 |
| "HCO3" | Wilks | 0.958583 | 4.01821 | 1 | 93 | 0.047919 |
Lung disease dominates in the ABC group presenting 61 patients and only 11 in the D group. On the other hand, s.h.d. clearly represents the D group (28 patients) and also 53.5% of the ABC patients (37/69). That means lung diseases play a crucial role in the ventilation effect indifferent if we consider navigation or not. Table 9.
The latter portion is nearly equally divided into ABC patients suffering from either low or high EF% levels (23 against 27 and 9 against 10) in the event of s.h.d. Of note is that much higher incidence (64.3%=18/28) occurs in patients suffering from structural heart disease and low ejection fraction (<55%). Thus s,h,d, appears to be a good discriminant variable when only D patients are recorded for jet ventilation. Patients with a lung disease usually have a heart condition which may affect their ventilation. Table 10.
Table 9
lung diseases play a crucial role in the ventilation effect indifferent if we consider navigation or not
| s.h.d | ABC | D | All |
|---|---|---|---|
| 0 | 32 | 3 | 35 |
| 1 | 37 | 28 | 65 |
| N | 69 | 31 | 100 |
| lung dis. | ABC | D | All |
| 0 | 8 | 20 | 28 |
| 1 | 61 | 11 | 72 |
| 69 | 31 | 100 |
Table 10
The division of patients to ABC and D group was further quantified using the classification algorithm proposed by Breimen
| s.h.d. | EF% | ABC | D | All |
|---|---|---|---|---|
| 0 | <55% | 9 | 1 | 10 |
| >55% | 23 | 2 | 25 | |
| 1 | <55% | 10 | 18 | 28 |
| >55% | 27 | 10 | 37 | |
| All | 69 | 31 | 100 |
The division of patients to ABC and D group was further quantified using the classification algorithm proposed by Breimen et al (19). The duration of intervention is the most decisive factor, followed by the history of lung disease and the effect of hypercapnia (pCO2). Indeed, if the intervention lasts less than 42.5 (6.522) minutes then a portion of 18 D patients and 4 ABC (wrongly arranged) is isolated. If the intervention lasts more than 42.5 minutes, then 57 patients suffering from pulmonary diseases form a distinct ABC group. If no lung disease is present, then 9 patients with relative blood pCO2 levels below 29.45% accumulate a distinct D group, while patients with relativized pCO2>29.45% arrange a group of 7 ABC patients. In the group with lung disease the duration of the procedure was the most important factor indifferent whether navigation was used or not. Figure 21. Table 11,12.
Binary regression
The three model responses are shown in the table below. What really matters is the deviance R2 which shows how reliable is the model under study, the p-value (and the corresponding Z) of each predictor (the lower its value the more explainable the predictor), the % success of classification matrix and the odds of each predictor which are related with the regression coefficients as odds= inverse loge (coefficient).
Figure 21
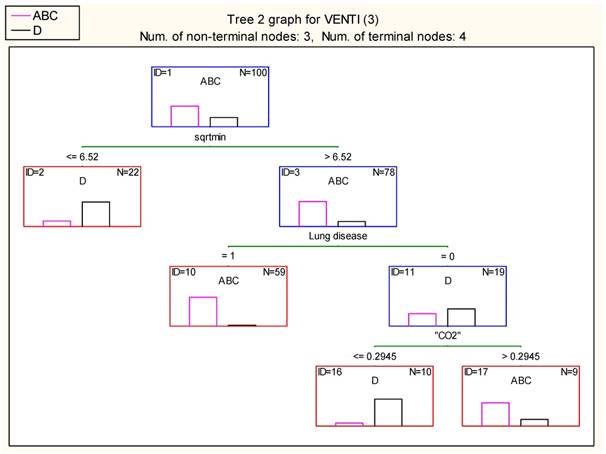
Minor misclassification of cases in each terminal node exists as the following table shows.
Table 11
Result of terminal nodes 2 (Spreadsheet1.sta) Dependent variable: VENTI (3) Options: Categorical response, Tree number 2
| Node # | Result of terminal nodes 2 (Spreadsheet1.sta) Dependent variable: VENTI (3) Options: Categorical response, Tree number 2 | ||
|---|---|---|---|
| ClassABC | ClassD | Gain | |
| 2 | 4 | 18 | 22.00000 |
| 10 | 57 | 2 | 59.00000 |
| 16 | 1 | 9 | 10.00000 |
| 17 | 7 | 2 | 9.00000 |
Table 12
The model predicts 94.12% of the ABC cases (64 out of 69) and 84.38% of the D cases (27 out of 31), see below.
| Classification matrix 2 (Spreadsheet1.sta) Dependent variable: VENTI (3) Options: Categorical response, Analysis sample | ||||
|---|---|---|---|---|
| Observed | Predicted ABC | Predicted D | Row Total | |
| Number | ABC | 64 | 5 | 69 |
| Column Percentage | 94.12% | 15.63% | ||
| Row Percentage | 92.75% | 7.25% | ||
| Total Percentage | 64.00% | 5.00% | 69.00% | |
| Number | D | 4 | 27 | 31 |
| Column Percentage | 5.88% | 84.38% | ||
| Row Percentage | 12.90% | 87.10% | ||
| Total Percentage | 4.00% | 27.00% | 31.00% | |
| Count | All Groups | 68 | 32 | 100 |
| Total Percent | 68.00% | 32.00% | ||
Interpretation
For coded variables (italic) the expression holds as follows (remember we compare ABC group versus D group):
Patients belonging to ABC group have 180.7 (times) higher probability to suffer from lung disease than those belonging to group D. Lung disease has a 180.7 higher probability of occurrence in the ABC group rather than in the D group of patients. Table 13.
Patients of ventilation mode ADC will be recorded with structural heart disease 0.131 times more than patients of group D. Because the odds is lower than one you would better comment the inverse situation simply by inverting the odds value: 1/0.131=7.63. That is, D-patients have 7.63 times higher probability of carrying s.h.d as compared to ABC-patients.
For quantitative variables (blue color), the unit of measurement plays important role. Thus for instance, if the length of operational time increases by 1 sqrt minute, the odds that the patient will be classified as ABC increases by 1.78 times (78%). Similarly, if the relative percentage change of pCO2 increases by 1%, the odds that the patient will be classified as ABC increases by 1.05 times (5%).
Table 13
Binary regression
| ABC/D | R2=58.68% | N=69/31 | ||||||
|---|---|---|---|---|---|---|---|---|
| Term | Coef | SE Coef | 95% CI | Odds ratio | 95% CI | Z-Value | P-Value | VIF |
| sqrtmin | 0.576 | 0.183 | 0.219- 0.934 | 1.78 | 1.24- 2.55 | 3.16 | 0.002 | 1.68 |
| CO2% | 0.048 | 0.015 | 0,018-0.077 | 1.05 | 1.018-1.080 | 3.15 | 0.002 | 1.59 |
| Lung disease | ||||||||
| 1 | 5.20 | 1.17 | 2.89- 7.50 | 180.7 | 18.1- 1805.7 | 4.42 | 0.000 | 2.31 |
| s.h. disease | ||||||||
| 1 | -2.03 | 1.03 | -4.05- -0.01 | 0.131 | 0.017- 0.986 | -1.97 | 0.048 | 1.27 |
| BC/D | R2=67.57% | N=57/31 | ||||||
| Term | Coef | SE Coef | 95% CI | Odds ratio | 95% CI | Z-Value | P-Value | VIF |
| sqrtmin | 0.608 | 0.211 | 0.195- 1.021 | 1.84 | 1.21- 2.78 | 2.89 | 0.004 | 1.89 |
| CO2% | 0.074 | 0.023 | 0.029- 0.119 | 1.08 | 1.029-1.126 | 3.19 | 0.001 | 2.29 |
| Lung disease | ||||||||
| 1 | 6.14 | 1.69 | 2.82- 9.45 | 463.1 | 16.8- 12764.0 | 3.63 | 0 | 3.28 |
| s.h. disease | ||||||||
| 1 | -2.94 | 1.45 | -5.79- -0.10 | 0.053 | 0.003- 0.908 | -2.03 | 0.043 | 1.77 |
| Coded EF-2 | ||||||||
| >55% | 2.099 | 0.981 | 0.176- 4.022 | 8.16 | 1.19- 55.83 | 2.14 | 0.032 | 1.33 |
| BC/AD | R2=32.96% | N=57/43 | ||||||
| Term | Coef | SE Coef | 95% CI | Odds ratio | 95% CI | Z-Value | P-Value | VIF |
| sqrtmin | 0.473 | 0.136 | 0.205- 0.740 | 1.605 | 1.228- 2.096 | 3.47 | 0.000 | 1.19 |
| CO2% | 0.026 | 0.0087 | 0.009-0.040 | 1.026 | 1.009-1.040 | 3.02 | 0.001 | 1.09 |
| Lung disease | ||||||||
| 1 | 2.766 | 0.699 | 1.396- 4.136 | 15.90 | 4.04- 62.56 | 3.96 | 0 | 1.29 |
Italics means categorical (coded) predictors.
Underline means quantitative predictors.
We address below the common predictor existed in the three models.
Comparative relationships between the three binary variables as affected by their common predictors. Table 14.
Table 14
Comparative relationships between the three binary variables as affected by their common predictors.
| Mode | sqrtmin | CO2 | Lung disease (1) |
|---|---|---|---|
| ABC/D | 1.78 | 116.2 | 180.7 |
| BC/D | 1.84 | 1600.1 | 463.1 |
| BC/AD | 1.60 | 13.9 | 15.9 |
Obviously, judging from the values in the table, see mode A; affects strongly negatively pCO2, reduces the operational time and loosely connects with historical lung disease.
The use of navigation is indifferent for the ventilation of the patient during the procedure.
As one has already realized in univariate analysis BMI, age and sex are not involved in the statistical results simply because the stepwise regression rejected those variables in all cases.
The models differed also in the prediction of the classified classes. Table 15.
Table 15
classified classes
| ABC/D (good prediction) | |||
|---|---|---|---|
| Classification of cases (Spreadsheet1.sta) Odds ratio: 53.333333 Log odds ratio: 3.976562 | |||
| Predicted: ABC | Predicted: D | Percent correct | |
| Observed: ABC | 64 | 5 | 92.7536232 |
| Observed: D | 6 | 25 | 80.6451613 |
| BC/D (excellent prediction) | |||
| Classification of cases (Spreadsheet2.sta) Odds ratio: 123.666667 Log odds ratio: 4.817590 | |||
| Predicted: D | Predicted: BC | Percent correct | |
| Observed: D | 28 | 3 | 90.3225806 |
| Observed: BC | 4 | 53 | 92.9824561 |
| BC/AD (modest prediction but still good enough) | |||
| Classification of cases (Spreadsheet1.sta) Odds ratio: 18.452381 Log odds ratio: 2.915193 | |||
| Predicted: BC | Predicted: AD | Percent correct | |
| Observed: BC | 50 | 7 | 87.7192982 |
| Observed: AD | 12 | 31 | 72.0930233 |
Conclusions
In the everyday practice pulmonary physicians use endoscopic procedures in order to diagnose mainly lung cancer. The main diagnostic endoscopic procedures are flexible bronchoscopy with or without radial-ebus [14], convex-probe ebus [15-17], flexible bronchoscopy with electromagnetic navigation and / or conebeam CT. [13, 14, 18] In order to perform these procedures we choose the proper sedation and ventilation method according to the site of the lesion and clinical characteristics of the patient. In specific comorbidities, such as chronic obstructive pulmonary disease, central mass, chronic heart failure and pleural/pericardial effusion are taken into account before performing the endoscopy. We want to avoid in most of our patients long term sedation mainly due to the underlying comorbidities which were previously described, however; at the same time we have to keep the airways open which is mainly accomplished when a rigid bronchoscope or a tracheal tube is used. Figure 22,23
Figure 22
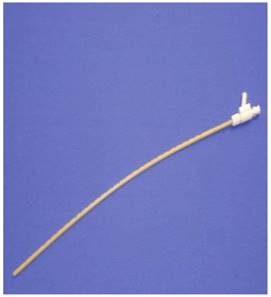
Jet-Nasal Catheter, red arrow indicates the connection point with the ventilator
Figure 23
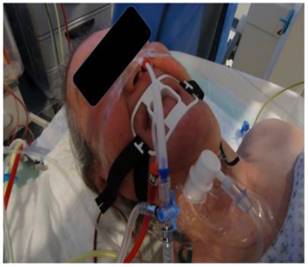
Patient with jet nasal catheter sedated during a diagnostic procedure.
The main issue during endoscopic procedures is to keep the pCO2 values as low as possible in order to prevent acidosis and at the same time to keep the pO2 sufficiently high.
According to the above mentioned detailed analysis in 100 all-comers real world patients undergoing SHFJV in interventional pulmonology, radiology or cardiology procedures we can state the following conclusions in regards to the above mentioned and well accepted safety thresholds:
I) Age, gender, BMI and LVEF did not show any effect in univariate or multivariate analysis in regards to the risk-thresholds of JV. This was especially surprising for BMI and LVEF.
II) As expected pCO2 was significantly and strongly correlated to pH. This statement is true for all measurements before and after intervention in all subsets of this database. Therefore high initial pCO2 values has a significant influence on the same value after the intervention. By lowering this parameter before any intervention in the sense of optimization it is possible to reduce the risk of JV in interventional medicine.
III) Although JV for navigational purposes as described with CBCT raise pCO2 values higher than non-navigational approaches there was no influence in univariate and multivariate analysis of blood gas parameters in regards to a potential risk scenario as described above by JV in comparison to the JV with non-navigational purposes. In other words: JV tends to increase modestly over time pCO2 in general but in univariate and multivariate analysis navigational purposes as described above (with intermittend low frequency ventilaton / apnea) do not enclose an additional risk.
IV) In contrast to the modest changings of pCO2 and pH in general there is a clear and highly significant observation that JV raises definetly pO2 enormously: Oxygenation is under JV no problem in any setting.
VI) Partly in contrast to univariate analysis, the multivariate analysis showed that
1 lung diseases play a crucial role in the ventilation effect irrespective of navigational purposes,
2 patients with a lung disease usually have a heart disease which may affect their ventilation,
3 in the group with lung disease the duration of the procedure was the most important factor for conquering the above-mentioned thresholds irrespective of navigational purposes and
4 that the use of navigation is indifferent for the ventilation effects during the procedure.
Over all according to the multivariate analysis duration of intervention is the most decisive factor for ventilation effects in patients with lung disease, followed by history of lung disease and the effect of hypercapnia (pCO2>50 mmHg). The longer the intervention is, the more is the risk to develop high pCO2. According to our dataset this occurs most probably when more than 42.5 minutes have been elapsed after intervention. According to our data we can speculate that there is no difference in risk of harming a patient when applying nasal jet-ventilation for navigational purposes for all three parameters although we apply periods of less CO2-clearance due to navigational purposes. In nasal jet ventilation the application of relaxation is dispensable so that the presence of an anesthesiologist is not required. Moreover; there is no correlation between the different comorbidities, lesion, diagnostic tools, BMI, age and sex: The use of nasal SHFJV is safe for different kind of interventions.
Competing Interests
The authors have declared that no competing interest exists.
References
1. Scheuermann-Freestone M, Freestone NS, Langenickel T, Hohnel K, Dietz R, Willenbrock R. A new model of congestive heart failure in the mouse due to chronic volume overload. European journal of heart failure. 2001;3:535-43
2. Leiter R, Aliverti A, Priori R, Staun P, Lo Mauro A, Larsson A. et al. Comparison of superimposed high-frequency jet ventilation with conventional jet ventilation for laryngeal surgery. British journal of anaesthesia. 2012;108:690-7 doi:10.1093/bja/aer460
3. Bohn D. The history of high-frequency ventilation. Respiratory care clinics of North America. 2001;7:535-48
4. Oulton JL, Donald DM. A ventilating laryngoscope. Anesthesiology. 1971;35:540-2
5. Norton ML, Strong MS, Vaughan CW, Snow JC, Kripke BJ. Endotracheal intubation and Venturi (jet) ventilation for laser microsurgery of the larynx. The Annals of otology, rhinology, and laryngology. 1976;85:656-63 doi:10.1177/000348947608500516
6. Smith RB, Babinski M, Petruscak J. A method for ventilating patients during laryngoscopy. The Laryngoscope. 1974;84:553-9 doi:10.1288/00005537-197404000-00006
7. Jonzon A, Oberg PA, Sedin G, Sjostrand U. High frequency low tidal volume positive pressure ventilation. Acta physiologica Scandinavica. 1970;80:21A-2A doi:10.1111/j.1748-1716.1970.tb04845.x
8. Heijman K, Heijman L, Jonzon A, Sedin G, Sjostrand U, Widman B. High frequency positive pressure ventilation during anaesthesia and routine surgery in man. Acta anaesthesiologica Scandinavica. 1972;16:176-87
9. Barth L. [Therapeutic use of diffusion breathing in bronchoscopy]. Der Anaesthesist. 1954;3:227-9
10. Aloy A, Schachner M, Spiss CK, Cancura W. [Tube-free translaryngeal superposed jet ventilation]. Der Anaesthesist. 1990;39:493-8
11. Sutterlin R, Priori R, Larsson A, LoMauro A, Frykholm P, Aliverti A. Frequency dependence of lung volume changes during superimposed high-frequency jet ventilation and high-frequency jet ventilation. British journal of anaesthesia. 2014;112:141-9 doi:10.1093/bja/aet260
12. Minana G, Nunez J, Banuls P, Sanchis J, Nunez E, Robles R. et al. Prognostic implications of arterial blood gases in acute decompensated heart failure. European journal of internal medicine. 2011;22:489-94 doi:10.1016/j.ejim.2011.01.014
13. Hohenforst-Schmidt W, Banckwitz R, Zarogoulidis P, Vogl T, Darwiche K, Goldberg E. et al. Radiation Exposure of Patients by Cone Beam CT during Endobronchial Navigation - A Phantom Study. Journal of Cancer. 2014;5:192-202 doi:10.7150/jca.8395
14. Zaric B, Stojsic V, Carapic V, Kovacevic T, Stojanovic G, Panjkovic M. et al. Radial Endobronchial Ultrasound (EBUS) Guided Suction Catheter-Biopsy in Histological Diagnosis of Peripheral Pulmonary Lesions. Journal of Cancer. 2016;7:7-13 doi:10.7150/jca.13081
15. Huang H, Huang Z, Wang Q, Wang X, Dong Y, Zhang W. et al. Effectiveness of the Benign and Malignant Diagnosis of Mediastinal and Hilar Lymph Nodes by Endobronchial Ultrasound Elastography. Journal of Cancer. 2017;8:1843-8 doi:10.7150/jca.19819
16. Oezkan F, Khan A, Zarogoulidis P, Hohenforst-Schmidt W, Theegarten D, Yasufuku K. et al. Efficient utilization of EBUS-TBNA samples for both diagnosis and molecular analyses. OncoTargets and therapy. 2014;7:2061-5 doi:10.2147/OTT.S72974
17. Zarogoulidis P, Huang H, Bai C, Kosmidis C, Trakada G, Veletza L. et al. Endobronchial ultrasound convex probe for lymphoma, sarcoidosis, lung cancer and other thoracic entities. A case series. Respiratory medicine case reports. 2017;22:187-96 doi:10.1016/j.rmcr.2017.08.016
18. Hohenforst-Schmidt W, Zarogoulidis P, Vogl T, Turner JF, Browning R, Linsmeier B. et al. Cone Beam Computertomography (CBCT) in Interventional Chest Medicine - High Feasibility for Endobronchial Realtime Navigation. Journal of Cancer. 2014;5:231-41 doi:10.7150/jca.8834
Author contact
![]() Corresponding author: Paul Zarogoulidis, MD, Ph. D, Pulmonary-Oncology Department, ``Theageneio`` Cancer Hospital, Thessaloniki, Greece. Mobile: 00306977271974; E-mail: pzarogcom
Corresponding author: Paul Zarogoulidis, MD, Ph. D, Pulmonary-Oncology Department, ``Theageneio`` Cancer Hospital, Thessaloniki, Greece. Mobile: 00306977271974; E-mail: pzarogcom
Citation styles
APA
Hohenforst-Schmidt, W., Zarogoulidis, P., Huang, H., Man, Y.G., Laskou, S., Koulouris, C., Giannakidis, D., Mantalobas, S., Florou, M.C., Amaniti, A., Steinheimer, M., Sinha, A., Freitag, L., Turner, J.F., Browning, R., Vogl, T., Roman, A., Benhassen, N., Kesisoglou, I., Sapalidis, K. (2018). A New and Safe Mode of Ventilation for Interventional Pulmonary Medicine: The Ease of Nasal Superimposed High Frequency Jet Ventilation. Journal of Cancer, 9(5), 816-833. https://doi.org/10.7150/jca.23737.
ACS
Hohenforst-Schmidt, W.; Zarogoulidis, P.; Huang, H.; Man, Y.G.; Laskou, S.; Koulouris, C.; Giannakidis, D.; Mantalobas, S.; Florou, M.C.; Amaniti, A.; Steinheimer, M.; Sinha, A.; Freitag, L.; Turner, J.F.; Browning, R.; Vogl, T.; Roman, A.; Benhassen, N.; Kesisoglou, I.; Sapalidis, K. A New and Safe Mode of Ventilation for Interventional Pulmonary Medicine: The Ease of Nasal Superimposed High Frequency Jet Ventilation. J. Cancer 2018, 9 (5), 816-833. DOI: 10.7150/jca.23737.
NLM
Hohenforst-Schmidt W, Zarogoulidis P, Huang H, Man YG, Laskou S, Koulouris C, Giannakidis D, Mantalobas S, Florou MC, Amaniti A, Steinheimer M, Sinha A, Freitag L, Turner JF, Browning R, Vogl T, Roman A, Benhassen N, Kesisoglou I, Sapalidis K. A New and Safe Mode of Ventilation for Interventional Pulmonary Medicine: The Ease of Nasal Superimposed High Frequency Jet Ventilation. J Cancer 2018; 9(5):816-833. doi:10.7150/jca.23737. https://www.jcancer.org/v09p0816.htm
CSE
Hohenforst-Schmidt W, Zarogoulidis P, Huang H, Man YG, Laskou S, Koulouris C, Giannakidis D, Mantalobas S, Florou MC, Amaniti A, Steinheimer M, Sinha A, Freitag L, Turner JF, Browning R, Vogl T, Roman A, Benhassen N, Kesisoglou I, Sapalidis K. 2018. A New and Safe Mode of Ventilation for Interventional Pulmonary Medicine: The Ease of Nasal Superimposed High Frequency Jet Ventilation. J Cancer. 9(5):816-833.
This is an open access article distributed under the terms of the Creative Commons Attribution (CC BY-NC) license (https://creativecommons.org/licenses/by-nc/4.0/). See http://ivyspring.com/terms for full terms and conditions.