Journal of Cancer
ISSN: 1837-9664
3.2
Impact Factor
ISSN: 1837-9664

 Global reach, higher impact
J Cancer 2018; 9(21):4039-4048. doi:10.7150/jca.25280 This issue Cite
Research Paper
Tongue Coating Microbiota Community and Risk Effect on Gastric Cancer
Juan Wu1, Shuo Xu1, Chunjie Xiang1, Qinhong Cao2, Qiyi Li1, Jiaqian Huang1, Liyun Shi1, Junfeng Zhang1,3 ![]() , Zhen Zhan1,3
, Zhen Zhan1,3 ![]()
1. School of Medicine and Life Sciences, Nanjing University of Chinese Medicine, 138 Xianlin Road, Nanjing 210023, China
2. Department of Digestive Tumor Surgery, Jiangsu Province Hospital of Traditional Chinese Medicine, Affiliated Hospital of Nanjing University of Chinese Medicine, Nanjing, China
3. Jiangsu Collaborative Innovation Center Medicine (TCM) Prevention and Treatment of Tumor, Nanjing University of Chinese Medicine, 138 Xianlin Road, Nanjing 210023, China
Received 2018-2-1; Accepted 2018-8-25; Published 2018-10-17
Citation:
Wu J, Xu S, Xiang C, Cao Q, Li Q, Huang J, Shi L, Zhang J, Zhan Z. Tongue Coating Microbiota Community and Risk Effect on Gastric Cancer. J Cancer 2018; 9(21):4039-4048. doi:10.7150/jca.25280. https://www.jcancer.org/v09p4039.htm
Other stylesAbstract
Background: Although oral hygiene and health have long been reported to be associated with increased risk of gastric cancer (GC), the direct relationship of oral microbes with the risk of GC have not been evaluated fully. We aimed to test whether tongue coating microbiome was associated with GC risk.
Methods: Pyrosequencing of 16S rRNA gene of tongue coating microbiome was used in 57 newly diagnosed gastric adenocarcinomas and 80 healthy controls. Benjamini-Hochberg (BH) was applied for multiple comparison correction. Co-abundance group (CAGs) analysis was adopted.
Results: We found that higher relative abundance of Firmicutes, and lower of Bacteroidetes were associated with increased risk of GC. In genus level, Streptococcus trended with a higher risk of GC, the four other genera (Neisseria, Prevotella, Prevotella7, and Porphyromonas) were found to have a decreased risk of GC. Different from overall GC and non-cardia cancer, Alloprevotella and Veillonella trended with the higher risk of cardia cancer. Finally, we analyzed the microbiota by determining CAGs and six clusters were identified. Except the Cluster 2 (mainly Streptococcus and Abiotrophia), the other clusters had an inverse association with GC. Of them, the Cluster 6 (mainly Prevotella and Prevotella7 etc) had a relatively good classification power with 0.76 of AUC.
Conclusion: Microbiome in tongue coating may have potential guiding value for early detection and prevention of GC.
Keywords: Gastric cancer, Tongue coating, Microbiota, Case-control, Biomarkers
Introduction
Gastric cancer (GC) was the third most common malignancy, with 679,000 new cases and 498,000 deaths occurred in China in 2015 [1]. It was well documented that environmental factors played a vital role in the pathogenesis of GC. Well-recognized risk environment elements include low fresh vegetable and fruit consumption, salted preserved food intake, alcohol drinking, tobacco smoking and Helicobacter pylori (HP) infection, et al. Among these, HP is a pathogenic microorganism and was recognized as Class I carcinogen by WHO in 1994. Besides those, host interaction with the environmental expose was also explored by a variety of studies [2-4], yet these only partially explain risk for GC. There is a critical need to better understand the causes of GC and to provide some guidance for preventive measures.
Recently, an ever-growing number of studies have demonstrated that changes in the composition of our microbiome relate to numerous disease states, raising the possibility that manipulation of these communities could be used to treat disease. With the implement and progress of human microbiology project, bacterial dysbiosis in different sites on the human body was frequently found to be involved in the pathogenesis of several chronic diseases, such as diabetes, coronary heart disease, oral cavity and oropharyngeal tumors, et al [5-7]. Whether bacteria community variation in the human body has a risk effect on GC is required to be explored deeply.
In some large-scale epidemiological surveys, the strong risk associations between periodontal disease, tooth loss, and GC were observed both in prospective and retrospective studies [8, 9]. The reasonable explanation was not yet fully clarified. The oral cavity acts as the initial point of entry to the human digestive tract and is the home of a various microbial community of more than 700 bacterial species including at least 11 bacterial phyla and 70 genera [10]. An imbalance in the oral microbiota was associated with oral infections including dental caries and was thought to be the triggering factor of periodontal diseases [11, 12] which was linked with systemic disorders such as, cardiovascular disease [13], diabetes, pulmonary disease, pancreatitis and tumors [14, 15]. Oral bacteria contribute to the systemic conditions through bacteremia, which could be found in the atherosclerotic plaque and pancreatic bile duct [16, 17]. Furthermore, the oral microbiome may impact the bacteria that colonize the esophagus, gastric and gut, e.g., some lactobacilli found in human feces are allochthonous to the intestine and originate from the oral cavity [18].
As a major habitat for human microbiome, the mouth is an open system and contains a variety of microbial habitats including teeth, tongue, gingival sulcus, cheek and both hard and soft palates which contribute to its vast ecological complexity [19]. A study quantified the daily, weekly, and monthly variability of the oral microbiome in healthy individuals and found that teeth and supragingival plaque were more susceptible to oral hygiene habits (e.g., tooth brushing and flossing). On the contrary, within-sample diversity levels were consistent in the tongue and the communities in the salivary and tongue plaque have a high similarity [19]. In addition, most of the high-abundance OTUs found in saliva were derived from the tongue. In Traditional Chinese Medicine (TCM), tongue coating (color, thickness and/or appearance) was an important index for the doctor to identify health status in Traditional Chinese Medicine (TCM), known as tongue diagnosis [20]. Tongue coating constitutes a large surface area for microbes shedding and cellular desquamation [21]. Despite the amount of community drift, the composition of the abundant microbiota in tongue could reflect some personalized features and disease conditions of the body [22-24]. Oral microorganisms, especially on tongue coating, related with up-regulated cytokines and other inflammatory mediators that affect the complex metabolic pathways and may thus be involved in carcinogenesis [10].
In this study, we performed a comprehensive comparison of the oral microbiota in human tongue coating from GC patients and healthy controls by 16S rRNA gene pyrosequencing. Furthermore, we evaluated the performance and potential translational utilities of tongue dorsum microbial signatures as an additional biomarker for non-invasive early detection for GC.
Methods
Study population
Newly diagnosed GC without initiating the treatment were recruited during 2011 to 2012 in Jiangsu Province Hospital of TCM, and all the GC cases were histologically confirmed adenocarcinoma. The control subjects were recruited from the physical examination department of the same hospital. Exclusion criteria for GC patients were as follows: (1) Chemotherapy or radiation therapy initiated prior to tongue coating collection; (2) Complicated with other malignancies within 5 years; (3) Antibiotics or proton pump inhibitors used within 2 weeks.
The healthy controls with no gastric diseases were matched to the GC cases by age (±5 years) and gender, and the exclusion criteria for the controls were (1) Using antibiotics or proton pump inhibitors within two weeks; (2) Complicated with any malignancies; (3) With digestive system diseases. Written informed consents were obtained from all the participants, and this study was approved by the Institutional Review Board of Jiangsu Province Hospital of TCM.
Tongue coating sample collection and DNA extraction
Before tongue coating sample collection, all participants were required to rinse their mouths with sterile saline buffer. The midline scrapings of tongue dorsum were collected by sterile swabs for 3 times. Then the sterile swabs were soaked in tubes with 1 mL phosphate-buffered saline to wash off the tongue scrapings adsorbed on the swabs. The tubes were centrifuged at 5000 rpm for 5 minutes, and the precipitates were finally collected. Samples were immediately preserved at -80 ˚C for storage. DNA of the Tongue coating microbiota was extracted by using E.Z.N.A Soil DNA Kit (Omega Bio-Tek, Inc, GA, US). The integrity of the genomic DNA was assessed by electrophoresis (1% agarose gel).
Community 16S rRNA gene pyrosequencing
The primers targeted V4 region of bacterial 16S rRNA gene were used for amplification. The forward primer was 27F 5' -AGA GTT TGA TCC TGG CTC AG-3', and the reverse primer was 533R 5' -TTA CCG CGG CTG CTG GCA C-3'. The experiment was performed on the ABI GeneAmp 9700 (ABI Inc, US), and the amplification program was as follows: Step 1, 95˚C for 2 minutes; Step 2 for 25 cycles, 95 ˚C for 30 seconds, and 55 ˚C for 30 seconds; Step 3, 72 ˚C for 30 seconds, and with a final incubation at 72 ˚C for 5 minutes. Each PCR reaction was performed in triplicate, and the reaction volume was 20 μL mixture consisting of 4 μL of 5× Fast Pfu Buffer, 2 μL of 2.5 mM dNTPs, 0.4 μL of each primer (5 μM), 0.4 μL of FastPfu Polymerase, and 10 ng of template DNA, and ddH2O added up to 20μL.
The target amplicons were extracted by electrophoresis with 2% agarose gels, and purified by the AxyPrep DNA Gel Extraction Kit (Axygen Biosciences, Union City, CA, US) according to the manufacturer's instructions. The purified amplicons were pooled in equimolar amounts, and emulsion-based clonal amplification (emPCR) was carried out using Roche emPCRAmp-Lib_L Kit, and the target amplicons were sequenced by Roche Genome Sequencer FLX+ Instrument. Sequences were processed and analyzed using QIIME as previously described by Geng [25]. Human Oral Microbiome Database (HOMD) was used for the tongue coating microbiota taxonomy.
Statistical analysis
The relationship between overall tongue coating microbiota composition and gastric cancer was assessed by weighed and un-weighed Unifrac analysis of the distance matrix with 10,000 permutations [26]. To visualize separation of subjects based on pairwise distances, principal coordinate analysis (PCoA) plots were generated for showing the first two principal coordinates. Permutational multivariate analysis of variance (PERMANOVA, “Adonis” function, vegan package, R) of the Unifrac distance matrics was used to compare differences in overall tongue scraping microbiome composition between GC and the controls. We extensively compared the bacterial taxa (phylum to genus) between GC cases and the controls. The bacterial taxa (phylum to genus) with mean relative abundance was set for ≥ 0.01%. Our analysis included 9 phyla, 18 classes, 27 orders, 49 families and 88 genera. The categorical data was analyzed by Chi-square or Fisher's exact test. The continuous data was compared by independent t-test or non-parametric rank test. Benjamini-Hochberg (BH) was applied for multiple comparison correction. To quantify the uncertainty of significant results, bootstrap was used by generating 1,000 simulations from the original relative abundance data sets. P value of less than 0.05 was considered as statistically significant. Analyses were carried out using R (Version 3.4.2) and SPSS for Windows (version 21.0).
Results
Demographic characteristic of 57 GC cases and 80 healthy controls are shown in Table 1. The age and gender were matched between the two groups (P=0.06 and 0.35, respectively). There were also no significant differences in smoking and drinking status between GC cases and controls (P=0.28 and 0.13, respectively). According to the original tumor site, there are 20 cases of cardiac cancer, 35 cases of non-cardia cancer, and 2 cases of mixed cancer.
Table 1
Distribution of demographic characteristics among GC cases and controls
| Characteristic | Cases (n=57) | Controls (n=80) | P-value |
|---|---|---|---|
| Age, mean±SD, years | 59.14 (±13.30) | 55.38 (±13.19) | 0.06 |
| Sex, % | 0.35 | ||
| Male | 40 (70.2) | 50 (62.5) | |
| Female | 17 (29.8) | 30 (37.5) | |
| Smoking, % | 0.28 | ||
| Yes | 20 (35.1) | 23 (28.8) | |
| No | 33 (57.9) | 57 (71.3) | |
| Missing | 4 (7.0) | 0 (0) | |
| Drinking, % | 0.13 | ||
| Yes | 11(19.3) | 9 (11.3) | |
| No | 42 (73.7) | 71 (88.8) | |
| Missing | 4 (7.0) | 0 (0) | |
| Cancer site, % | |||
| Cardia | 20 (35.1) | ||
| Non-cardia | 35 (61.4) | ||
| Missing | 2 (3.5) |
All the samples yielded 1,091,717 reads after quality filtering with an average 7,968.74 (standard deviation, 1,433.57) reads per sample (minimum of 5,744, maximum of 168, 23). The refined reads were clustered into 2,104 operational taxonomic units (OTUs) at 97% similarity. We compared the alpha diversity between the GC and control group, and the ACE, Chao1 value was significantly higher in control group (P=1.50e-5, and 2.45e-4, respectively), however, other alpha diversity indices such as Shannon, Simpson, coverage and reads were not statistically different between two groups (All P>0.05), see table 2. Interestingly, in the stratified analysis, we found Simpson index was significantly higher in the control group among the drinking individuals (P=0.012) (table 3).
Table 2
Alpha diversity indices among gastric cancer cases and controls
| Cases (n=57) | Controls (n=80) | P-value* | |
|---|---|---|---|
| Ace, Mean (SD) | 524.71 (143.44) | 632.41 (134.52) | 1.494e10-5 |
| Chao1, Mean (SD) | 477.94 (109.59) | 543.88 (94.38) | 2.451e10-4 |
| Shannon+, median (interquartile) | 3. 802 (0.616) | 3.735 (0.698) | 0.265 |
| Simpson+, median (interquartile) | 0.057 (0.051) | 0.074(0.074) | 0.081 |
| Coverage, Mean (SD) | 0.982 (0.006) | 0.981 (0.005) | 0.177 |
| Reads+, median (interquartile) | 7620.00 (1398) | 7917.50 (2023) | 0.221 |
| No. observed species, Mean (SD) | 104.5 (23.16) | 112.05 (24.54) | 0.192 |
+non-parametric test
Table 3
Stratified analysis of alcohol consumption on Shannon and Simpson indices
| Shannon | P value | Simpson | Pa value | |||
|---|---|---|---|---|---|---|
| GC cases | controls | GC cases | controls | |||
| Drinking | ||||||
| Yes | 3.75(0.37) | 3.46(0.36) | 0.095 | 0.068(0.022) | 0.12(0.06) | 0.012 |
| No | 3.71(0.53) | 3.64(0.51) | 0.399 | 0.084(0.066) | 0.094(0.07) | 0.189 |
anon-parametric test
Figure 1
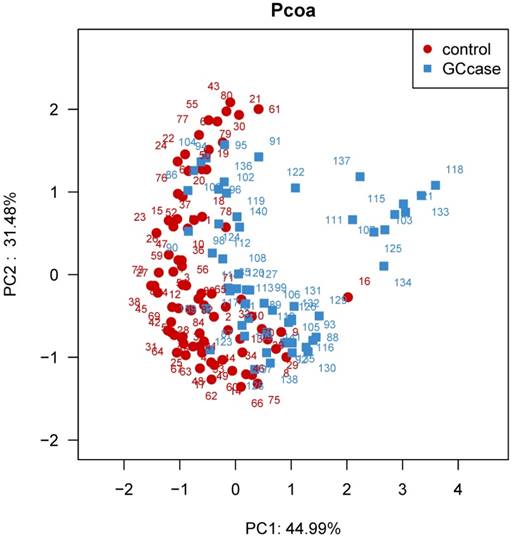
Principal coordinate analysis (PCoA) based on the weighted UniFrac distance of tongue coating microbiota among all individuals. The weighted UniFrac distance was significantly different between the two groups (P<0.0001).
We further examined overall microbiota composition in relation to subsequent risk of GC. The first and second components of PCoA based on weighted UniFrac distance revealed significant differences with GC and that of controls (P<0.0001) (see figure 1). We carried out a comparison between GC cases and controls of the relative abundance of tongue coating bacterial taxa on phylum and genus levels. We found that patients with GC had an increased relative abundance of Firmicutes, and lower relative abundance of Bacteroidetes compared with healthy subjects (P adjusted for BH=0.005 and 3.6e-5, respectively). The lower Bacteroidetes/ Firmicutes ratio also exited in the non-cardia patients, however, in the cardia cancer patients, the Bacteroidetes/ Firmicutes ratio was not significantly different from that of healthy controls (Table 4). Of all the 34 statistically different genera between the two groups, 17 genera belong to the phylum Firmicutes, 9 belong to the phylum Proteobacteria, 3 belong to phylum Bacteroidetes, 2 belong to phylum Actinobacteria and 3 other phyla. GC patients have a higher relative abundance of genus Streptococcus and Abiotrophia (P=0.0045 and 0.0045 for BH correction, respectively). Relative abundance of all the other genera was higher in the control individuals than that of GC patients. The higher relative abundance of Streptococcus was also found in non-cardia GC patients compared with control subjects (P=0.017), however, the risk effect of Streptococcus was not obvious in the cardia GC patients (P>0.05). Besides Streptococcus, Ochrobactrum and Achromobacter were also found with higher relative abundance in non-cardia patients than the control group (P=0.002 and 0.009 for BH correction, respectively). Different from those genus in non-cardia patients, the relative abundance of Abiotrophia, Alloprevotella, and Veillonella was higher in cardia patients than the control group (P=0.002, 0.002 and 0.02 for BH correction, respectively) (table 5-7).
Table 4
Median relative abundance of phylum level in controls, GC, cardia and non-cardia cases
| phylum | controls | GC cases | P* | Non-cardia | P* | cardia | P* |
|---|---|---|---|---|---|---|---|
| Bacteroidetes | 41.73 | 34.44 | 0.00004 | 32.8 | 0.00017 | 35.94 | 0.126 |
| Firmicutes | 22.94 | 29.49 | 0.005 | 30.7 | 0.018 | 25.9 | 0.135 |
| Proteobacteria | 19.44 | 21.67 | 0.904 | 23.69 | 0.675 | 20.38 | 0.775 |
| Fusobacteria | 3.93 | 4.00 | 0.84 | 3.78 | 0.462 | 5.84 | 0.775 |
| Actinobacteria | 2.59 | 3.31 | 0.413 | 3.68 | 0.362 | 3.3 | 0.626 |
| Saccharibacteria | 0.22 | 0.16 | 0.254 | 0.074 | 0.023 | 0.23 | 0.775 |
| Tenericutes | 0.02 | 0.00 | 0.275 | 0.00 | 0.047 | 0.02 | 0.915 |
| candidatedivisionSR1 | 0.08 | 0.01 | 0.009 | 0.012 | 0.018 | 0.023 | 0.378 |
| Spirochaetae | 0.01 | 0.00 | 0.904 | 0.00 | 0.387 | 0.03 | 0.366 |
*corrected by Benjamini-Hochberg.
Table 5
Median relative abundance of genus level in GC cases and controls
| Genus | Controla | GC casea | P* |
|---|---|---|---|
| Prevotella7 | 24.759±21.18 | 13.657±19.58 | 1.89e-04 |
| Neisseria | 15.666±24.36 | 6.290±19.98 | 9.33e-04 |
| Prevotella | 6.264±4.47 | 4.199±5.01 | 3.24e-05 |
| Streptococcus | 4.583±4.28 | 7.357±7.63 | 0.004 |
| Porphyromonas | 2.816±6.66 | 1.054±3.76 | 0.002 |
| P5D1392_norank | 1.555±1.46 | 0.7±1.47 | 2.91e-04 |
| Eubacteriumoxidoreducensgroup | 0.758±1.01 | 0.268±0.81 | 9.33e-04 |
| Lachnoanaerobaculum | 0.460±0.34 | 0.219±0.31 | 6.84e-06 |
| ErysipelotrichaceaeUCG007 | 0.468±0.51 | 0.085±0.22 | 2.58e-09 |
| Oribacterium | 0.323±0.36 | 0.203±0.32 | 6.72e-04 |
| Stomatobaculum | 0.351±0.52 | 0.133±0.27 | 2.52e-04 |
| Atopobium | 0.2674±0.65 | 0.1023±0.24 | 0.002 |
| Haemophilus | 0.2107±0.36 | 0.1161±0.38 | 0.022 |
| Peptostreptococcus | 0.1971±0.22 | 0.108±0.27 | 0.006 |
| Eubacteriumnodatumgroup | 0.185±0.21 | 0.101±0.17 | 1.89e-04 |
| LachnospiraceaeUCG008 | 0.1026±0.21 | 0.0361±0.11 | 0.002 |
| CandidatedivisionSR1_norank | 0.0792±0.44 | 0.0148±0.18 | 0.005 |
| RuminococcaceaeUCG014 | 0.0544±0.14 | 0.0386±0.09 | 0.042 |
| Lachnospiraceae_uncultured # | 0.0463±0.13 | 0.0000±0.05 | 0.002 |
| 16d63.751_norank | 0.004±0.03 | 0.090±0.26 | 1.84e-08 |
| CandidatusSaccharimonas | 0.0282±0.05 | 0.0153±0.05 | 0.042 |
| MollicutesRF9_norank # | 0.0137±0.04 | 0.000±0.02 | 0.014 |
| Pseudomonas # | 0.0172±0.13 | 0.0000±0.02 | 0.002 |
| Serratia # | 0.012±0.03 | 0.000±0.01 | 0.002 |
| FamilyXIII_uncultured # | 0.0119±0.03 | 0.000±0.01 | 0.011 |
| Brevundimonas # | 0.0049±0.05 | 0.000±0.01 | 0.041 |
| Abiotrophia# | 0.0000±0.01 | 0.0129±0.04 | 0.005 |
| Corynebacterium# | 0.0000±0.01 | 0.0124±0.03 | 0.041 |
| Lactobacillus# | 0.000±0.00 | 0.000±0.02 | 0.006 |
| Anaeroglobus# | 0.000±0.00 | 0.00±0.00 | 0.049 |
| Rhizobium# | 0.000±0.02 | 0.0193±1.04 | 0.005 |
| Sphingomonas# | 0.000±0.00 | 0.000±0.00 | 1.46e-05 |
| Delftia# | 0.0000±0.01 | 0.000±0.00 | 0.004 |
| Eikenella# | 0.000±0.00 | 0.000±0.02 | 0.016 |
*corrected by Benjamini-Hochberg; adata presented by median±interquartile; #data on GC cases and/or controls 0.000 means less than 0.001.
Table 6
Median relative abundance of genus level in cardia cancer cases and controls
| Genus | Controla | Cardia cancer casea | P* |
|---|---|---|---|
| Prevotella7 | 24.7594±21.18 | 14.9145±16.05 | 0.013 |
| Neisseria | 15.6660±24.36 | 7.3554±20.69 | 0.023 |
| Veillonella | 10.9049±5.1940 | 16.2726±9.9142 | 0.028 |
| Prevotella | 6.2635±4.47 | 3.8508±5.19 | 0.041 |
| Alloprevotella | 4.6525±4.89 | 7.9127±9.16 | 0.007 |
| P5D1392_norank | 1.5554±1.46 | 1.0663±1.10 | 0.041 |
| ErysipelotrichaceaeUCG007 | 0.4658±0.51 | 0.1642±0.25 | 0.005 |
| Lachnoanaerobaculum | 0.4604±0.34 | 0.2657±0.24 | 0.005 |
| Oribacterium | 0.3233±0.36 | 0.2333±0.26 | 0.023 |
| Stomatobaculum | 0.3514±0.52 | 0.1808±0.3 | 0.039 |
| Haemophilus | 0.2107±0.36 | 0.069±0.26 | 0.041 |
| Pseudomonas | 0.0172±0.13 | 0.000±0.02 | 0.020 |
| Serratia | 0.0118±0.03 | 0.000±0.00 | 0.015 |
| @16d63.751_norank | 0.0043±0.03 | 0.0718±0.19 | 0.003 |
| Sphingomonas# | 0.000±0.00 | 0.000±0.1 | 0.005 |
| Abiotrophia# | 0.000±0.01 | 0.0322±0.05 | 0.007 |
| Corynebacterium# | 0.000±0.01 | 0.0165±0.19 | 0.011 |
| Shuttleworthia# | 0.000±0.00 | 0.000±0.02 | 0.023 |
| comamonas# | 0.000±0.00 | 0.000±0.03 | 0.037 |
| Delftia# | 0.000±0.01 | 0.000±0.00 | 0.038 |
*corrected by Benjamini-Hochberg; adata presented by median±interquartile; #data on GC cases and/or controls 0.000 means less than 0.001.
Table 7
Median relative abundance of genus level in non-cardia cancer cases and controls
| Genus | Controla | Non-cardia cancer casea | P* |
|---|---|---|---|
| Prevotella7 | 24.7594±21.18 | 11.29±22.30 | 3.60e-04 |
| Neisseria | 15.666±24.36 | 6.29±23.93 | 0.002 |
| Prevotella | 6.2635±4.47 | 2.6967±5.46 | 9.38e-06 |
| Streptococcus | 4.5826±4.28 | 6.5344±7.6 | 0.017 |
| Porphyromonas | 2.8162±6.66 | 0.4236±2.66 | 8.19e-05 |
| P5D1392_norank | 1.5554±1.46 | 0.3913±1.58 | 1.47e-05 |
| Eubacteriumoxidoreducensgroup | 0.7583±1.01 | 0.1794±0.76 | 2.30e-04 |
| ErysipelotrichaceaeUCG007 | 0.4685±0.51 | 0.0502±0.17 | 9.61e-10 |
| Lachnoanaerobaculum | 0.4604±0.34 | 0.1951±0.30 | 1.02e-05 |
| Stomatobaculum | 0.3514±0.52 | 0.0910±0.25 | 6.00e-05 |
| Oribacterium | 0.3233±0.36 | 0.2033±0.36 | 0.001 |
| Atopobium | 0.2674±0.65 | 0.0978±0.24 | 0.001 |
| Solobacterium | 0.2368±0.29 | 0.1160±0.23 | 0.011 |
| Peptostreptococcus | 0.1971±0.22 | 0.1053±0.24 | 0.003 |
| Saccharibacteria_norank | 0.1964±0.43 | 0.0577±0.38 | 0.031 |
| Eubacteriumnodatumgroup | 0.1848±0.21 | 0.091±0.16 | 4.36e-06 |
| LachnospiraceaeUCG008 | 0.1026±0.21 | 0.0193±0.08 | 2.24e-04 |
| CandidatedivisionSR1_norank | 0.0792±0.44 | 0.0124±0.12 | 0.004 |
| Achromobacter | 0.0691±0.22 | 0.2182±3.22 | 0.009 |
| RuminococcaceaeUCG014 | 0.0544±0.14 | 0.0251±0.06 | 0.005 |
| Mogibacterium | 0.0520±0.11 | 0.0171±0.06 | 0.006 |
| Lachnospiraceae_uncultured# | 0.0463±0.13 | 0.000±0.02 | 7.54e-05 |
| @16d63.751_norank | 0.0043±0.03 | 0.0925±0.26 | 5.90e-08 |
| CandidatusSaccharimonas | 0.0282±0.05 | 0.0126±0.04 | 0.019 |
| Ochrobactrum | 0.0188±0.09 | 0.2606±4.49 | 0.002 |
| Pseudomonas# | 0.0172±0.13 | 0.000±0.02 | 0.008 |
| MollicutesRF9_norank# | 0.0137±0.04 | 0.000±0.01 | 0.002 |
| FamilyXIII_uncultured# | 0.0119±0.03 | 0.000±0.00 | 2.68e-04 |
| Serratia# | 0.0118±0.03 | 0.000±0.01 | 0.007 |
| Kingella# | 0.0101±0.02 | 0.000±0.00 | 0.027 |
| Rhizobium# | 0.000±0.02 | 0.0651±1.34 | 2.41e-04 |
| Delftia# | 0.000±0.01 | 0.000±0.00 | 0.019 |
| Sphingomonas# | 0.000±0.00 | 0.000±0.05 | 9.61e-07 |
| Lactobacillus# | 0.000±0.00 | 0.000±0.03 | 0.008 |
| Eikenella# | 0.000±0.00 | 0.000±0.02 | 0.028 |
*corrected by Benjamini-Hochberg; #data on GC cases and/or controls 0.000 means less than 0.001; adata presented by median±interquartile.
We assumed that microbiota with relative abundance more than 1% in the genus level were considered as core tongue coating bacteria in the community related to the gastric cancer risk. Based on the enrolled samples (57 cases vs. 80 controls), we calculated the statistical power for each statistically significant genus with relative abundance more than 1%. The α (type I error) was set for 5%. For Prevotella7, Neisseria, Prevotella, Streptococcus, Porphyromonas, and P5D1392_norank, the statistical power was 83.67, 60.43, 76.06, 96.26, 96.89 and 92.52, respectively. Most of the statistical powers were more than 75%, and only one statistical power was below 75% in Neisseria (60.43%), which could be due to large data variance within group. In addition, the statistical powers for two phyla (Bacteroidetes and Firmicutes) were 85.24% and 82.89%, respectively. The resampling results by bootstrap indicated that the significant difference of Bacteroidetes and Firmicutes reached 98.3% and 85.8%, respectively. At the genus level, the proportions of significant outcomes of Prevotella, Neisseria, Prevotella7, Porphyromonas, Streptococcus were 98.6%, 86.3%, 97.1%, 81.6% and 75.9%, respectively (Figure S1).
Although several genera were significantly different between GC cases and controls, there was considerable heterogeneity, with no single genus being increased or decreased in all individuals with GC. We analyzed the microbiota by determining co-abundance group (CAGs) based on the Pearson correlation coefficient of the fold change of relative abundance of 34 genera in GC patients by hierarchical ward-linkage clustering since community structure can be more informative than abundance differences of individual taxa [27]. We identified six bacterial clusters (CAGs) and named as cluster 1 to cluster 6 (figure 2). Among these, cluster 1 and 2 were more abundant in GC patients, whereas other clusters (cluster 3 to 6) were significantly less abundant in the microbiota of individuals with GC (figure 3). When we use these clusters as potential diagnose markers, the area under receiver operating characteristic curve (ROC) was listed from the biggest to the smallest (cluster 6, 0.76; cluster 4, 0.692; cluster 5, 0.688; cluster 2, 0.66; cluster 3, 0.621; cluster 1, 0.57; respectively).
Figure 2
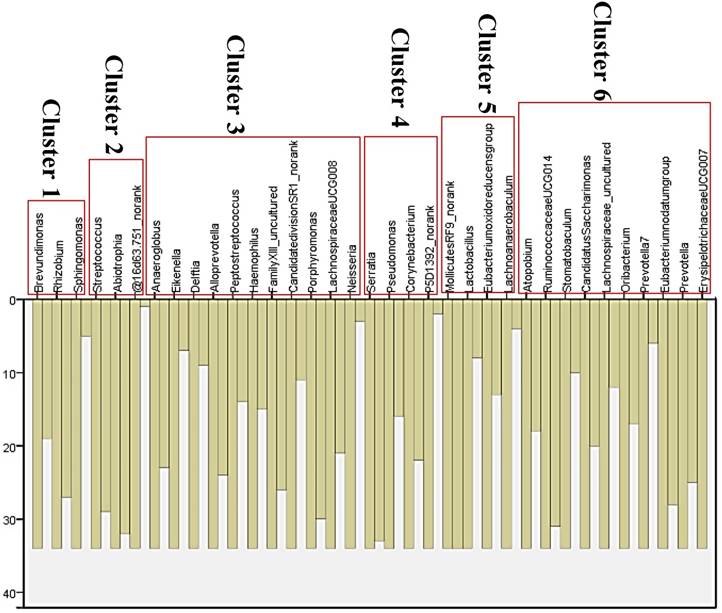
Vertical Icicle plot though Pearson correlation coefficient of the fold change of relative abundance of 34 genera in GC patients by hierarchical ward-linkage clustering. Six clusters were classified (cluster 1 to cluster 6).
Figure 3
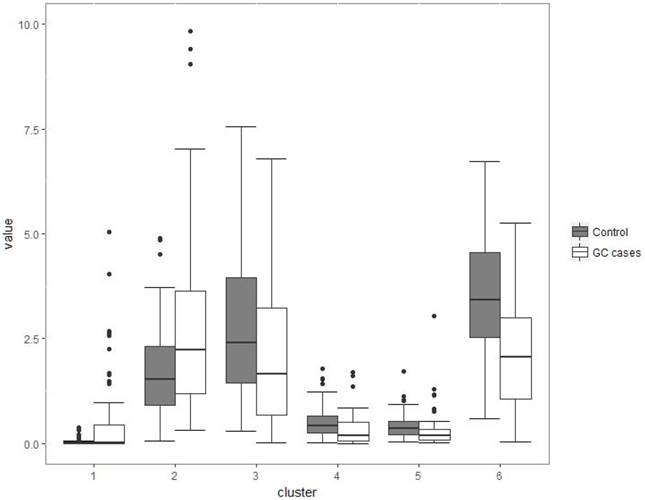
Boxplots of the relative abundance of six clusters (co-abundance group), named cluster 1 to cluster 6. Cluster 1 was not significantly different between two groups (P>0.05); Cluster 2 was of significantly increased relative abundance in GC (P<0.01); Other four clusters (3-6) were of significantly decreased relative abundance in GC (P<0.001).
Discussion
In this profiling study of tongue coating microbiota and GC risk, we observed the overall microbiota composition and diversity of GC cases was different from control subjects. Compared with previous studies [20, 23], the novelties of our study were as follows: (1) We use the co-abundance group (CAGs) instead of a specific genus to discriminate the GC patients and healthy controls, and the cluster 6 would be a potential diagnostic marker for GC with a sensitivity of 71.3% and a specificity of 70.3%; (2) Our study indicated the overall microbiota composition between GC patients and controls were different, and the GC cases had a lower alpha diversity and altered beta diversity; (3) The lower Bacteroidetes/ Firmicutes ratio existed in GC patients, especially in non-cardia cancer patients; (4) Genus Streptococcus and/or Abiotrophia would be the potential risk elements for GC.
At the phylum level, the GC cases had a higher relative abundance of Firmicutes, and lower abundance of Bacteroidetes compared to the healthy individuals. Interestingly, this lower Bacteroidetes/ Firmicutes ratio was not obvious in the cardia cancer patients. This may reflect the unique pathogenesis of cardia cancer. The genus Streptococcus was the common risk factor for overall gastric cancer and non-cardia cancer. The genus Abiotrophia, known as nutritionally variant Streptococcus, was found to be the common risk bacteria for overall gastric cancer and cardia cancer. The study of oral bacteria extends beyond the focus of oral disease to systemic disease and our findings confirm the oral microbiota may play some etiological role of GC, and tongue coating microbiota could be further explored to be a preventive target or biomarkers for early detection or risk assessment for GC.
In the oral cavity, Streptococcus can induce alcohol to be oxidized to acetaldehyde, a group I human carcinogen [28]. In mobile tongue cancer patients, a higher relative abundance of Streptococcus was observed in tumor tissue compared to normal tissue [29]. The risk association of Streptococcus with the upper digestive tumor was assessed by Chen and colleagues in 87 patients with esophageal squamous cell carcinoma and 85 healthy controls [30]. Further, the causality of Streptococcus of the esophageal adenocarcinoma was confirmed in a cohort study in U.S. population [31]. Streptococcus Anginosus DNA could also be found in gastric cancer tissues [32]. All those findings together with our results indicate the potential carcinogenic effect of Streptococcus in upper digestive cancer, including gastric cancer. Abiotrophia, nutritionally variant Streptococcus, was an important infectious agent of endocarditis and presence of salivary Abiotrophia could indicate the higher interleukin-1 beta level [33]. Although it was grouped into the same group with Streptococcus (defined as cluster 2, figure 2) with the data of all the GC patients, a higher relative abundance of Abiotrophia was only found in cardia cancer patients in contrast to the higher relative abundance of Streptococcus in non-cardia cancer patients. It may indicate the different carcinogenic mechanism of the two genera. Another genus closely related to Streptococcus was Veillonella, which was often co-occurring with Streptococcus [34]. In the oral cavity, the two bacteria were shown to have a metabolic interaction. For example, Streptococcus can ferment sugar into lactic acid, which is the main carbon and energy source of Veillonella [35]. Besides to the small intestine, both of their population are also abundant in the oral cavity [36], throat, esophagus, and stomach [37].
The people with poor oral health often have more abundance of Veillonella biofilms [38]. In some esophageal precancerous lesions, such as gastro-esophageal reflux disease and Barrett's esophagus, an increased abundance of Veillonella was detected both in U.S. and Japanese patients. Although the non-significant difference between the overall GC cases and control subjects, Veillonella was associated with increased risk of cardia cancer, which is a unique part connecting the esophagus and stomach. The increased the risk effects of Veillonella on respiratory tumors also have been reported, such as lung cancer [39].
Other Gram-negative bacteria (relative abundance median >1%), e.g., Porphyromonas, Prevotella, Prevotella7, and Neisseria was found to be inversely associated with risk of GC in this study. Neisseria, for example, are the commensals in nasopharyngeal and oral cavities of humans. Although Neisseria genus contains some important pathogens (i.e. Neisseria gonorrhoeae and Neisseria meningitidis), most other Neisseria species are less virulent and benign commensals in the oral and nasopharyngeal cavities. Neisseria lactamica, for example, has a protective effect against Neisseria meningitidis and this effect has been considered to the design of vaccines [40]. Consistent with our findings, decreased relative abundance of Neisseria were found in esophageal cancer and lung cancer [31, 39]. In contrast to our findings, Prevotella, Prevotella 7 and Porphyromonas were often reported participating in several inflammatory pathological processes by producing redox protein or by increasing resistance to host [41]. It could be explained that oral micro-ecology is a commensal system, and the significant risk/protective effect of diseases of a single microbe may reflect a relatively independent group in a specific circumstance. The Prevotella, Prevotella 7 and some other microbes with low relative abundance (<1%) formed cluster 6; these microbes included Atopobium, RuminococcaceaeUCG014, Stomatobaculum, Candidatus Saccharimonas, Lachnospiraceae uncultured, Oribacterium, Eubacterium nodatum group, and Erysipelotrichaceae UCG007. Cluster 6 has an inverse association of GC risk and the area under ROC reached 0.76 with 71.3% sensitivity and 70.3% specificity.
In this study, comprehensive 16S rRNA gene sequence, new-onset GC patients, and co-abundance group analysis were the main strengths. Some limitations in our study needed to be elaborated. First, cross-sectional nature of the study could not validate causality of oral microbes in the carcinogenesis of GC. Second, we lack the data of oral health and HP infection which may confound the oral microbiome-GC relations. Third, the main findings of this study need to be validated in another population with a larger sample size. However, such a large sample population was not available now for this study.
In summary, we provided the evidence that some tongue coating microbes may play a role in the risk of GC, while the other bacteria may be related to the decreased risk. Clarification of these associations would be instructive in prevention strategy by eradication or inoculation in high-risk individuals. Prospective studies followed by animal experiments are needed to clarify their causal relationships.
Abbreviations
GC: gastric cancer; HP: helicobacter pylori; OTUs: operational taxonomic units; emPCR: emulsion-based clonal amplification; HOMD: Human Oral Microbiome Database; PCoA: principal coordinate analysis; PERMANOVA: Permutational multivariate analysis of variance; BH: Benjamini-Hochberg; CAGs: co-abundance groups; ROC: receiver operating characteristic curve.
Supplementary Material
Supplementary figures and tables.
Acknowledgements
We thank Dr. Dongqing Yang for the assistance in statistical analysis. This study was supported by the National Natural Science Foundation (81473593, 81473458). This work was also supported partly by the Project of Clinical Scientific Research of Medicine State Administration of TCM (JDZX2015089).
Author Contributions
JFZ and ZZ designed and supervised the study; QHC, SX, CJX, QYL, JQH collected samples and performed experiments; JW, JFZ, SX finished sequencing and data analysis; JW wrote the manuscript. LYS offered critical amendment advices. All authors have read and approved the manuscript.
Conflicts of Interests
The authors have declared that no competing interest exists.
References
1. Chen W, Zheng R, Baade PD. et al. Cancer statistics in China, 2015. CA: a cancer journal for clinicians. 2016;66:115-32
2. Castano-Rodriguez N, Kaakoush NO, Pardo AL. et al. Genetic polymorphisms in the Toll-like receptor signalling pathway in Helicobacter pylori infection and related gastric cancer. Human immunology. 2014;75:808-15
3. Ghoshal U, Tripathi S, Kumar S. et al. Genetic polymorphism of cytochrome P450 (CYP) 1A1, CYP1A2, and CYP2E1 genes modulate susceptibility to gastric cancer in patients with Helicobacter pylori infection. Gastric cancer: official journal of the International Gastric Cancer Association and the Japanese Gastric Cancer Association. 2014;17:226-34
4. Yang S, Park Y, Lee J. et al. Effects of Soy Product Intake and Interleukin Genetic Polymorphisms on Early Gastric Cancer Risk in Korea: A Case-Control Study. Cancer research and treatment: official journal of Korean Cancer Association. 2017;49:1044-56
5. Lim Y, Totsika M, Morrison M. et al. Oral Microbiome: A New Biomarker Reservoir for Oral and Oropharyngeal Cancers. Theranostics. 2017;7:4313-21
6. Schroeder BO, Backhed F. Signals from the gut microbiota to distant organs in physiology and disease. Nature medicine. 2016;22:1079-89
7. Guerrero-Preston R, Godoy-Vitorino F, Jedlicka A. et al. 16S rRNA amplicon sequencing identifies microbiota associated with oral cancer, human papilloma virus infection and surgical treatment. Oncotarget. 2016;7:51320-34
8. Yin XH, Wang YD, Luo H. et al. Association between Tooth Loss and Gastric Cancer: A Meta-Analysis of Observational Studies. PloS one. 2016;11:e0149653
9. Michaud DS, Fu Z, Shi J. et al. Periodontal Disease, Tooth Loss, and Cancer Risk. Epidemiologic reviews. 2017;39:49-58
10. Ahn J, Chen CY, Hayes RB. Oral microbiome and oral and gastrointestinal cancer risk. Cancer Causes Control. 2012;23:399-404
11. Periodontal diseases. Nat Rev Dis Primers. 2017; 3: 17039.
12. Mira A, Simon-Soro A, Curtis MA. Role of microbial communities in the pathogenesis of periodontal diseases and caries. J Clin Periodontol. 2017;44(Suppl 18):S23-S38
13. Tonetti MS, D'Aiuto F, Nibali L. et al. Treatment of periodontitis and endothelial function. N Engl J Med. 2007;356:911-20
14. Shen TC, Chang PY, Lin CL. et al. Risk of Periodontal Diseases in Patients With Chronic Obstructive Pulmonary Disease: A Nationwide Population-based Cohort Study. Medicine (Baltimore). 2015;94:e2047
15. Fan X, Alekseyenko AV, Wu J. et al. Human oral microbiome and prospective risk for pancreatic cancer: a population-based nested case-control study. Gut. 2018;67:120-7
16. Swidsinski A, Schlien P, Pernthaler A. et al. Bacterial biofilm within diseased pancreatic and biliary tracts. Gut. 2005;54:388-95
17. Fernandes CP, Oliveira FA, Silva PG. et al. Molecular analysis of oral bacteria in dental biofilm and atherosclerotic plaques of patients with vascular disease. International journal of cardiology. 2014;174:710-2
18. Dal Bello F, Hertel C. Oral cavity as natural reservoir for intestinal lactobacilli. Syst Appl Microbiol. 2006;29:69-76
19. Mager DL, Ximenez-Fyvie LA, Haffajee AD. et al. Distribution of selected bacterial species on intraoral surfaces. J Clin Periodontol. 2003;30:644-54
20. Han S, Yang X, Qi Q. et al. Potential screening and early diagnosis method for cancer: Tongue diagnosis. International journal of oncology. 2016;48:2257-64
21. Gibbons RJ, Houte JV. Bacterial adherence in oral microbial ecology. Annu Rev Microbiol. 1975;29:19-44
22. Ye J, Cai X, Yang J. et al. Bacillus as a potential diagnostic marker for yellow tongue coating. Sci Rep. 2016;6:32496
23. Hu J, Han S, Chen Y. et al. Variations of Tongue Coating Microbiota in Patients with Gastric Cancer. Biomed Res Int. 2015;2015:173729
24. Jiang B, Liang X, Chen Y. et al. Integrating next-generation sequencing and traditional tongue diagnosis to determine tongue coating microbiome. Sci Rep. 2012;2:936
25. Geng J, Fan H, Tang X. et al. Diversified pattern of the human colorectal cancer microbiome. Gut pathogens. 2013;5:2
26. Lozupone C, Lladser ME, Knights D. et al. UniFrac: an effective distance metric for microbial community comparison. The ISME journal. 2011;5:169-72
27. Omar Al-Hassi H, Ng O, Brookes M. Tumour-associated and non-tumour-associated microbiota in colorectal cancer. Gut. 2018;67:395
28. Moritani K, Takeshita T, Shibata Y. et al. Acetaldehyde production by major oral microbes. Oral diseases. 2015;21:748-54
29. Mukherjee PK, Wang H, Retuerto M. et al. Bacteriome and mycobiome associations in oral tongue cancer. Oncotarget. 2017;8:97273-89
30. Chen X, Winckler B, Lu M. et al. Oral Microbiota and Risk for Esophageal Squamous Cell Carcinoma in a High-Risk Area of China. PloS one. 2015;10:e0143603
31. Peters BA, Wu J, Pei Z. et al. Oral Microbiome Composition Reflects Prospective Risk for Esophageal Cancers. Cancer research. 2017;77:6777-87
32. Sasaki H, Igaki H, Ishizuka T. et al. Presence of Streptococcus DNA sequence in surgical specimens of gastric cancer. Japanese journal of cancer research: Gann. 1995;86:791-4
33. Acharya A, Chan Y, Kheur S. et al. Salivary microbiome of an urban Indian cohort and patterns linked to subclinical inflammation. Oral diseases. 2017;23:926-40
34. Egland PG, Palmer RJ Jr, Kolenbrander PE. Interspecies communication in Streptococcus gordonii-Veillonella atypica biofilms: signaling in flow conditions requires juxtaposition. Proceedings of the National Academy of Sciences of the United States of America. 2004;101:16917-22
35. Ng SK, Hamilton IR. Lactate metabolism by Veillonella parvula. Journal of bacteriology. 1971;105:999-1005
36. Keijser BJ, Zaura E, Huse SM. et al. Pyrosequencing analysis of the oral microflora of healthy adults. Journal of dental research. 2008;87:1016-20
37. Bik EM, Eckburg PB, Gill SR. et al. Molecular analysis of the bacterial microbiota in the human stomach. Proceedings of the National Academy of Sciences of the United States of America. 2006;103:732-7
38. Mashima I, Theodorea CF, Thaweboon B. et al. Identification of Veillonella Species in the Tongue Biofilm by Using a Novel One-Step Polymerase Chain Reaction Method. PloS one. 2016;11:e0157516
39. Yan X, Yang M, Liu J. et al. Discovery and validation of potential bacterial biomarkers for lung cancer. American journal of cancer research. 2015;5:3111-22
40. Gorringe AR, Taylor S, Brookes C. et al. Phase I safety and immunogenicity study of a candidate meningococcal disease vaccine based on Neisseria lactamica outer membrane vesicles. Clinical and vaccine immunology: CVI. 2009;16:1113-20
41. Hofer U. Microbiome: pro-inflammatory Prevotella? Nature reviews Microbiology. 2014;12:5
Author contact
![]() Corresponding author: Junfeng Zhang, zhangjunfeng419edu.cn, phone +86-25-85811925, fax +86-25-85811922; Zhen Zhan, zhanzhan5607com, phone +86-25-85811925, fax +86-25-85811922.
Corresponding author: Junfeng Zhang, zhangjunfeng419edu.cn, phone +86-25-85811925, fax +86-25-85811922; Zhen Zhan, zhanzhan5607com, phone +86-25-85811925, fax +86-25-85811922.
Citation styles
APA
Wu, J., Xu, S., Xiang, C., Cao, Q., Li, Q., Huang, J., Shi, L., Zhang, J., Zhan, Z. (2018). Tongue Coating Microbiota Community and Risk Effect on Gastric Cancer. Journal of Cancer, 9(21), 4039-4048. https://doi.org/10.7150/jca.25280.
ACS
Wu, J.; Xu, S.; Xiang, C.; Cao, Q.; Li, Q.; Huang, J.; Shi, L.; Zhang, J.; Zhan, Z. Tongue Coating Microbiota Community and Risk Effect on Gastric Cancer. J. Cancer 2018, 9 (21), 4039-4048. DOI: 10.7150/jca.25280.
NLM
Wu J, Xu S, Xiang C, Cao Q, Li Q, Huang J, Shi L, Zhang J, Zhan Z. Tongue Coating Microbiota Community and Risk Effect on Gastric Cancer. J Cancer 2018; 9(21):4039-4048. doi:10.7150/jca.25280. https://www.jcancer.org/v09p4039.htm
CSE
Wu J, Xu S, Xiang C, Cao Q, Li Q, Huang J, Shi L, Zhang J, Zhan Z. 2018. Tongue Coating Microbiota Community and Risk Effect on Gastric Cancer. J Cancer. 9(21):4039-4048.
This is an open access article distributed under the terms of the Creative Commons Attribution (CC BY-NC) license (https://creativecommons.org/licenses/by-nc/4.0/). See http://ivyspring.com/terms for full terms and conditions.