Journal of Cancer
ISSN: 1837-9664
3.2
Impact Factor
ISSN: 1837-9664

 Global reach, higher impact
J Cancer 2018; 9(22):4117-4127. doi:10.7150/jca.26936 This issue Cite
Research Paper
Nomogram to Predict Cancer-Specific Survival in Patients with Pancreatic Acinar Cell Carcinoma: A Competing Risk Analysis
Chaobin He1*, Yu Zhang2*, Zhiyuan Cai1, Fangting Duan1, Xiaojun Lin1 ![]() , Shengping Li1
, Shengping Li1 ![]()
1. Department of Hepatobiliary and Pancreatic Surgery, State Key Laboratory of Oncology in South China, Collaborative Innovation Center for Cancer Medicine, Sun Yat-sen University Cancer Center, Guangzhou 510060, China
2. State Key Laboratory of Ophthalmology, Zhongshan Ophthalmic Center, Sun Yat-sen University, Guangzhou, Guangdong, 510060, P.R. China
*These authors contributed equally to this work
Received 2018-4-27; Accepted 2018-7-22; Published 2018-10-18
Citation:
He C, Zhang Y, Cai Z, Duan F, Lin X, Li S. Nomogram to Predict Cancer-Specific Survival in Patients with Pancreatic Acinar Cell Carcinoma: A Competing Risk Analysis. J Cancer 2018; 9(22):4117-4127. doi:10.7150/jca.26936. https://www.jcancer.org/v09p4117.htm
Other stylesAbstract
Background: The objective of this study was to evaluate the probability of cancer-specific death of patients with acinar cell carcinoma (ACC) and build nomograms to predict overall survival (OS) and cancer-specific survival (CSS) of these patients.
Methods: Data were extracted from the Surveillance, Epidemiology, and End Results (SEER) database. Patients diagnosed with ACC between 2004 and 2014 were retrospectively collected. Cancer-specific mortality and competing risk mortality were evaluated. Nomograms for estimating 1-, 2- and 3-year OS and CSS were established based on Cox regression model and Fine and Grey's model. The precision of the 1-, 2- and 3-year survival of the nomograms was evaluated and compared using the area under receiver operating characteristic (ROC) curve (AUC).
Results: The study cohort included 227 patients with ACC. The established nomograms were well calibrated, and had good discriminative ability, with a concordance index (C-index) of 0.742 for OS prediction and 0.766 for CSS prediction. The nomograms displayed better discrimination power than 7th or 8th edition Tumor-Node-Metastasis (TNM) stage systems in training set and validation set for predicting both OS and CSS. The AUC values of the nomogram predicting 1-, 2-, and 3-year OS rates were 0.784, 0.797 and 0.805, respectively, which were higher than those of 7th or 8th edition TNM stage systems. Regard to the prediction of CSS rates, the AUC values of the nomogram were also higher than those of 7th or 8th edition TNM stage systems.
Conclusion: We evaluated the 1-, 2- and 3-year OS and CSS in patients with ACC for the first time. Our nomograms showed relatively good performance and could be considered as convenient individualized predictive tools for prognosis.
Keywords: acinar cell carcinoma, nomogram, cancer-specific survival, overall survival, prognosis
Introduction
Acinar cell carcinoma (ACC) is a relatively rare, malignant tumor of pancreas and accounts for approximately 1% of primary pancreatic neoplasms [1, 2], even though the pancreas is composed predominantly of acinar cells by volume (82%) [3]. As a kind of exocrine pancreatic neoplasms, pancreatic ACC is characterized by producing digestive enzymes such as trypsin, chymotrypsin, lipase, and amylase [4, 5]. It was shown that pancreatic ACC had distinct clinical characteristics compared with pancreatic ductal adenocarcinoma (PDAC) [6, 7]. Compared with PDAC, patients with ACC were more likely to be male and have larger tumors [8]. Similarly, surgery provides the best chances for patients with ACC to obtain a better prognosis. It was suggested that patients with ACC have a better prognosis than those with PDAC after surgery [7, 9]. However, due to rarity of ACC, the published literatures were mainly based on studies of small number of patients [7, 10, 11]. The clinical and pathological factors of ACC need to be clearly illustrated. What is more, the Tumor-Node-Metastasis (TNM) staging system of the American Joint Commission on Cancer (AJCC) 8th edition [12], which is most suitable for PDAC, only takes tumor size and the presence of histological metastasis into account and does not incorporate many other important prognostic factors, such as age, gender and tumor differentiation. TNM staging system may be not an ideal stage system for patients with ACC due to the differences of clinical and pathological characteristics from those with PDAC. It is known that personalized cancer treatment is based on the prognostic evaluation. Therefore, the development of a stage system which is technically feasible and easily clinically accessible to stratify the prognosis of patients with ACC is urgently required.
The indolent feature of ACC leads to a better prognosis of patients with ACC compared with patients with PDAC [5]. There is a high risk of competing non-cancer events for patients with ACC because many patients were diagnosed with ACC in their sixth or seventh decade and faced with associated high rates of comorbidities [13]. Furthermore, the risk of competing events increases in patients with cancers as age increases. Failure to recognize or account for the presence of competing risks may result in misleading conclusions in clinical trials or epidemiological research [14]. It may be not appropriate to use Kaplan-Meier method in prognostic analyses because it treats competing events as independent censorings and overestimates the proportion of cancer-specific death. It is important and necessary to take the competing risks into account when evaluating the prognosis. Therefore, competing risk analyses may be a more suitable method since it considers the informative nature of the censoring and corresponds to the probability of occurrence of a particular event without the assumption of independence between event types [15, 16].
Competing risk analysis has been widely used in cancer research, such as kidney cancer [17], brain metastasis cancer [18] and nasopharyngeal carcinoma [19]. However, to the best of our knowledge, no relative study about ACC has been reported. In the current work, competing risk analyses were conducted for these patients using the Surveillance, Epidemiology, and End Results (SEER) database, and competing risk nomograms were built to investigate the cancer-specific survival of patients with ACC.
Patients and Methods
Patients
The SEER program of the National Cancer Institute provides data on cancer incidence and survival in the United States and covers 30% of the population. For this research, data of patients with ACC were extracted from the SEER database (2004-2014), using the SEER*Stat software version 8.3.4. The study cohort consisted of patients with the following International Classification of Diseases for Oncology, Third Edition (ICD-O-3), histology code: 8550; and the ICD-O-3 site code C25.1, C25.2, C25.3 and C25.9. The TNM 8th edition stage was calculated according to 6th or 7th edition TNM stages [20] and other characteristic, such as tumor size. The exclusion criteria were as follows: (1) patients with second primary cancer; (2) patients with missing or incomplete information about survival, follow-up months, cause of death or other characteristics; (3) age at diagnosis younger than 18 years; (4) patients not newly or pathologically diagnosed. All patients were used to form the training set to develop the nomogram, and half of them were randomly selected to serve as an internal validation set. Institutional review board approval and informed consent were not required in the current study because SEER research data is publicly available and all patient data are de-identified. All authors have signed authorization and received permission from SEER to access and use the dataset.
Data collection
Demographic and clinical variables were extracted from the SEER database, including age at diagnosis, gender, tumor size, histological differentiation, TNM stage, follow-up information and cause of death. Age at diagnosis was divided into two groups (70 years or younger and older than 70 years). The TNM 8th stage was used as the staging system. Overall survival (OS) was defined as the duration from the date of diagnosis to death or last follow-up, with no restriction on the cause of death. Cancer-specific survival (CSS) was defined as the duration from the date of diagnosis until death due to ACC in the absence of other causes.
Statistical analysis
Continuous data were presented as the medians and ranges and compared using Student's t test. Categorical data were shown as frequencies and proportions and compared with chi-square test and Fisher's exact test. The univariate analysis and multivariate analysis were performed using the Cox regression model. The hazard ratio (HR) and the associated 95% confidence interval (CI) were calculated. The OS was analyzed using the Kaplan-Meier method. The log-rank test was used to compare the differences between groups. Cancer-specific mortality and non-cancer-specific mortality were regarded as two competing events. The combined effects of the variables on overall mortality and cancer-specific mortality were evaluated by proportional hazard analyses of Fine and Grey's model [21, 22]. A nomogram was developed based on the independent risk factors identified in the multivariate analysis. The performance of the nomogram was measured by concordance index (C-index) and assessed by calibration curves [23, 24]. The C-index reflected the probability that a randomly selected patient with lower probability of survival predicted via the nomograms died earlier than another randomly selected patient with higher predicted probability. A higher C-index indicates better ability to separate patients with different survival outcomes. The calibration curves were used to compare the predicted probability with the observed probability in the study cohort. Bootstraps with 100 resamples were used for the development of the nomogram and calibration curve to reduce the overfit bias. Furthermore, the precision of the 1-, 2- and 3-year survival of the nomograms was evaluated and compared using the area under receiver operating characteristic (ROC) curve (AUC). All statistical analyses were performed using SPSS version 22 (SPSS Inc., Chicago, IL, USA). MedCalc software version 11.4.2.0 (http://www.medcalc.be) was used to perform the survival comparisons. Competing risk analysis, nomogram and ROC curves were performed using R version 3.4.2 software (The R Foundation for Statistical Computing, Vienna, Austria. http://www.r-project.org). A two tailed P-value < 0.05 was considered statistically significant.
Results
Patient characteristics
During a period of 10 years from 2004 to 2014, a total of 227 patients with ACC in the SEER database were enrolled in this study. 91 of 227 (40.1%) patients underwent resection. Included patients had a median age of 65 years (range 32-94 years) with 74.4% being female. Most tumors were located at the pancreatic head (n = 110, 48.5%), 31.8% (72 / 227) of patients were at the pancreatic body and tail, and the other 19.8% were multifocal. Poor differentiation (n = 126, 55.5%) was the most common tumor grade, followed by moderate differentiation (n = 64, 28.2%), and well differentiation (n = 37, 16.3%). Large tumors were predominant in all patients. 96.5% of tumors (n = 219) were larger than 2cm and 52% of tumors (n = 118) were larger than 5cm. A total of 76 (33.5%) patients had lymph node (LN) metastasis while most of patients (135; 59.5%) were without metastasis. Most patients (n=91; 40.2%) were categorized as TNM stage IV, followed by stage II (30.8%), stage I (15.8%) and stage III (13.2%).
Table 1
Overall survival rates and cumulative incidences of mortality among patients with pancreatic acinar cell carcinoma
| Characteristic | Patients | Overall survival rate (%) | P | Cancer-specific mortality (%) | P | Non-cancer-specific mortality (%) | P | ||||||||
|---|---|---|---|---|---|---|---|---|---|---|---|---|---|---|---|
| No. | % | 1-year | 2-year | 3-year | 1-year | 2-year | 3-year | 1-year | 2-year | 3-year | |||||
| Total | 227 | 100 | |||||||||||||
| Surgery | No | 136 | 59.9 | 38.5 | 25.0 | 17.5 | <0.001 | 44.6 | 57.2 | 61.5 | <0.001 | 16.9 | 17.8 | 19.8 | 0.407 |
| Yes | 91 | 40.1 | 75.1 | 64.7 | 54.8 | 13.1 | 20.9 | 25.9 | 11.7 | 14.4 | 15.9 | ||||
| Age (years) | < 70 | 141 | 62.1 | 59.8 | 48.6 | 39.9 | <0.001 | 29.3 | 39.7 | 47.2 | 0.882 | 10.9 | 11.8 | 11.8 | 0.001 |
| ≥ 70 | 86 | 37.9 | 42.8 | 29.3 | 22.9 | 36.0 | 46.9 | 46.9 | 21.2 | 23.8 | 28.4 | ||||
| Tumor site | Head | 110 | 48.5 | 50.4 | 38.3 | 31.8 | 0.006 | 34.3 | 46.4 | 50.5 | 0.072 | 15.4 | 15.4 | 17.8 | 0.815 |
| Body | 21 | 9.3 | 57.3 | 50.9 | 50.9 | 26.6 | 26.6 | 26.6 | 16.2 | 22.5 | 22.5 | ||||
| Tail | 51 | 22.5 | 65.2 | 50.5 | 41.4 | 24.9 | 36.5 | 39.6 | 8.3 | 13.0 | 15.8 | ||||
| Overlapping sites | 45 | 19.7 | 43.2 | 33.3 | 20.7 | 36.3 | 46.2 | 55.3 | 20.5 | 20.5 | 20.5 | ||||
| Tumor grade | Well | 37 | 16.3 | 78.0 | 61.1 | 51.3 | <0.001 | 19.3 | 30.5 | 33.7 | <0.001 | 2.7 | 8.4 | 11.3 | 0.537 |
| Moderate | 64 | 28.2 | 78.7 | 60.2 | 45.8 | 8.2 | 24.9 | 34.4 | 13.1 | 14.9 | 17.3 | ||||
| Poor | 126 | 55.5 | 31.6 | 23.2 | 20.6 | 48.9 | 56.2 | 58.8 | 19.5 | 19.5 | 20.7 | ||||
| Tumor size | < 5cm | 109 | 48.0 | 54.9 | 43.0 | 38.5 | 0.304 | 30.5 | 41.4 | 45.9 | 0.569 | 15.1 | 17.2 | 20.6 | 0.660 |
| ≥ 5cm | 118 | 52.0 | 51.7 | 39.4 | 30.1 | 12.5 | 12.5 | 37.5 | 12.5 | 25.0 | 25.0 | ||||
| T stage (8th) | I | 8 | 3.5 | 50.0 | 50.0 | 37.5 | 0.050 | 12.5 | 12.5 | 25.0 | 0.037 | 25.0 | 37.5 | 37.5 | 0.057 |
| II | 72 | 31.8 | 61.0 | 47.3 | 47.3 | 28.7 | 42.5 | 42.5 | 10.3 | 10.3 | 10.3 | ||||
| III | 114 | 50.2 | 48.8 | 36.7 | 30.6 | 32.3 | 42.1 | 44.6 | 19.0 | 21.2 | 23.5 | ||||
| IV | 33 | 14.5 | 48.5 | 35.4 | 19.7 | 42.4 | 52.0 | 67.7 | 9.1 | 9.1 | 12.6 | ||||
| LN metastasis | Absent | 151 | 66.5 | 56.7 | 48.0 | 40.5 | 0.045 | 29.4 | 35.7 | 39.5 | 0.034 | 13.9 | 16.3 | 19.0 | 0.594 |
| Present | 76 | 33.5 | 46.2 | 27.4 | 20.6 | 37.1 | 55.8 | 62.7 | 16.7 | 16.7 | 16.7 | ||||
| Metastasis | Absent | 135 | 59.5 | 64.6 | 52.3 | 45.7 | <0.001 | 22.1 | 31.7 | 36.2 | <0.001 | 13.3 | 15.0 | 17.0 | 0.523 |
| Present | 92 | 40.5 | 36.1 | 22.8 | 14.8 | 46.8 | 58.7 | 63.4 | 17.2 | 18.5 | 20.0 | ||||
LN, lymph node
Figure 1
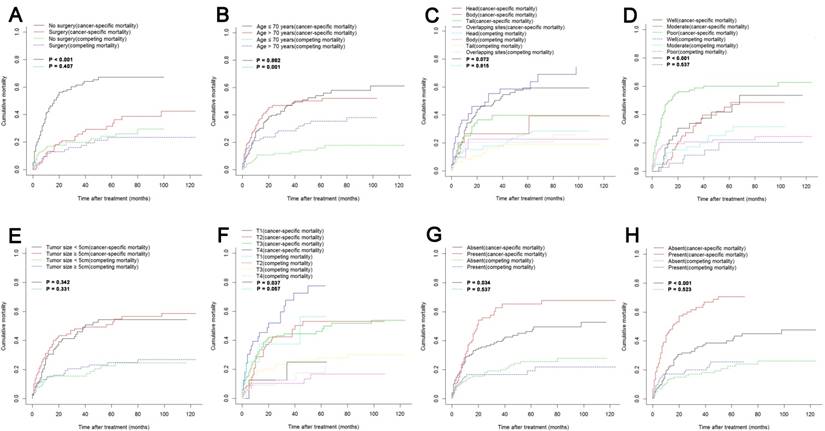
Cumulative cancer-specific and competing mortality according to patient characteristics: (A) Surgery; (B) Age; (C) Tumor site; (D) Tumor grade; (E) Tumor size; (F) T stage; (G) LN metastasis; (H) Metastasis. Abbreviations: LN, lymph node.
The median follow-up time was 11 months (range 1-124 months). In total, 153/227 (67.4%) patients died. One hundred and six (46.7%) cancer-specific deaths and 47 (20.7%) non-cancer-specific deaths were observed, respectively. The 1-, 2- and 3-year cancer-specific mortalities, non-cancer-specific mortalities and overall survival rates which were stratified by surgery, age, tumor site, tumor grade, tumor size, T stage (8th edition), LN metastasis and metastasis were summarized in Table 1. In the subgroup competing mortality analyses, the cancer-specific mortalities were significantly higher in patients when they had no surgical resection (P < 0.001, Fig. 1A), poor tumor differentiation (P < 0.001, Fig. 1D), more advanced T stage (8th edition) (P = 0.037, Fig. 1F), presence of LN metastasis (P = 0.034, Fig. 1G) and presence of metastasis (P < 0.001, Fig. 1H). The competing mortality was higher along with the increasing ages (P = 0.001, Fig. 1B). Furthermore, there was no significant difference with regard to competing mortality in all the subgroup analyses except age (P > 0.05). In addition, the Kaplan-Meier curves showed that there were significant differences of OS rates when they were stratified by these characteristics. Patients who had no surgical resection (P < 0.001, Fig. 1A), older ages (P < 0.001, Fig. 1B), tumors at pancreatic head (P = 0.006, Fig. 1C), poorly differentiated tumors (P < 0.001, Fig. 1D), an elevated T stage (8th) (P = 0.050, Fig. 1F), LN metastasis (P = 0.045, Fig. 1G) and metastasis (P < 0.001, Fig. 1H) had poorer OS. However, there were no significant differences in OS stratified by different tumor sizes (P > 0.05, Fig. 1E).
Univariate and multivariate analyses of effects of factors on OS and CSS
The median OS time was 16 months (95% CI, 11 - 20 months) and the 1-year, 2-year and 3-year OS rates were 53.2%, 41.1% and 34.0%, respectively. In the univariate analysis, age (HR = 1.739, 95% CI, 1.263 - 2.393, P = 0.001), gender (HR = 1.581, 95% CI, 1.076 - 2.321, P = 0.020), tumor grade (HR = 2.723, 95% CI, 2.093 - 3.542, P < 0.001), T stage (8th) (HR = 1.305, 95% CI, 1.051 - 1.620, P = 0.016), LN metastasis (HR = 1.392, 95% CI, 1.000 - 1.937, P = 0.050), number of positive LN (HR = 1.444, 95% CI, 1.021 - 2.042, P = 0.038) and metastasis (HR = 2.614, 95% CI, 1.881 - 3.633, P < 0.001) were significantly associated with OS, while tumor site, tumor size were not significantly related to OS (P > 0.05). In addition, for the included patients, it was shown that gender, tumor grade, T stage (8th edition), LN metastasis, number of positive LN and metastasis were validated to be significantly associated with CSS according to the results of the univariate competing risk analysis (Table 2).
Variables that were significantly associated with OS and CSS analyzed by multivariate analyses were selected to be prognostic indicators (Table 2). After adjusting for other risk factors the multivariate analysis showed that tumor grade (HR = 2.288, 95% CI, 1.478 - 3.542, P < 0.001), LN metastasis (HR = 1.869, 95% CI, 1.008 - 3.465, P = 0.047) and metastasis (HR = 4.099, 95% CI, 1.678 - 10.017, P = 0.002) all remained associated with OS. What is more, these variables were also independent predictive factors for CSS. Poorer tumor grade (HR = 3.036, 95% CI, 1.709 - 5.392, P < 0.001), present of LN metastasis (HR = 2.600, 95% CI, 1.216 - 5.557, P = 0.014) and present of metastasis (HR = 4.511, 95% CI, 1.389 - 14.653, P = 0.012) were more likely to contribute to cancer-specific mortality.
Construction and validation of nomograms for OS and CSS
All the independent predictors of OS and CSS in the whole study cohort were integrated into the nomogram. Figure 3 illustrates the predictive nomograms established for the 1-, 2-, and 3-year OS and CSS rates in the training set. A patient's probability of individual survival can easily be calculated by adding the scores for each selected variable. The nomogram demonstrated good accuracy for OS prediction, with a C-index of 0.742 (95% CI, 0.706 - 0.778). Calibration plots for the probabilities of 1-, 2-, and 3-year OS showed fair agreement between the nomogram-predicted survival and the actual survival in both the training and validation sets (Fig. 4). The nomogram for CSS prediction which was generated based on Fine and Grey's model, also showed good accuracy, with a C-index for the CSS prediction of 0.766 (95% CI, 0.729 - 0.803). Calibration plots for the probabilities of 1-, 2-, and 3-year CSS showed an optimal agreement between prediction by the nomogram and the actual observation with regard to both training and validation sets (Fig. 5). We compared the discriminatory accuracy of the nomograms with that of the 7th and 8th edition TNM stage systems in the training set. The nomogram discriminatory accuracy for OS prediction was superior to that of either the 7th or 8th edition TNM stage systems (C-index = 0.742, 95% CI, 0.706 - 0.778 vs 0.620, 95% CI, 0.569 - 0.671, P < 0.001; 0.742, 95% CI, 0.706 - 0.778 vs 0.631, 95% CI, 0.581 - 0.681, P < 0.001, respectively). Discriminatory accuracy of the nomogram for CSS prediction was also enhanced compared with both the 7th or 8th edition TNM stage systems in the training set (C-index = 0.766, 95% CI, 0.729 - 0.803 vs 0.655, 95% CI, 0.596 - 0.714, P < 0.001; 0.766, 95% CI, 0.729 - 0.803 vs 0.661, 95% CI, 0.606 - 0.716, P < 0.001, respectively). What is more, the nomograms established in this study also displayed more powerful efficiency of discriminatory accuracy for both OS and CSS prediction in the validation set compared with the 7th or 8th edition TNM stage systems (Table 3).
Figure 2
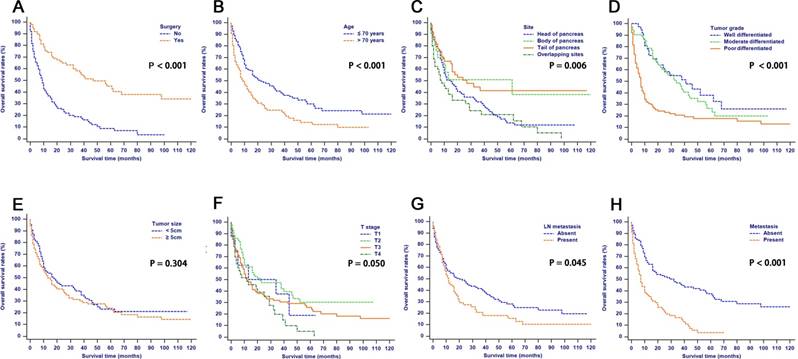
Overall survival rates according to patient characteristics: (A) Surgery; (B) Age; (C) Tumor site; (D) Tumor grade; (E) Tumor size; (F) T stage; (G) LN metastasis; (H) Metastasis. Abbreviations: LN, lymph node.
Table 2
Univariate and multivariate analyses of survival in patients with pancreatic acinar cell carcinoma
| Characteristic | Overall survival | Cancer-specific survival | |||||||||||
|---|---|---|---|---|---|---|---|---|---|---|---|---|---|
| Univariate analysis | Multivariate analysis | Univariate analysis | Multivariate analysis | ||||||||||
| HR | 95%CI | P | HR | 95%CI | P | HR | 95%CI | P | HR | 95%CI | P | ||
| Age (years) | < 70 / ≥ 70 | 1.739 | 1.263-2.393 | 0.001 | NS | 1.341 | 0.906-1.984 | 0.143 | NI | ||||
| Gender | Male / Female | 1.581 | 1.076-2.321 | 0.020 | NS | 1.625 | 1.021-2.589 | 0.041 | NS | ||||
| Tumor site | Head/Body/Tail/ Overlapping site | 1.012 | 0.885-1.157 | 0.863 | NI | 1.036 | 0.882-1.216 | 0.667 | NI | ||||
| Tumor grade | Well / Moderate / Poor | 2.723 | 2.093-3.542 | <0.001 | 2.288 | 1.478-3.542 | <0.001 | 3.082 | 2.219-4.281 | <0.001 | 3.036 | 1.709-5.392 | <0.001 |
| Tumor size | < 5cm / ≥ 5cm | 1.178 | 0.857-1.620 | 0.313 | NI | 1.166 | 0.796-1.710 | 0.430 | NI | ||||
| T stage (8th) | T1 / T2 / T3 / T4 | 1.305 | 1.051-1.620 | 0.016 | NS | 1.393 | 1.075-1.805 | 0.012 | NS | ||||
| LN metastasis | Absent / Present | 1.392 | 1.000-1.937 | 0.050 | 1.869 | 1.008-3.465 | 0.047 | 1.601 | 1.083-2.366 | 0.018 | 2.600 | 1.216-5.557 | 0.014 |
| Number of positive LN | 0 / ≤ 2 / > 2 | 1.444 | 1.021-2.042 | 0.038 | NS | 1.636 | 1.081-2.475 | 0.020 | NS | ||||
| Metastasis | Absent / Present | 2.614 | 1.881-3.633 | <0.001 | 4.099 | 1.678-10.017 | 0.002 | 2.946 | 1.986-4.369 | <0.001 | 4.511 | 1.389-14.653 | 0.012 |
LN, lymph node; HR, hazard ratio; CI, confidence interval; NS, not significant; NI, not included.
Figure 3
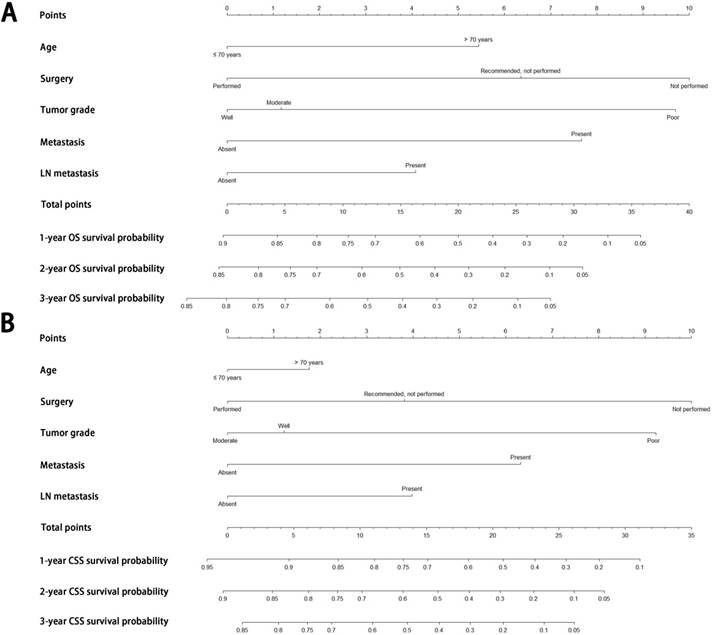
Nomograms predicting 1-, 2- and 3-year OS (A) and CSS (B) of patients with pancreatic acinar cell carcinoma. Abbreviations: OS, overall survival; CSS, cancer-specific survival; LN, lymph node.
Table 3
C-indexes for the nomograms and TNM stage systems in patients with pancreatic acinar cell carcinoma
| Survival | Training set | P | Validation set | P | |
|---|---|---|---|---|---|
| Overall survival | Nomogram | 0.742(0.706-0.778) | Reference | 0.754(0.700-0.808) | Reference |
| 7th edition TNM stage | 0.620(0.569-0.671) | <0.001 | 0.619(0.549-0.689) | <0.001 | |
| 8th edition TNM stage | 0.631(0.581-0.681) | <0.001 | 0.625(0.556-0.694) | <0.001 | |
| Cancer-specific survival | Nomogram | 0.766(0.729-0.803) | Reference | 0.727(0.665-0.789) | Reference |
| 7th edition TNM stage | 0.655(0.596-0.714) | <0.001 | 0.647 (0.579-0.715) | <0.001 | |
| 8th edition TNM stage | 0.661(0.606-0.716) | <0.001 | 0.655(0.589-0.721) | <0.001 | |
Figure 4
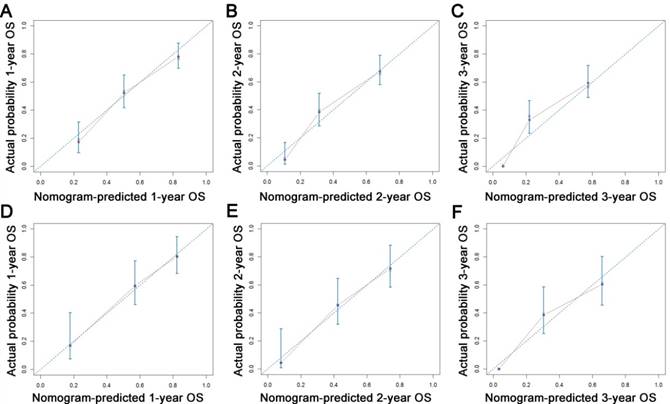
Calibration plots of the nomogram for 1-, 2- and 3-year OS prediction of the training set (A, B, C) and validation set (D, E, F). X-axis represents the nomogram-predicted probability of survival; Y-axis represents the actual OS probability. A perfectly accurate nomogram prediction model would result in a plot that the observed and predicted probabilities for given groups fall along the 45-degree line. Dots with bars represent nomogram-predicted probabilities along with 95% confidence interval. Abbreviations: OS, overall survival.
Figure 5
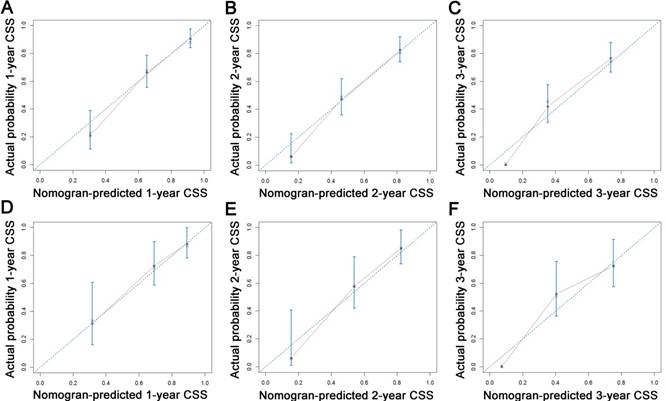
Calibration plots of the nomogram for 1-, 2- and 3-year CSS prediction of the training set (A, B, C) and validation set (D, E, F). X-axis represents the nomogram-predicted probability of survival; Y-axis represents the actual CSS probability. Abbreviations: CSS, cancer-specific survival.
Comparison of AUC values of the nomogram and 7th or 8th edition TNM stage system
The discriminatory capacity of the nomograms and 7th or 8th edition TNM stage systems was compared by analyzing the AUC values (Fig. 6). For the whole study cohort, the AUC values of the nomogram for predicting 1-, 2-, and 3-year OS rates were 0.784, 0.797 and 0.805, respectively, whereas the AUC values were 0.650, 0.681 and 0.708, respectively for the 7th edition TNM stage system and were 0.662, 0.684 and 0.707, respectively for the 8th edition TNM stage system. With regard to the prediction of the 1-, 2-, and 3-year CSS rates, the AUC values of the nomogram were 0.832, 0.852 and 0.852, respectively, while the AUC values of the 7th TNM stage system were 0.689, 0.717, and 0.739, respectively and the AUC values of the 8th TNM stage system were 0.691, 0.709 and 0.726, respectively. It was shown that the nomograms had superior discriminative capacity for predicting both OS and CSS compared with either the 7th or 8th edition TNM stage system.
Survival analysis and competing risk analysis according to the risk stratification based on the nomogram
All patients in this study with the probability score of ≤ 10, 10 - 20 and > 20 were assigned into the low risk group, middle risk group and high risk group, respectively. As shown in Fig. 7, patients in the low risk group had significantly higher survival rates and lower cancer-specific mortalities compared with patients in the high risk groups (P < 0.001).
Figure 6
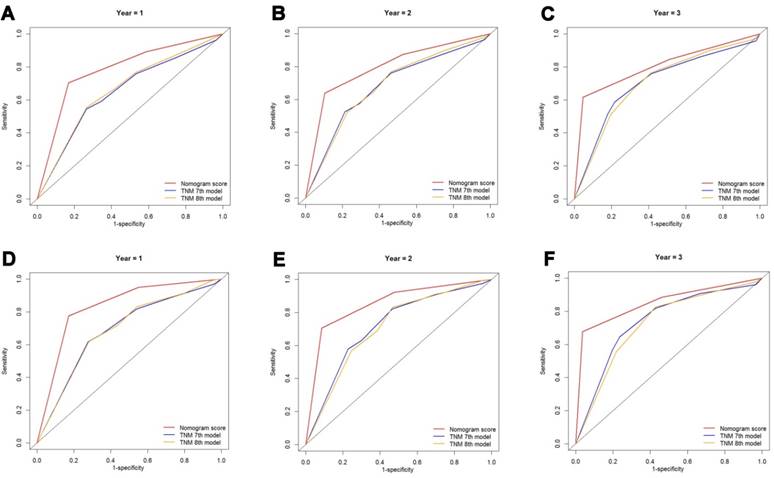
Comparison of the ROC curves of the nomogram and the TNM stage systems for 1-, 2- and 3-year OS prediction (A, B, C) and CSS prediction (D, E, F). Abbreviations: OS, overall survival; CSS, cancer-specific survival; TNM, Tumor-Node-Metastasis.
Figure 7
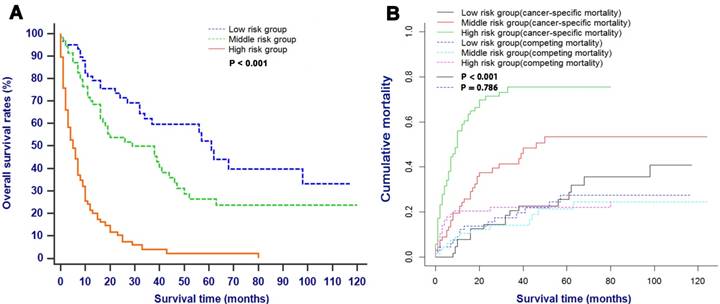
OS (A) and CSS (B) stratified by the risk levels of the nomogram-predicted survival probabilities. Abbreviations: OS, overall survival; CSS, cancer-specific survival.
Discussion
ACC is an uncommon solid epithelial exocrine tumor in pancreas and comprehensive retrospective institutional cases serious are not easily available to make accurate conclusions of outcomes and clinical characteristics of ACC. It is necessary to establish an efficient prognostic system that can be used to predict survival for patients with ACC. However, the TNM 8th stage system [12], the most widely used stage system, is more applicable for PDAC than for ACC. Maybe it is imprecise to solely use traditional stage system to evaluate the prognosis in patients with ACC. Furthermore, the previously reported stage systems only focused on OS of patients, ignoring non-cancer-specific death which could have great impact on the survival outcome, especially for patients with increasing age [25]. Thus, we aimed to develop and validate prognostic nomograms to predict OS and CSS. To the best of our knowledge, our study was the first one to apply competing risk analysis model in evaluating the prognostic factors in patients with ACC. The established nomograms were derived from retrospectively collected data on 227 patients from the SEER dataset, showing favorable discrimination and calibration. In addition, comparison of values of AUC showed that nomograms were superior to 7th and 8th TNM stage systems in predicting OS and CSS in patients with ACC.
Similar to other studies [8], most patients with ACC are older than 65 years old at diagnosis. The increasing age had a direct effect on non-cancer-specific mortality. It was shown that the non-cancer-specific mortalities were significantly higher in elder patients in the present study. What is more, nearly 60% of non-cancer-specific death was observed in patients with elder ages. This result showed that non-cancer-specific mortality was an important competing risk event in older patients, which was in consistent with the previous studies [26]. It is necessary to consider age when predicting prognosis in patients with ACC, especially in elder patients, because age-related complications may lead to non-cancer-specific mortality.
Although prognosis of patients with ACC after surgery is substantially better than prognosis of patients who received no surgery treatment, the multiple lesions and distant metastasis usually led to the loss of opportunity of surgical treatment [27, 28]. Interesting, it was shown that patients who were recommended to receive surgery but did not receive operation finally still had favorable prognosis compared with those who had not receive surgical treatment due to the late stages of diseases, showing that apart from surgery, the clinical characteristics themselves had great impact on prognosis of patients with ACC. What is more, similar to other studies [8, 29], tumor size was proved not to be an independent prognostic factor for patients with ACC who were more frequently to have large tumors. In addition, there were no significant differences in OS and CSS stratified by tumor size in the present study. In this sense, different from PDAC [30, 31], large tumor should not be the contraindication of surgery for patients with ACC. The increasing number of patients who can receive surgery may ultimately improve the prognosis of patients with ACC.
Variables which were significant associated with prognosis of patients with CAA, such as age and surgery, were included into the established nomograms in this study. According to the nomogram based on the proportional hazard analysis of Cox regression model and Fine and Grey's model, there was a magnitude of poor prognosis as tumor grade changed from well to poor differentiation. Similar to other studies [6, 8], tumor grade was also proven to be an independent prognostic factor in patients with ACC in this study. Furthermore, the prognostic value of tumor grade was independent of other pathological variables, such as LN metastasis and distant metastasis, which are the main components of TNM stage system. Different nomogram scores were assigned to patients with different tumor grades although these patients might be classified as the same TNM stages. The inclusion of additional variables of nomograms leads to the differences of prognosis predicted by nomograms and TNM stage systems, and they may partly explain the superior power of nomograms in predicting OS and CSS compared with 7th and 8th edition TNM stage systems.
With regard to LN metastasis and distant metastasis, presence of LN metastasis and distant metastasis accounted for 33.5% and 40.5% of the total patients, respectively in this study. Although it was reported that incidences of metastasis to LN and distant organ for ACC are lower than those for PDAC [28], the presence of LN metastasis or distant metastasis would increase unresectable rates and indicate poorer prognosis in patients with ACC, which is similar to that of PDAC. In addition, previous studies [32] reported that LN metastasis occurred earlier in ACC than in PDAC and suggested the unfavorable prognosis. Similarly, our study also indicated that LN metastasis and distant metastasis were both independent prognostic factors in survival analysis and should be included into the systems for prognostic prediction.
Non-cancer-specific mortality is the main form of competing risk in survival analysis and should be considered when evaluating prognosis for decision-making and patient counseling. In the present study, compared with TNM stages, the combination of main elements of traditional stage systems and other tumor associated factors, such as surgery, age and tumor grade, enhances the discrimination power in predicting OS and CSS in patients with ACC, which was indicated by the comparison of C-indexes and values of AUC. A basis of a relatively large size of cohort could also make results more generalizable than those from single-center studies. Additionally, a clear risk stratification of survival rates or cancer-specific survival rates using nomogram predicted probabilities was demonstrated by survival curves or competing risk analysis. Furthermore, the established nomograms, which were composed of a few predictors, could be used by doctors to make accurate individual prognosis estimates.
This study has several limitations in this study. First, there was no relative information of some haematological indexes, such as carbohydrate antigen 19-9 (CA19-9) and α-fetoprotein (AFP), as well as some positive variables associated with prognosis, such as surgical margin status and vascular invasion, in the SEER dataset. These variables may be an effective complement to the existing stage systems and this will be a major part of our future research. In addition, some indices associated with the patient's basic information, such as comorbidity, did not serve as a predictor in competing risk nomogram. As age was selected as an important predictor in the nomograms and thus we regarded it as a proxy of comorbidity to offset the limitation. Moreover, all patients were used to form the training set to develop the nomogram, and half of patients were randomly selected to serve as an internal validation set in this study. Although this is a generally accepted method for nomogram construction and validation, external validation based on other population is still needed to estimate model accuracy. Finally, as user-friendly tools to help doctors to make decisions, the established nomograms did not include all prognostic factors and cannot always provide precise prognosis in clinical practice.
In conclusion, based on the competing risk analysis model and survival model established on the SEER database, the estimations of 1-, 2- and 3-year OS and CSS in patients with ACC were established for the first time in this study. Furthermore, our nomograms which showed relatively good performance might facilitate highly tailored patient management in clinical practice. However, further external validation is still needed.
Acknowledgements
This work was supported by grants from the National Natural Science Foundation of China (81171890; 81672390), the Major National Scientific Research Projects of China (No. 2013CB910304) and the School of Sociology and Anthropology-Sun Yat-sen University Cancer Center Joint Foundation on Medical Humanities (No. 201804).
Competing Interests
The authors have declared that no competing interest exists.
References
1. Cubilla AL, Fitzgerald PJ. Morphological patterns of primary nonendocrine human pancreas carcinoma. Cancer research. 1975;35:2234-48
2. Ordonez NG. Pancreatic acinar cell carcinoma. Advances in anatomic pathology. 2001;8:144-59
3. Williams JA. Regulation of pancreatic acinar cell function. Current opinion in gastroenterology. 2006;22:498-504
4. Caruso RA, Inferrera A, Tuccari G, Barresi G. Acinar cell carcinoma of the pancreas. A histologic, immunocytochemical and ultrastructural study. Histology and histopathology. 1994;9:53-8
5. Klimstra DS, Heffess CS, Oertel JE, Rosai J. Acinar cell carcinoma of the pancreas. A clinicopathologic study of 28 cases. The American journal of surgical pathology. 1992;16:815-37
6. Wisnoski NC, Townsend CM Jr, Nealon WH, Freeman JL, Riall TS. 672 patients with acinar cell carcinoma of the pancreas: a population-based comparison to pancreatic adenocarcinoma. Surgery. 2008;144:141-8
7. Matos JM, Schmidt CM, Turrini O, Agaram NP, Niedergethmann M, Saeger HD. et al. Pancreatic acinar cell carcinoma: a multi-institutional study. Journal of gastrointestinal surgery: official journal of the Society for Surgery of the Alimentary Tract. 2009;13:1495-502
8. Schmidt CM, Matos JM, Bentrem DJ, Talamonti MS, Lillemoe KD, Bilimoria KY. Acinar cell carcinoma of the pancreas in the United States: prognostic factors and comparison to ductal adenocarcinoma. Journal of gastrointestinal surgery: official journal of the Society for Surgery of the Alimentary Tract. 2008;12:2078-86
9. Mansfield A, Tafur A, Smithedajkul P, Corsini M, Quevedo F, Miller R. Mayo Clinic experience with very rare exocrine pancreatic neoplasms. Pancreas. 2010;39:972-5
10. Abraham SC, Wu TT, Hruban RH, Lee JH, Yeo CJ, Conlon K. et al. Genetic and immunohistochemical analysis of pancreatic acinar cell carcinoma: frequent allelic loss on chromosome 11p and alterations in the APC/beta-catenin pathway. The American journal of pathology. 2002;160:953-62
11. Lowery MA, Klimstra DS, Shia J, Yu KH, Allen PJ, Brennan MF. et al. Acinar cell carcinoma of the pancreas: new genetic and treatment insights into a rare malignancy. The oncologist. 2011;16:1714-20
12. Amin MB ES, Greene F. American Joint Committee on Cancer. AJCC Cancer Staging Manual. 8th ed. Chicago: Springer. 2017
13. Janssen-Heijnen ML, Houterman S, Lemmens VE, Louwman MW, Maas HA, Coebergh JW. Prognostic impact of increasing age and co-morbidity in cancer patients: a population-based approach. Critical reviews in oncology/hematology. 2005;55:231-40
14. Noordzij M, Leffondre K, van Stralen KJ, Zoccali C, Dekker FW, Jager KJ. When do we need competing risks methods for survival analysis in nephrology? Nephrology, dialysis, transplantation: official publication of the European Dialysis and Transplant Association - European Renal Association. 2013;28:2670-7
15. Gooley TA, Leisenring W, Crowley J, Storer BE. Estimation of failure probabilities in the presence of competing risks: new representations of old estimators. Statistics in medicine. 1999;18:695-706
16. Putter H, Fiocco M, Geskus RB. Tutorial in biostatistics: competing risks and multi-state models. Statistics in medicine. 2007;26:2389-430
17. Hollingsworth JM, Miller DC, Daignault S, Hollenbeck BK. Five-year survival after surgical treatment for kidney cancer: a population-based competing risk analysis. Cancer. 2007;109:1763-8
18. Lucas JT Jr, Colmer HGt, White L, Fitzgerald N, Isom S, Bourland JD. et al. Competing Risk Analysis of Neurologic versus Nonneurologic Death in Patients Undergoing Radiosurgical Salvage After Whole-Brain Radiation Therapy Failure: Who Actually Dies of Their Brain Metastases? International journal of radiation oncology, biology, physics. 2015;92:1008-15
19. Zhang J, Peng H, Chen L, Li WF, Mao YP, Liu LZ. et al. Decreased Overall and Cancer-Specific Mortality with Neoadjuvant Chemotherapy in Locoregionally Advanced Nasopharyngeal Carcinoma Treated by Intensity-modulated Radiotherapy: Multivariate Competing Risk Analysis. Journal of Cancer. 2017;8:2587-94
20. Edge SB BD, Comptom CC, Fritz AG, Greene FL. et al. American Joint Committee on Cancer. AJCC Cancer Staging Manual. 7th ed. New York: Springer. 2010
21. Gray RJ. A class of K-sample tests for comparing the cumulative incidence of a competing risk. The Annals of statistics. 1988:1141-54
22. Fine JP, Gray RJ. A proportional hazards model for the subdistribution of a competing risk. Journal of the American statistical association. 1999;94:496-509
23. Harrell FE Jr, Lee KL, Mark DB. Multivariable prognostic models: issues in developing models, evaluating assumptions and adequacy, and measuring and reducing errors. Statistics in medicine. 1996;15:361-87
24. Pencina MJ, D'Agostino RB. Overall C as a measure of discrimination in survival analysis: model specific population value and confidence interval estimation. Statistics in medicine. 2004;23:2109-23
25. Norris CM, Ghali WA, Saunders LD, Brant R, Galbraith D, Faris P. et al. Ordinal regression model and the linear regression model were superior to the logistic regression models. Journal of clinical epidemiology. 2006;59:448-56
26. Eguchi T, Bains S, Lee MC, Tan KS, Hristov B, Buitrago DH. et al. Impact of Increasing Age on Cause-Specific Mortality and Morbidity in Patients With Stage I Non-Small-Cell Lung Cancer: A Competing Risks Analysis. Journal of clinical oncology: official journal of the American Society of Clinical Oncology. 2017;35:281-90
27. Hartwig W, Denneberg M, Bergmann F, Hackert T, Hinz U, Strobel O. et al. Acinar cell carcinoma of the pancreas: is resection justified even in limited metastatic disease? American journal of surgery. 2011;202:23-7
28. Kitagami H, Kondo S, Hirano S, Kawakami H, Egawa S, Tanaka M. Acinar cell carcinoma of the pancreas: clinical analysis of 115 patients from Pancreatic Cancer Registry of Japan Pancreas Society. Pancreas. 2007;35:42-6
29. Seo S, Yoo C, Kim KP, Ryoo BY, Chang HM, Hong SM. et al. Clinical outcomes of patients with resectable pancreatic acinar cell carcinoma. Journal of digestive diseases. 2017;18:480-6
30. Deng QL, Dong S, Wang L, Zhang CY, Ying HF, Li ZS. et al. Development and Validation of a Nomogram for Predicting Survival in Patients with Advanced Pancreatic Ductal Adenocarcinoma. Scientific reports. 2017;7:11524
31. Hamada T, Nakai Y, Yasunaga H, Isayama H, Matsui H, Takahara N. et al. Prognostic nomogram for nonresectable pancreatic cancer treated with gemcitabine-based chemotherapy. British journal of cancer. 2014;110:1943-9
32. Holen KD, Klimstra DS, Hummer A, Gonen M, Conlon K, Brennan M. et al. Clinical characteristics and outcomes from an institutional series of acinar cell carcinoma of the pancreas and related tumors. Journal of clinical oncology: official journal of the American Society of Clinical Oncology. 2002;20:4673-8
Author contact
![]() Corresponding authors: Professor Xiaojun Lin, Department of Hepatobiliary and Pancreatic Surgery, State Key Laboratory of Oncology in South China, Collaborative Innovation Center for Cancer Medicine, Sun Yat-sen University Cancer Center, Guangzhou 510060, China. E-mail: linxjorg.cn and Professor Shengping Li, Department of Hepatobiliary and Pancreatic Surgery, State Key Laboratory of Oncology in South China, Collaborative Innovation Center for Cancer Medicine, Sun Yat-sen University Cancer Center, Guangzhou 510060, China. E-mail: lishporg.cn
Corresponding authors: Professor Xiaojun Lin, Department of Hepatobiliary and Pancreatic Surgery, State Key Laboratory of Oncology in South China, Collaborative Innovation Center for Cancer Medicine, Sun Yat-sen University Cancer Center, Guangzhou 510060, China. E-mail: linxjorg.cn and Professor Shengping Li, Department of Hepatobiliary and Pancreatic Surgery, State Key Laboratory of Oncology in South China, Collaborative Innovation Center for Cancer Medicine, Sun Yat-sen University Cancer Center, Guangzhou 510060, China. E-mail: lishporg.cn
Citation styles
APA
He, C., Zhang, Y., Cai, Z., Duan, F., Lin, X., Li, S. (2018). Nomogram to Predict Cancer-Specific Survival in Patients with Pancreatic Acinar Cell Carcinoma: A Competing Risk Analysis. Journal of Cancer, 9(22), 4117-4127. https://doi.org/10.7150/jca.26936.
ACS
He, C.; Zhang, Y.; Cai, Z.; Duan, F.; Lin, X.; Li, S. Nomogram to Predict Cancer-Specific Survival in Patients with Pancreatic Acinar Cell Carcinoma: A Competing Risk Analysis. J. Cancer 2018, 9 (22), 4117-4127. DOI: 10.7150/jca.26936.
NLM
He C, Zhang Y, Cai Z, Duan F, Lin X, Li S. Nomogram to Predict Cancer-Specific Survival in Patients with Pancreatic Acinar Cell Carcinoma: A Competing Risk Analysis. J Cancer 2018; 9(22):4117-4127. doi:10.7150/jca.26936. https://www.jcancer.org/v09p4117.htm
CSE
He C, Zhang Y, Cai Z, Duan F, Lin X, Li S. 2018. Nomogram to Predict Cancer-Specific Survival in Patients with Pancreatic Acinar Cell Carcinoma: A Competing Risk Analysis. J Cancer. 9(22):4117-4127.
This is an open access article distributed under the terms of the Creative Commons Attribution (CC BY-NC) license (https://creativecommons.org/licenses/by-nc/4.0/). See http://ivyspring.com/terms for full terms and conditions.