Journal of Cancer
ISSN: 1837-9664
3.2
Impact Factor
ISSN: 1837-9664

 Global reach, higher impact
J Cancer 2018; 9(22):4271-4278. doi:10.7150/jca.26777 This issue Cite
Research Paper
Interplay of Tumor Spread, Volume and Epstein-Barr Virus DNA in Nasopharyngeal Carcinoma: Feasibility of An Integrative Risk Stratification Scheme
Xin Zhou 1,2*, Youqi Yang1,2*, Xiaomin Ou 1,2, Tingting Xu1,2, Chunying Shen 1,2, Chaosu Hu1,2 ![]()
1. Department of Radiation Oncology, Fudan University Shanghai Cancer Center, Shanghai, 200032, China.
2. Department of Oncology, Shanghai Medical College, Fudan University, Shanghai, 200032, China.
*The coauthors contributed equally to the manuscript.
Received 2018-4-19; Accepted 2018-9-4; Published 2018-10-20
Citation:
Zhou X, Yang Y, Ou X, Xu T, Shen C, Hu C. Interplay of Tumor Spread, Volume and Epstein-Barr Virus DNA in Nasopharyngeal Carcinoma: Feasibility of An Integrative Risk Stratification Scheme. J Cancer 2018; 9(22):4271-4278. doi:10.7150/jca.26777. https://www.jcancer.org/v09p4271.htm
Other stylesAbstract
Purpose: To investigate the inter-correlation of tumor spread, volume and quantitative plasma Epstein-Barr virus DNA level (pEBV DNA), and to further assess the prognostic efficacy of a novel risk stratification combining anatomic, volumetric and biological features in nasopharyngeal carcinoma (NPC).
Methods and Materials: One hundred and twelve patients with non-metastatic NPC were prospectively enrolled. Correlation of pEBV DNA with tumor invasiveness, lymph node (LN) metastasis, tumor volume and classification was tested by univariate and multivariate analyses. 5-year distant metastasis free survival (DMFS) was evaluated using Kaplan-Meier method and Cox proportional hazards model.
Results: Tumor volume, TNM stage and pEBV DNA were strongly inter-correlated to each other. Nodal volume, skull base invasion and LN metastasis to supraclavicular fossa were determined to be independent predictors for pEBV DNA level. To exclude collinearity, a risk stratification based on combination of EBV DNA, nodal volume and anatomic features was established, offering significant distinguishing ability in 5-year DMFS. Further multivariate Cox regression analysis found the novel stratification to be independent predictor of DMFS.
Conclusions: Both anatomic spread and tumor volume contribute to pEBV DNA level, leading to strong inter-correlation between NPC stage, volume and EBV DNA. The proposed risk stratification combining anatomic, volumetric and biological features showed potential in refining DMFS prediction.
Keywords: AJCC cancer staging, Epstein-Barr virus DNA, nasopharyngeal carcinoma, tumor burden, tumor spread
Introduction
Nasopharyngeal carcinoma (NPC) is a unique head and neck cancer with distinct biological behavior. Based on the role of Epstein Barr virus (EBV) infection in etiology, quantitative plasma EBV DNA (pEBV DNA) has provided a mature minimally invasive method for the diagnosis and monitoring of NPC. Previous data have shown a correlation of pEBV DNA level with tumor burden [1, 2], suggesting that this cell-free DNA likely originates from the tumor mass. However, biological mechanisms underlying how EBV DNA enters bloodstream remain unclear. The difference between radiation-naive and post-irradiation locally recurrent NPC in detection sensitivity of EBV DNA [3] indicated the importance of tumor microenvironment [4] on EBV DNA efflux, but no further investigation has yet been presented in this field. Given the anatomic complexity of nasopharynx, the compromised structures might facilitate EBV DNA release into circulation through vasculature. Based on this hypothesis, we sought to specify the impact of tumor spread characteristics besides tumor volume on pEBV DNA level in non-disseminated NPC patients.
EBV DNA and tumor volume, as potential biomarkers to complement NPC tumor-node-metastasis (TNM) staging, an anatomy-based system, both correlate to TNM classification by American Joint Committee on Cancer (AJCC)/International Union Against Cancer (UICC) [5-7]. However, overall description of their mutual relationship has been limited, and optimal integration of the three systems for prognostication remains unclear; moreover, with publication of the 8th edition of AJCC/UICC staging system, whether the correlation based on earlier versions of staging could be extrapolated to a new setting needs to be validated. Therefore, another concern of this study is to evaluate the interplay of new tumor stage, tumor volume and EBV DNA, as well as the feasibility of an integrative risk stratification strategy combining anatomic, volumetric and biologic parameters of NPC.
Methods and Materials
Patient selection and image acquisition
Consecutive patients with biopsy-proven non-metastatic NPC in Fudan University Shanghai Cancer Center (FUSCC) were included in this study. Routine pretreatment assessment was conducted, including physical examination, biochemical profile of blood, nasopharyngoscopy, contrast-enhanced magnetic resonance imaging (MRI) scans of the nasopharynx and neck, conventional workup of chest computed tomography scan, abdominal ultrasound and Tc-99m MDP bone scintigraphy or 18F-FDG positron emission tomography-computed tomography scan (PET-CT).
Head and neck MRI were obtained with a 1.5T scanner (Signa; GE Medical Systems, Milwaukee, WI). The area from suprasellar cistern to the inferior margin of the sternal end of clavicle was covered. MRI protocol included unenhanced T1-weighted images (T1WI) in axial and sagittal plane, T2-weighted images (T2WI) in axial plane, as well as axial and coronal contrast-enhanced T1WI with fat suppression. Axial slice thickness was 3-5 mm for the area of nasopharynx and 5-6 mm for the neck.
Image interpretation and tumor volume measurement
Radiological images were evaluated under the common agreement of institutional multi-disciplinary treatment group of NPC. Cancer staging was based on both 7th and 8th edition of AJCC/UICC staging system. Critical tumor characteristics were recorded, including anatomical structures invaded by primary tumor as well as the positivity, level, laterality, size, the presence of extranodal spread (ENS) or necrosis of metastatic lymph nodes (LNs). In particular, as a semi-quantitative parameter of LN metastasis, number of LN regions was quantified by calculating the involved units of VIIa (retropharyngeal nodes), I, IIa, IIb, III, IVa, IVb, Va, Vb, Vc, VI, VIII, IX, X, following the 2013 consensus guideline for delineation of the neck node levels for head and neck tumors [8]. Supraclavicular fossa (SCF) LN metastasis was defined as level IVb (medial SCF group) or Vc (lateral SCF group) involvement.
All MR image data were transferred to a commercial radiological workstation (Advantage Workstation version 4.4; GE Medical Systems, Milwaukee, WI) for image post-processing. Using a three-dimensional (3D) MR maximum intensity projections (MIP) tool for image reconstruction and quantitative analysis, we measured the tumor volume of the primary tumor (Vp) and metastatic LNs (Vn) by delineating regions of interest on MRI. Total tumor volume (Vt) was recorded as sum of Vp and Vn.
pEBV DNA quantification
This study was approved by the Institutional Review Board of FUSCC; before treatment, a sample of 8 mL peripheral blood was collected with each patient's informed consent for clinical use and banking. After plasma isolation through centrifugation at 3000rpm for 10 minutes, DNA was extracted from plasma with QIAamp Blood Kit (Qiagen, Hilden, Germany) as per the blood and body fluid protocol. pEBV DNA concentration was measured using a quantitative real-time polymerase chain reaction (RT-PCR) assay targeting the BamHI-W region of EBV genome, the forward/reverse primer and dual-labeled fluorescent probe were generated per sequence previously reported by Lin et al [9]. DNA calibrators for standard curve were generated from a diploid EBV-positive cell line Namalwa and diluted to the final concentration of 20000, 10000, 1250, 250, 50, 25, 10 and 5 copies/reaction. All the samples were analyzed in triplicate. Quantitative results were expressed with copies/mL.
Statistical analysis
All statistical analyses were performed with Statistical Product and Service Solutions version 19.0 software (SPSS, Chicago, IL). Natural logarithm of pEBV DNA (lnDNA) and cubic root of Vp (crVp), Vn (crVn), Vt (crVt) were adopted to achieve normal and symmetrical distribution. lnDNA and crV in different groups was compared using Mann-Whitney U test or one-way analysis of variance (ANOVA). Relationship between lnDNA and crV was analyzed with Pearson's correlation analysis. Predictive factors for pEBV DNA were identified through stepwise multivariate linear regression analysis with inclusion of all volumetric and anatomic characteristics. Kaplan-Meier method and log-rank test were used for univariate survival analysis and Cox proportional hazards model was used for multivariate analysis. P value<0.05 was considered statistically significant with two-sided tests.
Results
A total of 112 patients with stage I-IVb (7th edition) NPC were prospectively enrolled in this study. Clinical characteristics are summarized in Table 1. 100% patients had positive pretreatment viral capsid antigen (VCA-IgA), while 99/112 (88.4%) had detectable EBV DNA. Gender and age were not associated with the detection rate or quantitative result of EBV DNA. Of those with undetectable pretreatment EBV DNA, 9/13 had T1N0 disease, 2/13 had T2N0, and 2/13 had T1-2N1 (with single marginally-positive retropharyngeal node). Detection rate of EBV DNA among stage I-IV NPC was 50%, 83%, 92.8% and 100%, respectively.
Tumor volume and EBV DNA level
The median Vp, Vn and Vtot of 112 cases was 17.9cm3 (range: 2.1-80.5), 9.05cm3 (range: 0-80.0) and 34.2cm3 (range: 4.0-94.6), respectively. The median pretreatment EBV DNA was 828 copies/mL (range: 0-133669). After data transformation, crVp (r=0.304, P=0.001), crVn (r=0.727, P<0.001) and crVt (r=0.701, P<0.001) all showed significant correlation with EBV DNA level. Subgroup analysis showed significant correlation between crVp and EBV DNA level among patients without skull base invasion (r=0.359, P=0.004), whereas for those with skull base invasion, the correlation became insignificant (P=0.962). Linear correlation between EBV DNA level and volumetric parameters is shown in Fig. 1A-1C. To evaluate the predictive value of tumor volumes on EBV DNA, a multivariate linear regression model was fitted by adjusting important clinical and radiological variables (as described below). crVn (adjusted R2=0.512, P<0.001) was identified to be a predominating determinant for EBV DNA level, compared to crVp (adjusted R2 change=0.013, P=0.035) as an independent but much weaker predictor (Table 2). crVt was excluded from the model due to collinearity.
Anatomic tumor spread and EBV DNA level
Radio-anatomical characteristics of primary tumor extension and regional nodal metastasis are summarized in Table 3. According to correlation analysis, primary tumor invasion and LN features are ubiquitously related to increased tumor volume; however, only parapharyngeal space (r=0.310, P= 0.001) and skull base invasion (r=0.249, P=0.002) among T-related factors attained statistical significance in relation to EBV DNA, whereas all N-related factors presented strong correlation to EBV DNA level. Interestingly, the quantitative LN regions, either as continuous or categorical variable, had the best concordance with pDNA (r=0.698, P<0.001) and crVn (r=0.755, P<0.001) among all anatomic characteristics. Comparison of median pEBV DNA in different groups is shown in Table 3.
Table 1
Patient characteristics based on 7th/8th edition of AJCC/UICC staging
| Characteristic | 7th AJCC/UICC | 8th AJCC/UICC | |||
|---|---|---|---|---|---|
| No | % | No | % | ||
| Gender | |||||
| Male | 87 | 77.7 | 87 | 77.7 | |
| Female | 25 | 22.3 | 25 | 22.3 | |
| Age | |||||
| <50 | 79 | 70.5 | 79 | 70.5 | |
| ≥50 | 33 | 39.5 | 33 | 39.5 | |
| Pathological type | |||||
| WHO I | 1 | 0.9 | 1 | 0.9 | |
| WHO II | 111 | 99.1 | 111 | 99.1 | |
| T classification | |||||
| T1 | 46 | 41.1 | 36 | 32.1 | |
| T2 | 15 | 13.4 | 26 | 23.2 | |
| T3 | 24 | 21.4 | 29 | 25.9 | |
| T4 | 27 | 24.1 | 21 | 18.8 | |
| N classification | |||||
| N0 | 20 | 17.9 | 20 | 17.9 | |
| N1 | 47 | 42.0 | 44 | 39.3 | |
| N2 | 35 | 31.3 | 24 | 21.4 | |
| N3 | 10 | 8.9 | 24 | 21.4 | |
| TNM stage | |||||
| I | 14 | 12.5 | 12 | 10.7 | |
| II | 30 | 26.8 | 30 | 26.8 | |
| III | 33 | 29.5 | 28 | 25.0 | |
| IVa-b(7th)/ IVa(8th) | 35 | 31.2 | 42 | 37.5 | |
AJCC/UICC: American Joint Committee on Cancer (AJCC)/International Union Against Cancer (UICC) staging system
Table 2
Independent predictors for plasma EBV DNA level
| Variables | P value | Standardized coefficient | Non-standardized coefficient | 95% CI | Adjusted R2 |
|---|---|---|---|---|---|
| crVn | <0.001 | 0.652 | 1.560 | 1.270-1.849 | 0.512 |
| Skull base invasion | 0.001 | 0.127 | 0.728 | 0.012-1.444 | 0.558 |
| Supraclavicular LNs | 0.001 | 0.230 | 2.658 | 1.252-4.063 | 0.598 |
| crVp | 0.035 | 0.153 | 0.721 | 0.051-1.392 | 0.611 |
Vn, volume of lymph nodes; Vp, volume of primary tumor; CI, confidence interval.
In the multivariate linear regression model, skull base (SB) invasion (adjusted R2 change=0.046, P=0.001) and SCF LN metastasis (adjusted R2 change =0.040, P=0.001) retained statistical significance apart from crVp and crVn (Table 2). Hence a regression equation was fitted as:
lnDNA=1.560✕crVn+0.728✕SB+2.658✕SCF+0.721✕crVp.
According to the equation, pEBV DNA level could be elevated by 4.7 or 2.0 folds per 1cm increase in crVn or crVp, while skull base invasion and SCF LN metastasis tend to raise pEBV DNA by 2.1 and 14.3 folds, respectively.
Table 3
Correlation of tumor volume, EBV DNA level with anatomic features of tumor spread
| Characteristics (primary and LNs) | Volume (cm3) (95% CI) † | P | pEBV DNA (copies/ml) (95% CI) | UVA P ‡ | MVA P ‡ | ||
|---|---|---|---|---|---|---|---|
| + | - | + | - | ||||
| Nasal cavity | 30.0(22.3-34.5) | 16.3(14.1-18.7) | <0.001* | 616 (264-1438) | 417 (209-831) | 0.511 | NA |
| Oropharynx | 35.1(16.1-65.2) | 18.7(16.4-21.2) | 0.014* | 658 (184-2360) | 461 (261-812) | 0.549 | NA |
| Parapharyngeal space | 27.9(23.4-33.0) | 13.9(12.2-15.9) | <0.001* | 1340 (715-2513) | 201 (92-440) | 0.001* | NA |
| Prevertebral space | 25.8(21.9-30.0) | 13.6(11.5-16.0) | <0.001* | 646 (314-1330) | 329 (145-747) | 0.216 | NA |
| Skull base | 28.8(24.1-34.0) | 13.9(12.2-15.8) | <0.001* | 1196 (618-2314) | 233 (108-504) | 0.002* | 0.001* |
| Paranasal sinus | 41.1(33.7-49.5) | 17.3(15.2-19.6) | <0.001* | 732 (284-1883) | 443 (243-807) | 0.557 | NA |
| Masticator space | 36.1(29.2-43.9) | 15.6(13.8-17.7) | <0.001* | 856 (405-1810) | 382 (196-742) | 0.073 | NA |
| Intracranial region | 42.3(35.6-59.7) | 16.1(14.2-18.1) | <0.001* | 788 (332-1867) | 422 (225-791) | 0.236 | NA |
| Hypopharynx/Orbit/Parotid gland/Infratemporal fossa | 48.5(31.4-70.8) | 18.0(15.9-20.3) | <0.001* | 1576 (383-6484) | 433 (246-763) | 0.252 | NA |
| Retropharyngeal LNs | 11.2(8.2-14.8) | 1.8(0.4-4.4) | <0.001* | 1051 (613-1800) | 98 (34-281) | <0.001* | NA |
| Cervical metastasis | 11.5(8.7-14.7) | 0 | <0.001* | 1163 (721-1875) | 20 (7-59) | <0.001* | NA |
| Bilateral LNs | 19.7(15.0-25.3) | 2.9(1.5-4.8) | <0.001* | 2138 (1048-4359) | 196 (100-383) | <0.001* | NA |
| >6cm | 43.7(29.3-62.1) | 6.0(4.1-8.5) | <0.001* | 5651 (1407-22695) | 442 (256-764) | 0.003* | NA |
| Infracricoid LNs | 26.1(17.3-37.5) | 4.0(2.5-5.9) | <0.001* | 6412 (3423-12010) | 236 (133-419) | <0.001* | NA |
| Supraclavicular LNs | 18.1(2.5-59.3) | 6.3(4.2-8.8) | 0.086 | 18791(4901-72091) | 388 (228-661) | <0.001* | 0.001* |
| Extranodal spread | 25.5(21.0-30.6) | 2.0(1.1-3.3) | <0.001* | 2840 (1503-5366) | 172 (89-330) | <0.001* | NA |
| Central necrosis | 26.0(20.7-32.2) | 2.9(1.7-4.6) | <0.001* | 3859 (2172-6857) | 201 (107-376) | <0.001* | NA |
| Involved LN subregions≥4 | 19.5(15.3-24.5) | 1.5(0.7-2.7) | <0.001* | 3159 (1244-8024) | 256 (141-466) | <0.001* | NA |
* Statistically significant, P<0.05. † volume of primary tumor and LNs was respectively correlated to primary and LN characteristics. ‡ Both UVA and MVA were based on the natural logarithm of pEBV DNA level. LN, lymph node; NA, not applicable; pEBV DNA, plasma EBV DNA; UVA, univariate analysis; MVA, multivariate analysis.
Figure 1
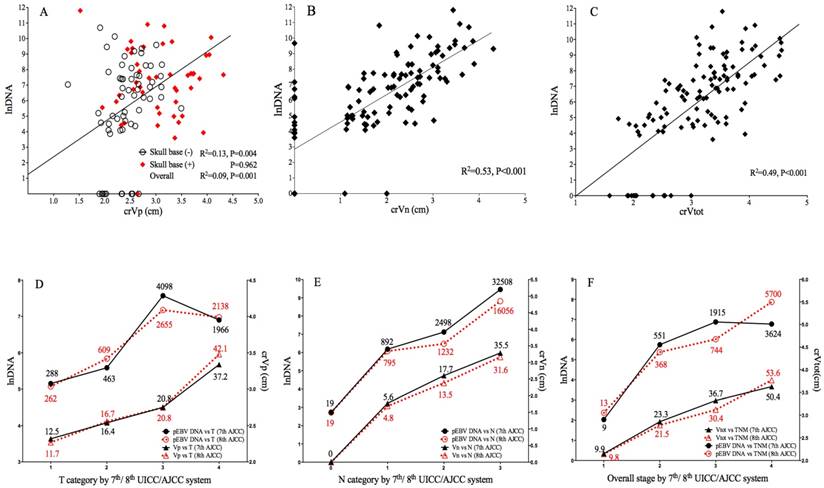
Correlation of pEBV DNA with tumor volume and tumor stage. A. Scatterplot of lnDNA vs. crVp; B. Scatterplot of lnDNA vs. crVn; C. Scatterplot of lnDNA vs. crVt; D. Comparison of lnDNA and crVp in different T categories by the 7th and 8th edition of AJCC staging system; E. Comparison of lnDNA and crVp in different N categories by the 7th and 8th edition of AJCC staging system; F. Comparison of lnDNA and crVp in different overall stages by the 7th and 8th edition of UICC/AJCC staging system. lnDNA, natural logarithm of plasma EBV DNA level; crVp, cubic root of primary tumor volume; crVn, cubic root of metastatic lymph node volume; crVt, cubic root of total tumor volume.
Figure 2
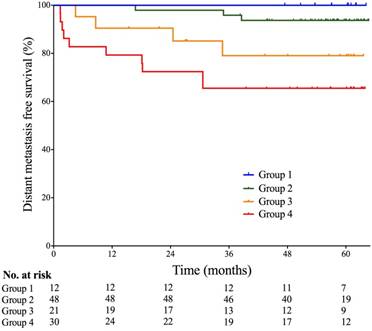
Probabilities of distant metastasis-free survival of patients based on multi-factor stratification. Group 1- Skull base invasion (-), LN (-), and pEBV DNA≤1500 copies/mL; Group 2- Skull base invasion (+) or 0<Vn≤25cm3, and SCF metastasis (-), and pEBV DNA≤1500 copies/mL; Group 3- 0<Vn≤25cm3, and SCF metastasis (-), and pEBV DNA≥1500 copies/mL; Group 4- Vn≥25cm3 or SCF metastasis (+), and pEBV DNA≥1500 copies/mL. Vn, volume of lymph nodes; SCF, supraclavicular fossa; pEBV DNA, plasma EBV DNA.
EBV DNA level, tumor volume and 7th/ 8th AJCC staging
In transition from 7th to 8th edition AJCC/UICC staging, 7.4% and 18.5% of T4 in 7th edition were downgraded to T2 and T3 because of re-categorization of pterygoid muscles, 21.7% of T1 were upgraded to T2 due to prevertebral muscle involvement, and 6.7% of T2 were upgraded to T4 due to tumor extension to parotid gland; for N category using cricoid cartilage as separation, 6.4% of N1 and 31.4% of N2 were upgraded to N3. Median pEBV DNA and tumor volume for each classification are shown in Fig.1.
Both 7th and 8th edition of staging strongly correlated with lnDNA and crV. The new classification of T, N and overall stage showed better linear correlation with crVp (R2 0.446 vs. 0.417), crVn (R2 0.643 vs. 0.587) and crVt (R2 0.573 vs. 0.472), suggesting an improved prediction of tumor volume by the 8th edition; for EBV DNA, the linear correlation was slightly weaker in 8th T (R2 0.076 vs. 0.086), but stronger in N (R2 0.386 vs. 0.362) and overall stage (R2 0.312 vs. 0.304) (Fig. 1 D-1F).
Risk stratification combining pEBV DNA and tumor features
Given the strong collinearity of pEBV DNA with tumor anatomy (skull base invasion, LN metastasis to SCF) and tumor volume (Vn), patients were stratified into four groups based on both pEBV DNA and tumor features: I- Skull base invasion (-), LN (-), and pEBV DNA≤1500 copies/mL; II- Skull base invasion (+) or 0<Vn≤25cm3, and SCF metastasis (-), and pEBV DNA≤1500 copies/mL; III- 0<Vn≤25cm3, and SCF metastasis (-), and pEBV DNA≥1500 copies/mL; IV- Vn≥25cm3 or SCF metastasis (+), and pEBV DNA≥1500 copies/mL. Significant disparity of distant metastasis free survival DMFS was found among the risk stratifications (log rank test P=0.004). 5-year DMFS was 100%, 93.7%, 79.1% and 65.5%, resprectively (Fig. 2). In multivariate cox regression analysis, this stratification model outweighed N-classification, overall stage and Vn and remained a powerful independent prognostic factor for DMFS (P<0.001).
Discussion
Despite a cumulative body of data for EBV DNA in cancer screening, diagnosis, prognosis and surveillance, understanding of its origin and biology is still insufficient. It's been generally thought that EBV DNA originates from tumor cells upon apoptosis, necrosis or secretion [10, 11], however, these hypotheses didn't explain its interaction with microenviroment and hemodynamics in vivo. To our knowledge, our study is the first report to demonstrate the impact of anatomic features apart from tumor volume on pretreatment pEBV DNA level and further to propose a preliminary model for its prediction.
Predominant effect of nodal burden on EBV DNA level
As was previously reported in NPC, EBV DNA seems to reflect tumor burden derived from planning CT with/without the assistance of MRI [12, 13]. However, these conclusions might be compromised by serious biases in tumor volume measurement due to the poor definition of CT images and a tendency of overdrawing primary tumor. Moreover, in the case of LN shrinkage after neoadjuvant chemotherapy, tumor volume calculation on post-chemo planning CT may cause a serious underestimation of nodal burden. Initial MRI, in contrast, provides more reliable instrument for pretreatment evaluation of tumor volume; nevertheless, such studies have been extremely limited in the context of EBV DNA. Ma et al. first reported in advanced NPC an association of EBV DNA with MRI-derived primary and LN tumor burden [2], which was proved by our study in a larger population covering stage I-IVb disease. However, we realized that the extent of association with primary tumor and LNs was unequal. pEBV DNA level was strongly related to all LN features while being less sensitive to T-related factors. Through multivariate linear regression, Vn retained a strikingly stronger predictive value than Vp (adjusted R2 change 0.512 vs. 0.013), suggesting that LN volume has a predominant advantage over primary tumor in determining pEBV DNA level. We believe it is the first study to propose this concept by now.
This phenomenon, however, has been indicated in previous reports. Shao et al. noticed that the disparity of EBV DNA between different T categories becomes insignificant once nodal metastasis occurs [14].Chen et al. found that pretreatment plasma EBV-DNA level correlated with Vn and Vtot but not Vp [15]. Another study in stage II NPC reported a weak link of EBV DNA with Vp, compared to the strong correlation with Vn and Vtot [16]. Plausible explanations behind this phenomenon might include: 1) cell free DNA-related apoptosis and necrosis is more associated with LN expansion than primary tumor growth [17]; 2) Rich efferent lymphatic vasculature in enlarged LNs provide a route for DNA collection and shedding [18], especially on the existence of ENS. 3) Tumor cells in metastatic LNs can directly invade local blood vessels and seed distant organs [19]. Future investigation to explore the heterogeneity between primary tumor and metastatic LNs in the association with EBV DNA and tumor blood dissemination is warranted.
Impact of tumor vasculature and LN location on EBV DNA
To date, EBV DNA in relation to primary NPC invasion and vascularity has been reported in only one series with negative results [20]. In contrast, our study found a significant correlation of parapharyngeal space and skull base invasion with pEBV DNA level. After adjusting for potential collinearity, skull base invasion was identified to be an independent predictor for EBV DNA, which leads to 2.1 times elevation of plasma EBV DNA. This is quite concordant with Shao's finding of significantly higher EBV DNA in T3-4N0 than that in T1-2N0 patients (median 17165 vs. 4050 copies/mL, P=0.03) [14]. Moreover, our subgroup analysis revealed that the linear relationship between crVp and pEBV DNA seems to exist only in patients with locally-early disease, once skull base is involved, pEBV DNA gets higher but unpredictable, suggesting that skull base might provide extra contribution to pEBV DNA other than the effect of increased Vp.
Theoretically, tumor vascularity is essential for the accessibility of tumor-derived molecules to the blood. For example, with the existence of blood-brain barrier, patients with primary brain tumors have extremely low levels of plasma ctDNA, compared to the abundant ctDNA in cerebrospinal fluid [21]. In NPC, circulating EBV DNA is more difficult to detect after radiation due to the decrease in vascularity and tissue fibrosis [3, 4, 22]. In the present study, the effect of skull base invasion on EBV DNA could reasonably be explained by the existence of rich blood sinuses and anastomotic microvascular network within these spongy osseous structures [23]. This is in agreement with previous clinical findings that skull base invasion in NPC independently predict a higher risk of distant metastasis [24, 25]. It was believed that intratumoral vascular shunting through larger arteriovenous connections to capillary beds facilitates circulating tumor cells (CTCs) shedding into blood stream and thus remarkably increases the potency of distant metastasis [26]. Therefore, we postulate that compromised tumor vasculature in skull base provides a shortcut for blood dissemination of both apoptotic DNA and CTCs, the latter of which could in return add to plasma EBV DNA through active secretion. This conclusion, although drawn in a treatment-naive setting, seemed also applicable to locally recurrent NPC. Chan et al. reported significantly higher pEBV DNA in recurrent patients receiving palliative nasopharyngectomy (mostly rT3-4), indicating a lasting effect of skull base invasion on EBV DNA after radiation [27].
SCF metastasis was identified to be another independent predictor for pEBV DNA in this study. In fact, patients with SCF LNs had similar Vn (crVn 3.10cm vs. 3.18cm, P=0.324) but remarkably higher pEBV DNA (lnEBV DNA 9.67 vs. 8.76, P=0.031), compared with N3 patients without SCF involvement, suggesting the impact of LN location on EBV DNA is independent of LN volume. A natural explanation would be the proximity to the thoracic duct or right lymphatic duct that drain lymph from SCF directly into blood [28], potentially causing increased output of circulating tumor cells and EBV DNA. This echoes a previous concept that the prognostic value of EBV DNA lies mainly in predicting distant metastasis. Moreover, SCF involvement with high EBV DNA level may indicate subclinical distant micrometastases on diagnosis and correspondingly a need for therapy adjustment, for instance, more intensified chemotherapy. In our risk stratification, a highest 5-year DMFS risk (35.5%) was seen in patients with pEBV DNA≥1500 copies/mL as well as SCF metastasis or large LN burden, however, due to the relatively small sample size in our study, these results will need to be validated in a larger cohort in future.
Intercorrelation among EBV DNA, tumor volume and TNM systems
TNM staging, tumor volume and EBV DNA are currently most important prognostic instruments for NPC; better understanding of their inter-correlation will provide insight into optimal integration of the three systems for prognostication. Consistent with previous reports [6, 7], we demonstrated a positive correlation of both EBV DNA and tumor volume with the 7th edition of T and N classification, suggesting that TNM staging fairly reflects the anatomic and biological tumor burden in NPC. When restaged using the 8th edition, the T/N classification showed even better prediction of tumor burden, particularly in LNs and total tumor lesions. This might account for the improved distinction of distant failure and overall survival with the new staging system in recent studies [29, 30].
Risk stratification combining anatomic, volumetric and biological tumor features
Multi-collinearity among EBV DNA, tumor volume and TNM staging strongly suggests that their prognostic effect might be interdependent and overlapped. Earlier efforts have been made to integrate EBV DNA into TNM staging system, which, as a result, refined risk stratification in different NPC stages [31, 32]. However, this stratification was based on overall stage without distinguishing the effect of T and N ingredients, whether it could be applied to a new staging system remains elusive. Lu et al. proposed a stratification strategy for NPC using combinations of EBV DNA and tumor volumes [13]. However, TNM-related anatomic information was missing in this study. By now, there has hardly been an attempt to integrate all three systems. According to our findings, EBV DNA level is influenced by both anatomic and volumetric features of primary tumor and metastatic LNs, its independent prognostic value outside these factors should be further explored through more specified subgroup analysis. Therefore, we experimentally integrated skull base invasion, LN volume, SCF metastasis and EBV DNA level for risk stratification and found good distinction of DMFS among four subgroups. With distant metastasis becoming major pattern of failure for NPC nowadays, we hope this stratification could offer a direction for better prediction of DMFS in future. However, studies with larger population will be needed for validation before solid conclusions can be drawn.
Limitations of study and future directions
Although with reliable MRI-derived volume calculation and satisfactory follow-up, this study had relatively small sample size and conclusions should be interpreted with caution. We believe future efforts will be warranted for validation in an expanded patient population; in particular, as a special finding in our study, the different effect of nodal volume and local anatomy on pEBV DNA level also suggested the importance to further investigate the underlying histological and molecular mechanisms.
Abbreviations
pEBV DNA: plasma Epstein-Barr virus DNA; NPC: nasopharyngeal carcinoma; LN: lymph node; DMFS: distant metastasis free survival; TNM: tumor-node-metastasis; AJCC: American Joint Committee on Cancer; UICC: International Union Against Cancer; PET-CT: positron emission tomography-computed tomography; MRI: magnetic resonance imaging; ENS: extranodal spread; SCF: Supraclavicular fossa; MIP: maximum intensity projection; RT-PCR: real-time polymerase chain reaction; ANOVA: one-way analysis of variance; VCA-IgA: viral capsid antigen; lnDNA: natural logarithm of plasma EBV DNA level; crVp: cubic root of primary tumor volume; crVn: cubic root of metastatic lymph node volume; crVt: cubic root of total tumor volume; CI: confidence interval.
Acknowledgements
We are grateful to Dr. CY Shen and Dr. TT Xu for providing guidance of radiological review, and to XM Ou for valuable discussion; special thanks are owed to Dr. CS Hu for the technical support with study design and progress.
Competing Interests
The authors have declared that no competing interest exists.
References
1. Chan KC, Chan ATC, Leung SF. et al. Investigation into the origin and tumoral mass correlation of plasma Epstein-Barr virus DNA in nasopharyngeal carcinoma. Clin Chem. 2005;51(11):2192-95
2. Ma BB, King A, Lo YM. et al. Relationship between pretreatment level of plasma Epstein-Barr virus DNA, tumor burden, and metabolic activity in advanced nasopharyngeal carcinoma. Int J Radiat Oncol Biol Phys. 2006;66(3):714-20
3. Leung S, Lo YM, Chan AT. et al. Disparity of sensitivities in detection of radiation-naive and postirradiation recurrent nasopharyngeal carcinoma of the undifferentiated type by quantitative analysis of circulating Epstein-Barr virus DNA1, 2. Clin Cancer Res. 2003;9(9):3431-34
4. Hopewell JW, Young CM. Changes in the microcirculation of normal tissues after irradiation. Int J Radiat Oncol Biol Phys. 1978;4:53-58
5. Lo YM, Leung SF. et al. Plasma cell-free Epstein-Barr virus DNA quantitation in patients with nasopharyngeal carcinoma. Correlation with clinical staging. Ann N Y Acad Sci. 2000;906:99-101
6. Sun P, Chen C, Cheng YK. et al. Serologic biomarkers of Epstein-Barr virus correlate with TNM classification according to the seventh edition of the UICC/AJCC staging system for nasopharyngeal carcinoma. Eur Arch Otorhinolaryngol. 2014;271(9):2545-54
7. Chong VF, Zhou JY, Khoo JB. et al. Correlation between MR imaging-derived nasopharyngeal carcinoma tumor volume and TNM system. Int J Radiat Oncol Biol Phys. 2006;64(1):72-76
8. Grégoire Vincent. et al. Delineation of the neck node levels for head and neck tumors: a 2013 update. DAHANCA, EORTC, HKNPCSG, NCIC CTG, NCRI, RTOG, TROG consensus guidelines. Radiother Oncol. 2014;110(1):172-81
9. Lin JC, Wang WY, Chen KY. et al. Quantification of plasma Epstein-Barr virus DNA in patients with advanced nasopharyngeal carcinoma. N Engl J Med. 2004;350(24):2461-70
10. Stroun M, Lyautey J, Lederrey C. et al. About the possible origin and mechanism of circulating DNA: apoptosis and active DNA release. Clin Chim Acta. 2001;313(1-2):139-42
11. Chan KA, Zhang J, Chan AT. et al. Molecular characterization of circulating EBV DNA in the plasma of nasopharyngeal carcinoma and lymphoma patients. Cancer Res. 2003;63(9):2028-32
12. Hou X, Zhao C, Guo Y. et al. Different clinical significance of pre- and post-treatment plasma Epstein-Barr virus DNA load in nasopharyngeal carcinoma treated with radiotherapy. Clin Oncol. 2011;23(2):128-33
13. Lu L, Li J, Zhao C. et al. Prognostic efficacy of combining tumor volume with Epstein-Barr virus DNA in patients treated with intensity-modulated radiotherapy for nasopharyngeal carcinoma. Oral Oncol. 2016;60:18-24
14. Shao JY, Zhang Y, Li YH. et al. Comparison of Epstein Barr virus DNA level in plasma, peripheral blood cell and tumor tissue in nasopharyngeal carcinoma. Anticancer Res. 2004;24(6):4059-66
15. Chen M, Yin L, Wu J. et al. Impact of Plasma Epstein-Barr Virus-DNA and Tumor Volume on Prognosis of Locally Advanced Nasopharyngeal Carcinoma. Biomed Res Int. 2015;2015:617949. doi: 10.1155/2015/617949
16. Chen QY, Guo SY, Tang LQ. et al. Combination of Tumor Volume and Epstein-Barr Virus DNA Improved Prognostic Stratification of Stage II Nasopharyngeal Carcinoma in the IMRT Era: A Large-Scale Cohort Study. Cancer Res Treat. 2017;50(3):861-871
17. Matsuda H, Strebel FR, Kaneko T. et al. Apoptosis and necrosis occurring during different stages of primary and metastatic tumor growth of a rat mammary adenocarcinoma. Anticancer Res. 1996;16(3A):1117-21
18. Pereira ER, Jones D, Jung K. et al. The lymph node microenvironment and its role in the progression of metastatic cancer. Semin Cell Dev Biol. 2015;38(3):98-105
19. Pereira ER, Kedrin D, Padera TP. et al. Lymph node metastases can invade local blood vessels, exit the node, and colonize distant organs in mice. Science. 2018;359(6382):1403-07
20. Ma BB, Mo FK, Chan AT. et al. The prognostic significance of tumor vascular invasion and its association with plasma Epstein-Barr virus DNA, tumor volume and metabolic activity in locoregionally advanced nasopharyngeal carcinoma. Oral Oncol. 2008;44(11):1067-72
21. De Mattos-Arruda, Mayor R. et al. Cerebrospinal fluid-derived circulating tumour DNA better represents the genomic alterations of brain tumours than plasma. Nat Commun. 2015;6:8839
22. Hsu CL, Chan SC, Chang KP. et al. Clinical scenario of EBV DNA follow-up in patients of treated localized nasopharyngeal carcinoma. Oral Oncol. 2013;49(6):620-25
23. Vutskits L. et al. The “rete mirabile” of the clivus and the dorsum sellae. A microanatomical study. Minim Invasive Neurosurg. 1996;39(4):138-40
24. Cheng YK, Ma J. et al. MRI-detected skull-base invasion: prognostic value and therapeutic implication in intensity-modulated radiotherapy treatment for nasopharyngeal carcinoma. Strahlenther Onkol. 2014;190(10):905-11
25. Chen L, Liu LZ, Ma J. et al. Grading of MRI-detected skull-base invasion in nasopharyngeal carcinoma and its prognostic value. Head Neck. 2011;33(9):1309-14
26. Deipolyi AR, Zhu AX, Oklu R. Intratumoral Vascular Shunting: Biomarker of Clinical Outcome and Source of Circulating Tumor Cells? Am J Clin Oncol. 2015;38(6):621-26
27. Chan JY, Chow VL, Mok VW. et al. Prediction of surgical outcome using plasma Epstein-Barr virus dna and 18F-FDG PET-CT scan in recurrent nasopharyngeal carcinoma. Head Neck. 2012;34(4):541-45
28. Skandalakis JE, Skandalakis LJ, Skandalakis PN. Anatomy of the lymphatics. Surg Oncol Clin N Am. 2007;16(1):1-16
29. Pan JJ, Ng WT, Lee AW. et al. Proposal for the 8th edition of the AJCC/UICC staging system for nasopharyngeal cancer in the era of intensity-modulated radiotherapy. Cancer. 2016;122(4):546-58
30. Tang LL, Chen YP, Ma J. et al. Validation of the 8th Edition of the UICC/AJCC Staging System for Nasopharyngeal Carcinoma From Endemic Areas in the Intensity-Modulated Radiotherapy Era. J Natl Compr Canc Netw. 2017;15(7):913-19
31. Leung SF, Zee B, Chan AT. et al. Plasma Epstein-Barr viral deoxyribonucleic acid quantitation complements tumor-node-metastasis staging prognostication in nasopharyngeal carcinoma. J Clin Oncol. 2006;24(34):5414-18
32. Zhang L, Tang LQ, Mai HQ. et al. Plasma Epstein-Barr viral DNA complements TNM classification of nasopharyngeal carcinoma in the era of intensity-modulated radiotherapy. Oncotarget. 2016;7(5):6221-30
Author contact
![]() Corresponding author: Chaosu Hu, Department of Radiation Oncology, Fudan University Shanghai Cancer Center, 270 Dong'an Road, Shanghai 200032, China. Tel: (+86) 21-64175590-1400; Fax: (+86) 21-64173612; Email: hucsu62com
Corresponding author: Chaosu Hu, Department of Radiation Oncology, Fudan University Shanghai Cancer Center, 270 Dong'an Road, Shanghai 200032, China. Tel: (+86) 21-64175590-1400; Fax: (+86) 21-64173612; Email: hucsu62com
Citation styles
APA
Zhou, X., Yang, Y., Ou, X., Xu, T., Shen, C., Hu, C. (2018). Interplay of Tumor Spread, Volume and Epstein-Barr Virus DNA in Nasopharyngeal Carcinoma: Feasibility of An Integrative Risk Stratification Scheme. Journal of Cancer, 9(22), 4271-4278. https://doi.org/10.7150/jca.26777.
ACS
Zhou, X.; Yang, Y.; Ou, X.; Xu, T.; Shen, C.; Hu, C. Interplay of Tumor Spread, Volume and Epstein-Barr Virus DNA in Nasopharyngeal Carcinoma: Feasibility of An Integrative Risk Stratification Scheme. J. Cancer 2018, 9 (22), 4271-4278. DOI: 10.7150/jca.26777.
NLM
Zhou X, Yang Y, Ou X, Xu T, Shen C, Hu C. Interplay of Tumor Spread, Volume and Epstein-Barr Virus DNA in Nasopharyngeal Carcinoma: Feasibility of An Integrative Risk Stratification Scheme. J Cancer 2018; 9(22):4271-4278. doi:10.7150/jca.26777. https://www.jcancer.org/v09p4271.htm
CSE
Zhou X, Yang Y, Ou X, Xu T, Shen C, Hu C. 2018. Interplay of Tumor Spread, Volume and Epstein-Barr Virus DNA in Nasopharyngeal Carcinoma: Feasibility of An Integrative Risk Stratification Scheme. J Cancer. 9(22):4271-4278.
This is an open access article distributed under the terms of the Creative Commons Attribution (CC BY-NC) license (https://creativecommons.org/licenses/by-nc/4.0/). See http://ivyspring.com/terms for full terms and conditions.