Journal of Cancer
ISSN: 1837-9664
3.2
Impact Factor
ISSN: 1837-9664

 Global reach, higher impact
J Cancer 2018; 9(23):4463-4476. doi:10.7150/jca.26417 This issue Cite
Research Paper
Identification of Grade-associated MicroRNAs in Brainstem Gliomas Based on Microarray Data
Xin Chen1*, Dezuo Dong2*, Changcun Pan1, Cheng Xu1, Yu Sun1, Yibo Geng1, Lu Kong1, Xiong Xiao1, Zitong Zhao3, Wei Zhou3, Lijie Huang3, Yongmei Song3 ![]() , Liwei Zhang1
, Liwei Zhang1 ![]()
1. Department of Neurosurgery, Beijing Tiantan Hospital, Capital Medical University, Tiantanxili 6, Dongcheng District, Beijing, 100050, China.
2. Department of Radiation Oncology, Key Laboratory of Carcinogenesis and Translational Research (Ministry of Education/Beijing), Peking University Cancer Hospital and Institute, Beijing, 100142, China.
3. State Key Laboratory of Molecular Oncology, National Cancer Center/Cancer Hospital, Chinese Academy of Medical Sciences and Peking Union Medical College, Beijing, 100021, China.
*The authors contributed equally to this work.
Received 2018-4-1; Accepted 2018-8-1; Published 2018-10-31
Citation:
Chen X, Dong D, Pan C, Xu C, Sun Y, Geng Y, Kong L, Xiao X, Zhao Z, Zhou W, Huang L, Song Y, Zhang L. Identification of Grade-associated MicroRNAs in Brainstem Gliomas Based on Microarray Data. J Cancer 2018; 9(23):4463-4476. doi:10.7150/jca.26417. https://www.jcancer.org/v09p4463.htm
Other stylesAbstract
Gliomas arising in the brainstem are rare tumours that are difficult to surgically resect, and the microRNAs (miRNAs) and signalling pathways associated with brainstem gliomas (BSGs) are largely unknown. To identify grade-associated miRNAs in BSGs, a microarray analysis of 10 low-grade and 15 high-grade BSGs was performed in this study. Differentially expressed miRNAs (DE-miRNAs) were identified, and the functional DE-miRNAs were selected. The potential target genes and enriched pathways were analysed, and a target gene-associated protein-protein interaction (PPI) network was generated. Grade-associated functional DE-miRNAs were confirmed by real-time quantitative PCR. First, 28 functional DE-miRNAs, including 13 upregulated miRNAs and 15 downregulated miRNAs, were identified. Second, 2546 target genes that were involved in BSG-related pathways, such as signalling pathways regulating the pluripotency of stem cells, the AMPK signalling pathway, the HIF-1 signalling pathway, the PI3K-Akt signalling pathway, the Wnt signalling pathway and the Hippo signalling pathway, were screened. Third, PHLPP2 and VEGFA were identified as hub genes in the PPI network. Last, we found that hsa-miR-34a-5p inhibits BSG cell invasion in vitro. In summary, using integrated bioinformatics analysis, we have identified the potential target genes and pathways of grade-associated functional DE-miRNAs in BSGs, which could improve the accuracy of prognostic evaluation. Furthermore, these hub genes and pathways could be therapeutic targets for the treatment of BSGs.
Keywords: brainstem gliomas, bioinformatical analysis, microRNAs, microarray, prognosis
Introduction
Brainstem gliomas (BSGs) are rare tumours that occur in the midbrain, pons, and medulla oblongata. BSGs are more commonly found in children and account for 10% of all paediatric brain tumours, while BSGs represent only up to 2% of all adult brain tumours [1]. Patients with low-grade BSGs, which are defined as WHO (World Health Organization) grades I and II, have been reported to have a median survival time of 26.2 to 87.3 months [2-4]. However, patients with high-grade BSGs (WHO grades III and IV) have a dismal prognosis, with a median survival time of 9.8 to 17 months [2,5,6]. Current BSG treatment strategies include biopsy and/or microsurgery for a pathological diagnosis followed by adjuvant therapy, such as chemotherapy, radiotherapy, or targeted drugs [4,7]. Radiotherapy is the standard treatment for BSGs, and a total dose of 54 greys (Gy) in daily fractions of 1.8 Gy to 2.0 Gy is most commonly used; however, irradiation can only transiently alleviate tumour progression [8,9]. Chemotherapy does not have any significant effect on the outcome [10]. Moreover, there are some reports of salvage targeted therapy with bevacizumab and experimental treatments with etoposide, paclitaxel, and tamoxifen; the challenge comes from the lack of tumour-specific targets [6,11]. Thus, the treatment of BSGs is difficult, and new research breakthroughs are needed.
MicroRNAs (miRNAs) are small non-coding endogenous RNA molecules of approximately 21 nucleotides in length that silence genes by the post-transcriptional regulation of protein expression [12]. miRNAs can bind to the 3'-untranslated regions of target mRNAs and regulate gene expression by inhibiting mRNA translation or degrading the mRNA transcripts. According to their expression levels and major target genes, miRNAs may act as oncogenic miRNAs or tumour suppressor miRNAs in cancer development and progression [13]. Studies have shown that miRNAs are associated with angiogenesis, invasion, and altered metabolism in gliomas. For example, Babae et al recently found that miR-7 is downregulated in gliomas and inhibits angiogenesis by targeting O-linked-N-acetylglucosamine transferase [14]. miR-21 is upregulated in gliomas and promotes invasion by targeting specific inhibitors of matrix metalloproteases (MMPs), such as reversion-inducing-cysteine-rich protein with kazal motifs (RECK), myristoylated alanine-rich C-kinase substrate protein (MARCKS) and tissue inhibitors of metalloproteases 3 (TIMP3) [15,16]. miR-451 is upregulated in gliomas and promotes tumour cell proliferation and migration by directly targeting coenzyme A biosynthesis protein 3 (CAB3) [17,18]. Since miRNAs do not perfectly hybridize with their target mRNAs, they can target thousands of genes whose protein products function in a variety of signalling pathways, which may affect multiple pathways and networks in carcinogenesis, making miRNAs promising targets for effective treatment.
Since miRNAs regulate transcript stability and the translation of many target genes involved in the development and progression of gliomas, studies of the regulatory relationship between miRNAs and their target genes are useful. However, studies concerning grade-associated miRNAs in BSGs based on human tissues are scarce. In the present study, the expression profiles of miRNAs in 25 BSG tissue samples were obtained by using microarrays. Functional differentially expressed miRNAs (DE-miRNAs) in low- and high-grade BSGs were screened by Student's t-tests, Kaplan-Meier survival plots and log-rank tests. We predicted the genes targeted by the functional DE-miRNAs, and we also characterized their underlying molecular mechanisms by Gene Ontology (GO) term analysis and Kyoto Encyclopedia of Genes and Genomes (KEGG) pathway enrichment analysis. Furthermore, protein-protein interaction (PPI) networks of the predicted target genes were constructed. To the best of our knowledge, this study was the first to explore the differential expression of functional DE-miRNAs between high- and low-grade brainstem gliomas and to predict the related target genes and their pathways through bioinformatics analysis. The present study aimed to explore the molecular mechanisms underlying BSGs and to identify effective prognostic predictors and promising therapeutic targets of BSGs.
Materials and methods
Cohort and samples investigated
Samples were collected from patients with BSGs who underwent microsurgical treatment in Beijing Tiantan Hospital between 2013 and 2017. We used strict exclusion criteria that included the following: 1) patients whose inpatient records were missing; 2) patients whose follow-up records were missing; 3) patients with ambiguous histopathologic diagnosis; and 4) patients whose tumour tissue did not meet the requirements of the miRNA arrays. The Beijing Tiantan Hospital Research Ethics Committee approved this study, and written informed consent was obtained from the subjects' parents. Histological data were reviewed to confirm the diagnosis. All the pathologic sections were observed by at least two experienced pathology experts.
Clinical data analysis
The clinical data, including age, sex, Karnofsky performance scale (KPS), pathological diagnoses, adjuvant therapies and overall survival (OS), were acquired from inpatient records and follow-up data. Follow-up was conducted mainly by telephone interviews because most patients were unable to revisit the hospital.
Establishment of BSG cell lines, cell culture and transfection
In previous studies, we successfully established 8 BSG cell lines (TT10603, TT10728, TT10902, TT11118, TT11201, TT10630, TT10714 and TT11111), and all the patients were diagnosed with high-grade gliomas (3 cases of grade III anaplastic astrocytoma AA, 2 cases of grade III anaplastic oligodendroastrocytoma AOA, and 3 cases of grade IV glioblastoma GBM) [19]. The protocol was approved by the Beijing Tiantan Hospital Research Ethics Committee, and written informed consent was obtained from the subjects' parents.
We selected 3 BSG cell lines, of which 2 (TT10728 and TT11201) were grade IV GBM and one (TT10630) was grade III AA. Cells were plated in poly-L-ornithine (PLO)/laminin-coated 6-well plates. The composition of the serum-free medium was as follows: DMEM (GIBCO, USA), L-glutamine, sodium pyruvate, B27, N2, insulin (20 µg/ml), bFGF (20 ng/ml), EGF (20 ng/ml), PDGFAB (20 ng/ml) and heparin (10 ng/ml) (Invitrogen, USA). All cell lines were maintained at 37°C in a fully humidified incubator with 5% CO2. The hsa-miR-34a-5p mimic and negative control were obtained from RiboBio (Guangzhou, China). Transfection was performed using Lipofectamine 2000 (Invitrogen, USA) according to the manufacturer's instructions.
Transwell cell invasion assays
Transwell filters (Costar, USA) were coated with 100 μl of 2% Matrigel (BD Biosciences, USA) on the upper surface of the polycarbonic membrane (diameter, 6.5 mm; pore size, 8 mm). Following a 60-min incubation at 37°C, the Matrigel solidified and served as an extracellular matrix for tumour cell invasion analysis. BSG cells at 5×10⁵ cells/100 μl of serum-free DMEM were seeded into the upper chamber. The lower chambers were filled with medium containing 10% foetal bovine serum. After 12 h, the migrated cells were fixed in methanol for 5 min and stained with crystal violet for 15 min. To quantify the migrating cells, cells on the upper surface of the membrane were removed using a cotton-tipped swab and were then visualized by phase-contrast microscopy and photographed. The cells in nine random microscopy fields (×100 magnification) were counted per well, and the mean was calculated.
Western blot analysis
Cells were harvested, and protein extracts were obtained by lysing the cells with lysis buffer [1% NP-40, supplemented with a complete protease inhibitor tablet (Sigma, USA)] on ice. Equal amounts (50 mg) of protein were electrophoresed on 10% SDS-PAGE gels and then transferred to PVDF membranes. After blocking with 5% skim milk for 120 min, the membranes were probed with primary antibodies overnight at 4°C. Primary antibodies specific for the following were used: β-actin (Santa Cruz, USA), CDK4 (Cell Signaling Technology, USA), CCNE1 (Proteintech, China), CDC25A (Cell Signaling Technology, USA), DDX21 (Abcam, UK), VEGFA (Santa Cruz, USA), c-MYC (Cell Signaling Technology, USA), CDC25C (Santa Cruz, USA) and LDHA (Cell Signaling Technology, USA). Then, the membranes were incubated with a horseradish peroxidase-conjugated secondary antibody [goat-anti-mouse IgG (Sigma, USA) (1:2000) and goat-anti-rabbit IgG (Sigma, USA) (1:3000)] for 1 h. After incubation with a chemiluminescence substrate, photographs were acquired with an Image Reader LAS-4000 (Fuji, Japan) and analysed by means of the Multi Gauge V3.2 software. β-actin was used as internal standard.
Microarray analysis
Total RNA including miRNAs was extracted from all samples using TRIzol reagent (Invitrogen). RNA samples were purified by mirVana™ miRNA Isolation Kit (Ambion). miRNAs were labelled using the FlashTag™ Biotin RNA Labeling Kit and then hybridized onto Affymetrix GeneChip miRNA 4.0 Arrays. Statistical analysis was performed with the statistical computing software R (version 3.4.3). Additional software packages, including oligo (version 1.44.0), DOSE (version 3.6.1), clusterProfiler (version 3.8.1), ggplot2 (version 3.0.0) and pheatmap (version 1.0.10), were taken from the Bioconductor project. Key codes and parameters are showed in Table S4. The raw array data are available on the GEO website (GSE112009).
Screening for functional DE-miRNAs
Data analysis of the probe level data used a background-adjusted and normalized robust multi-array average (RMA) [20]. The FPKM gene expression levels were used in the analysis. Student's t-tests were conducted between low- and high-grade BSG samples, and miRNAs with p-values <0.05 and fold change (FC) >2 were selected as DE-miRNAs. To filter out the weakly functional miRNAs and obtain meaningful functional DE-miRNAs, we divided the samples into two groups according to the expression of each DE-miRNA. The median DE-miRNA expression level was set as the cut-off point, and survival rates were compared via Kaplan-Meier curves and log-rank tests. Statistical significance was defined as a p-value <0.05. Analyses were conducted using SPSS statistical software (version 23.0, IBM, USA). The mean values of each group were used in the cluster analysis in R.
Prediction of genes targeted by functional DE-miRNAs
The miRWalk2.0 database generated possible miRNA-target interactions by gathering information from 12 types of existing prediction software (e.g., Targetscan, miRanda and RNAhybrid) [21]. In the present study, miRWalk2.0 was used to predict the target genes of the functional DE-miRNAs. Only the target genes commonly predicted by at least 9 types of prediction software in miRWalk2.0 were selected and defined as potential target genes.
GO term and KEGG pathway analyses
The functional enrichment of the target genes of the functional DE-miRNAs was assessed based on the GO [22] term and KEGG [23] pathway annotations. GO term and KEGG signalling pathway analyses were performed in R, which carried out the standard hypergenometric test. p-values <0.001 and q-values <0.01 were considered statistically significant for the GO term enrichment analysis, while p-values <0.001 and q-values <0.01 were considered statistically significant for the KEGG pathway analysis.
PPI network construction
To evaluate the interactive relationships among the target genes, we mapped the target genes to the STRING database (http://string-db.org) [24], and only the interactions with a combined score >0.4 were considered significant. The degree of connectivity in the network was analysed using Cytoscape software (version 3.6.0) to obtain the significant nodes or hub proteins in the PPI network [25].
Identification of grade-associated miRNAs validated with BSG samples and quantitative real-time PCR
BSG tissue-derived RNA was used to validate the grade-associated miRNAs obtained by bioinformatics analysis. Total RNA was extracted from the tissues and cells using TRIzol reagent. cDNAs were synthesized with Superscript II reverse transcriptase (Invitrogen), according to the manufacturer's instructions. Quantitative real-time PCR (q-PCR) was conducted to detect the miRNA using the SYBR Premix Ex TaqTM II (Tli RNase H Plus) Kit (TaKaRa, Japan) and a QuantStudio™ Dx Real-Time PCR Instrument (Thermo Fisher Scientific, USA). The small nuclear RNA U6 was used as an internal normalization reference for miRNAs. Primers for functional DE-miRNAs and U6 were synthesized by Invitrogen (Shanghai, China). Specific primers are shown in Table S1. BSG samples were divided into two groups according to WHO grades (grades I and II vs. grades III and IV). Means were compared between the two groups by the Mann-Whitney U test or Student's t-test as appropriate. Statistical significance was defined as p-value <0.05. Analyses were conducted using SPSS software.
Results
Clinical features
Twenty-five patients with BSGs who underwent microsurgical treatment were retrospectively analysed (Table 1). The mean age at diagnosis was 16.75±15 years (range 5-54). No difference in gender was found (14 males vs. 11 females). According to the results of the pathological diagnoses, 10 had low-grade BSGs (WHO grades I and II) and 15 had high-grade BSGs (WHO grades III and IV). After discharge from our hospital, 15 patients received adjuvant therapies, and the detailed treatment plans are also shown in Table 1.
Survival analysis showed that the median OS was 13.2 months. More specifically, the median survival was 20.3 months in patients with low-grade BSGs and 10.1 months in patients with high-grade BSGs. At the time of this analysis, 17 of the 25 cases (68%) had died. Among those who died, 15 had high-grade BSGs and 2 had low-grade BSGs.
Twenty-eight functional DE-miRNAs and 2546 target genes were identified
The total DE-miRNAs were selected based on the screening process (Figure 1A). According to the results of the Kaplan-Meier survival curves, 28 functional DE-miRNAs, which included 13 upregulated and 15 downregulated miRNAs in high-grade BSGs compared with the corresponding levels in low-grade BSGs, were selected (Figure 1B, 2 and S1, Table 2 and 3). Based on the FC, hsa-miR-1290, hsa-miR-130b-3p and hsa-miR-18a-3p were the top three most upregulated miRNAs and hsa-miR-31-5p, hsa-miR-34a-3p and hsa-miR-34a-5p were the top three most downregulated miRNAs. miRWalk2.0 was used to predict the target genes of the functional DE-miRNAs and generated 2546 potential target genes, including 1179 genes that were potential targets of the upregulated miRNAs and 1367 genes that were potential targets of the downregulated miRNAs.
GO term and KEGG pathway enrichment analyses
GO term and KEGG pathway enrichment analyses were performed on the potential target genes. The enriched GO terms for the target genes are presented in Table 4 and 5. For the target genes of the upregulated functional miRNAs, the top 3 enriched GO terms were axonogenesis, axon development and tube morphogenesis in the biological process (BP) category; endosomal part, transcription factor complex and axon in the cellular component (CC) category; and transcriptional activator activity, RNA polymerase II transcription regulatory region sequence-specific binding; transcription factor activity, RNA polymerase II core promoter proximal region sequence-specific binding and transcriptional activator activity, RNA polymerase II core promoter proximal region sequence-specific binding in the molecular function (MF) category. Similarly, for the target genes of the downregulated functional miRNAs, the top 3 enriched GO terms were gland development, axonogenesis and axon development in the BP category; dendrite, axon and neuronal cell body in the CC category; and transcription factor activity, RNA polymerase II core promoter proximal region sequence-specific binding, transcriptional activator activity, RNA polymerase II transcription regulatory region sequence-specific binding and core promoter proximal region DNA binding in the MF category. The enriched KEGG pathways (Figure 3A) for the target genes of the upregulated functional miRNAs included axon guidance, endocytosis, autophagy-animal, signalling pathways regulating the pluripotency of stem cells, the FoxO signalling pathway, and transcriptional misregulation in cancer and glioma. For the downregulated functional miRNAs, the enriched KEGG pathways (Figure 3B) included proteoglycans in cancer, the AMPK signalling pathway, the HIF-1 signalling pathway, the PI3K-Akt signalling pathway, axon guidance, the Hippo signalling pathway, the Wnt signalling pathway, the MAPK signalling pathway and the mTOR signalling pathway.
Table 1
Clinical characteristics of cases.
| Case No. | Age(y)/Sex | Alive/Dead | KPS | Adjuvant Therapy | Pathology Diagnosis | OS(m) | WHO Grade |
|---|---|---|---|---|---|---|---|
| 1 | 6/F | Alive | 90 | n.d. | PA | 27.8 | I |
| 2 | 7/F | Alive | 100 | Radiotherapy | PA | 48.0 | I |
| 3 | 8/F | Alive | 90 | n.d. | PA | 19.6 | I |
| 4 | 8/F | Alive | 70 | Chemotherapy (VCR + CBP) | PA | 36.0 | I |
| 5 | 13/M | Alive | 90 | n.d. | PA | 50.5 | I |
| 6 | 31/M | Alive | 80 | Radiotherapy | A | 17.0 | II |
| 7 | 12/M | Alive | 50 | CCRT+TMZ | A | 24.7 | II |
| 8 | 18/M | Dead | 0 | n.d. | A | 7.3 | II |
| 9 | 6/F | Dead | 0 | CCRT+TMZ+CPT-11 | OA | 25.2 | II |
| 10 | 34/F | Alive | 80 | Radiotherapy | A | 18.4 | II |
| 11 | 23/M | Dead | 0 | CCRT+TMZ | AA | 18.9 | III |
| 12 | 54/M | Dead | 0 | n.d. | AA | 10.0 | III |
| 13 | 7/F | Dead | 0 | CCRT+TMZ | AA | 10.0 | III |
| 14 | 8/M | Dead | 0 | Immunotherapy (PD-1) | AA | 5.5 | III |
| 15 | 11/M | Dead | 0 | n.d. | AA | 18.8 | III |
| 16 | 18/M | Dead | 0 | n.d. | GBM | 3.6 | IV |
| 17 | 5/F | Dead | 0 | CCRT+TMZ | GBM | 13.2 | IV |
| 18 | 5/M | Dead | 0 | n.d. | GBM | 1.7 | IV |
| 19 | 7/M | Dead | 0 | CCRT | GBM | 10.2 | IV |
| 20 | 7/M | Dead | 0 | CCRT+TMZ | GBM | 8.5 | IV |
| 21 | 30/F | Dead | 0 | CCRT+TMZ | GBM | 10.1 | IV |
| 22 | 44/M | Dead | 0 | CCRT+TMZ+ gamma knife | GBM | 21 | IV |
| 23 | 7/F | Dead | 0 | n.d. | GBM | 4.0 | IV |
| 24 | 5/M | Dead | 0 | CCRT+TMZ | GBM | 9.0 | IV |
| 25 | 7/F | Dead | 0 | n.d. | GBM | 2.5 | IV |
n.d. not do; OS overall survival; KPS karnofsky performance scale; PA pilocytic astrocytoma; A astrocytoma; OA oligodendroid astrocytoma; AA anaplastic astrocytoma; GBM glioblastoma multiforme; VCR vincristine; CBP carboplatin; CCRT concurrent chemoradiotherapy; TMZ temozolomide; CPT-11 Irinotecan; PD-1 programmed cell death protein 1.
Figure 1
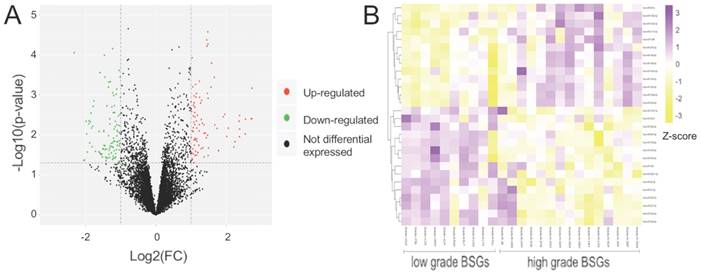
Summary of microarray results of miRNA expression in BSGs. (A) Volcano plots of the distributions of miRNAs. (B) Cluster analysis of functional DE-miRNAs in 25 cases of BSG, data are presented as a heat map (p <0.05).
Figure 2
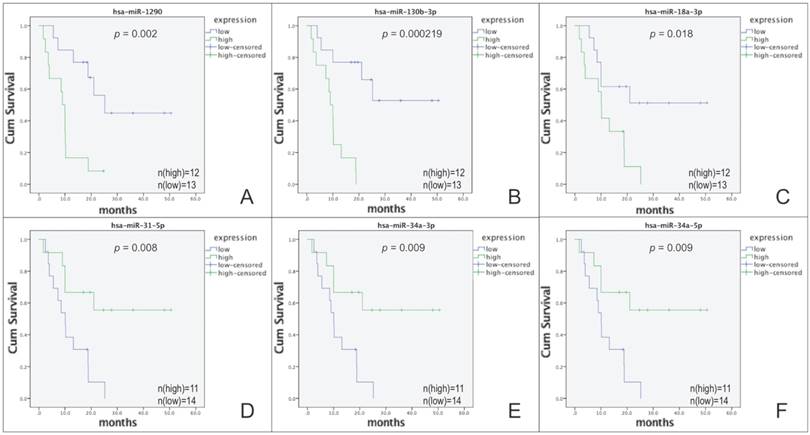
Survival rate calculated by the Kaplan-Meier survival curve in patients separated according to the expression level of each DE-miRNA. The top 3 of upregulated and downregulated DE-miRNAs are presented, the rest 22 DE-miRNAs are shown in figure S1. (A) Kaplan-Meier analysis for hsa-miR-1290. (B) Kaplan-Meier analysis for hsa-miR-130b-3p. (C) Kaplan-Meier analysis for hsa-miR-18a-3p. (D) Kaplan-Meier analysis for hsa-miR-31-5p. (E) Kaplan-Meier analysis for hsa-miR-34a-3p. (F) Kaplan-Meier analysis for hsa-miR-34a-5p.
Figure 3
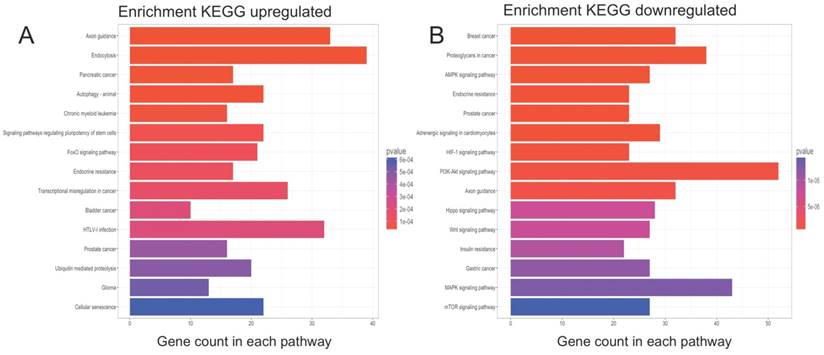
KEGG pathway analysis of functional DE-miRNA target genes. The top 15 enriched pathways are presented (p-values <0.001 and q-values <0.01). (A) For target genes of upregulated functional DE-miRNAs; (B) For target genes of downregulated functional DE-miRNAs.
Construction and analysis of the PPI network
Data from the STRING database showed that many of the target genes interacted with each other. To better visualize these interactions, the top 15 hub nodes with higher node degrees were selected (Table 6). For the upregulated functional miRNAs, the hub genes were PHLPP2, APP, BCL2, RB1, CCND1, SMAD4, RBBP7, ESR1, KAT2B, NEDD4L, CUL3, ATG7, CLTC, ITCH and UBE2B. Among these genes, PHLPP2 showed the highest node degree (degree=80). For the downregulated functional miRNAs, the hub genes were VEGFA, NOTCH1, BCL2, FOS, HDAC3, PPP3CA, SIRT1, SP1, CFTR, KDR, MYB, ACTR1A, PRKCA, VAMP2 and DICER1. Among these genes, VEGFA showed the highest node degree (degree=58).
As shown in Figure 4, a regulatory network of the top hub genes was constructed. PPI analysis showed that the network of hub genes for the upregulated functional miRNAs consisted of 38 edges, and the network of hub genes for the downregulated functional miRNAs consisted of 45 edges.
Validated grade-associated functional DE-miRNAs and hub genes in BSG samples
We extracted RNA from 29 BSG tissues, including 17 high-grade BSGs and 12 low-grade BSGs, to validate the grade-associated miRNAs and hub genes obtained by the bioinformatics analysis. Total RNA was extracted from the tissues, and q-PCR was conducted to detect miRNA. Six of the 28 functional DE-miRNAs (hsa-miR-130b-3p, hsa-miR-19a-3p, hsa-miR-20a-5p, hsa-miR-106a-5p, hsa-miR-34a-5p and hsa-miR-195-5p) were proven to be grade-associated functional DE-miRNAs (Figure 5A-F and Table S2). Next, using q-PCR assays, we determined the expression of the top 8 hub genes according to degrees in all the BSG tissue RNA samples. We found that 3 of 8 hub genes, APP, PHLPP2 and VEGFA, were proven to be differentially expressed between low- and high-grade BSGs (Figure 5G-I). Finally, we detected in BSG tissues the expression of mir-7, mir-21 and mir-451, which have been shown to be differentially expressed between low- and high-grade supratentorial gliomas. We found that none of these 3 miRNAs are differentially expressed between low- and high-BSGs.
Table 2
Functional DE-miRNAs upregulated in high grade BSGs compared with low grade.
| miRNA ID | Fold change | p-value (for differential expression) | p-value (for Kaplan-Meier analysis) |
|---|---|---|---|
| hsa-miR-1290 | 6.637434524 | 0.000677545 | 0.002 |
| hsa-miR-130b-3p | 2.739766065 | 0.000060100 | 0.000219 |
| hsa-miR-18a-3p | 2.650116882 | 0.008929741 | 0.018 |
| hsa-miR-20b-3p | 2.584468384 | 0.005573321 | 0.002 |
| hsa-miR-18b-5p | 2.448427899 | 0.004124041 | 0.000106 |
| hsa-miR-18a-5p | 2.414778322 | 0.001592190 | 0.002 |
| hsa-miR-19a-3p | 2.327721751 | 0.018134388 | 0.000063 |
| hsa-miR-130b-5p | 2.244661947 | 0.014409822 | 0.003 |
| hsa-miR-2115-3p | 2.185830431 | 0.000548725 | 0.005 |
| hsa-miR-181a-3p | 2.159427281 | 0.002031566 | 0.006 |
| hsa-miR-20a-5p | 2.091467290 | 0.003359928 | 0.018 |
| hsa-miR-551a | 2.040395845 | 0.000117401 | 0.01 |
| hsa-miR-106a-5p | 2.002482024 | 0.002335051 | 0.018 |
Table 3
Functional DE-miRNAs downregulated in high grade BSGs compared with low grade.
| miRNA ID | Fold change | p-value (for differential expression) | p-value (for Kaplan-Meier analysis) |
|---|---|---|---|
| hsa-miR-31-5p | 0.242193258 | 0.043437372 | 0.008 |
| hsa-miR-34a-3p | 0.255557697 | 0.009441854 | 0.009 |
| hsa-miR-34a-5p | 0.275017363 | 0.004705412 | 0.009 |
| hsa-miR-222-3p | 0.325927536 | 0.026497715 | 0.003 |
| hsa-miR-22-5p | 0.332872896 | 0.000276640 | 0.01 |
| hsa-miR-221-3p | 0.368540489 | 0.023151489 | 0.003 |
| hsa-miR-330-5p | 0.403607288 | 0.003966542 | 0.001 |
| hsa-miR-330-3p | 0.415589277 | 0.028103053 | 0.003 |
| hsa-miR-346 | 0.432038104 | 0.002762589 | 0.005 |
| hsa-miR-3612 | 0.448188440 | 0.006232410 | 0.002 |
| hsa-miR-497-5p | 0.459734495 | 0.023555085 | 0.002 |
| hsa-miR-342-5p | 0.484462134 | 0.000242687 | 0.001 |
| hsa-miR-195-5p | 0.487513802 | 0.008719098 | 0.01 |
| hsa-miR-1247-3p | 0.489449441 | 0.016659026 | 0.032 |
| hsa-miR-29b-1-5p | 0.494125182 | 0.000357486 | 0.018 |
Table 4
Enriched functions for the target genes of the upregulated miRNAs.
| ID | Description | p-value | q-value | Gene count | Fold Enrichment |
|---|---|---|---|---|---|
| Biological process (BP) | |||||
| GO:0007409 | axonogenesis | 2.71E-11 | 1.14E-07 | 64 | 2.44 |
| GO:0061564 | axon development | 6.24E-11 | 1.32E-07 | 67 | 2.34 |
| GO:0035239 | tube morphogenesis | 3.53E-09 | 4.98E-06 | 51 | 2.43 |
| GO:0048732 | gland development | 1.00E-08 | 1.06E-05 | 57 | 2.23 |
| GO:0051962 | positive regulation of nervous system development | 2.24E-08 | 1.89E-05 | 61 | 2.12 |
| Cellular component (CC) | |||||
| GO:0044440 | endosomal part | 9.40E-07 | 0.00019035 | 57 | 1.96 |
| GO:0005667 | transcription factor complex | 1.09E-06 | 0.00019035 | 42 | 2.21 |
| GO:0030424 | axon | 1.28E-06 | 0.00019035 | 50 | 2.04 |
| GO:0017053 | transcriptional repressor complex | 1.69E-06 | 0.00019035 | 18 | 3.6 |
| GO:0010008 | endosome membrane | 6.27E-06 | 0.00056354 | 51 | 1.92 |
| Molecular function (MF) | |||||
| GO:0001228 | transcriptional activator activity, RNA polymerase II transcription regulatory region sequence-specific binding | 2.70E-14 | 2.15E-11 | 69 | 2.7 |
| GO:0000982 | transcription factor activity, RNA polymerase II core promoter proximal region sequence-specific binding | 7.23E-13 | 2.87E-10 | 65 | 2.62 |
| GO:0001077 | transcriptional activator activity, RNA polymerase II core promoter proximal region sequence-specific binding | 4.50E-12 | 1.19E-09 | 50 | 2.94 |
| GO:0001159 | core promoter proximal region DNA binding | 5.13E-11 | 1.02E-08 | 59 | 2.5 |
| GO:0001047 | core promoter binding | 1.80E-10 | 2.86E-08 | 35 | 3.36 |
Table 5
Enriched functions for the target genes of the downregulated miRNAs.
| ID | Description | p-value | q-value | Gene count | Fold Enrichment | |
|---|---|---|---|---|---|---|
| Biological process (BP) | ||||||
| GO:0048732 | gland development | 3.46E-13 | 1.42E-09 | 74 | 2.46 | |
| GO:0007409 | axonogenesis | 2.74E-11 | 5.34E-08 | 71 | 2.3 | |
| GO:0061564 | axon development | 3.90E-11 | 5.34E-08 | 75 | 2.23 | |
| GO:0030900 | forebrain development | 1.30E-10 | 1.22E-07 | 62 | 2.38 | |
| GO:0097485 | neuron projection guidance | 1.48E-10 | 1.22E-07 | 46 | 2.8 | |
| Cellular component (CC) | ||||||
| GO:0030425 | dendrite | 4.65E-11 | 2.22E-08 | 76 | 2.2 | |
| GO:0030424 | axon | 9.94E-09 | 2.37E-06 | 61 | 2.15 | |
| GO:0043025 | neuronal cell body | 6.40E-07 | 0.0001017 | 59 | 1.95 | |
| GO:0031252 | cell leading edge | 8.60E-07 | 0.00010247 | 52 | 2.03 | |
| GO:0005911 | cell-cell junction | 1.13E-06 | 0.00010805 | 57 | 1.94 | |
| Molecular function (MF) | ||||||
| GO:0000982 | transcription factor activity, RNA polymerase II core promoter proximal region sequence-specific binding | 2.85E-13 | 2.29E-10 | 72 | 2.51 | |
| GO:0001228 | transcriptional activator activity, RNA polymerase II transcription regulatory region sequence-specific binding | 1.83E-10 | 7.38E-08 | 67 | 2.27 | |
| GO:0001159 | core promoter proximal region DNA binding | 5.19E-09 | 1.31E-06 | 60 | 2.2 | |
| GO:0001077 | transcriptional activator activity, RNA polymerase II core promoter proximal region sequence-specific binding | 6.83E-09 | 1.31E-06 | 48 | 2.44 | |
| GO:0001047 | core promoter binding | 8.36E-09 | 1.31E-06 | 35 | 2.9 | |
Figure 4
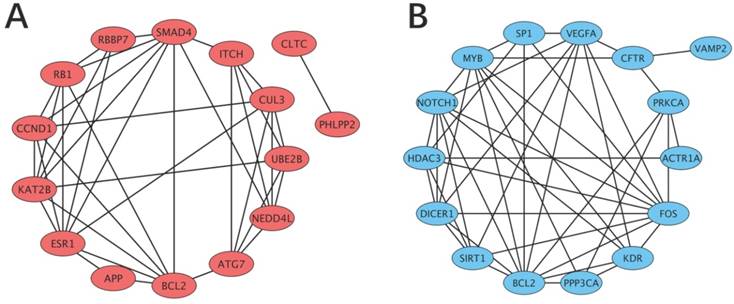
Gene regulatory network based on the top 15 hub target genes of the functional DE-miRNAs. Orange represents the target genes of the upregulated miRNAs and blue represents the target genes of the downregulated miRNAs. (A) Upregulated miRNAs. (B) Downregulated miRNAs.
Table 6
Top 15 hub genes identified in the PPI network.
| Upregulated miRNAs | Downregulated miRNAs | |||
|---|---|---|---|---|
| Gene symbol | Degree | Gene symbol | Degree | |
| PHLPP2 | 80 | VEGFA | 58 | |
| APP | 45 | NOTCH1 | 48 | |
| BCL2 | 44 | BCL2 | 46 | |
| RB1 | 44 | FOS | 46 | |
| CCND1 | 41 | HDAC3 | 37 | |
| SMAD4 | 38 | PPP3CA | 36 | |
| RBBP7 | 37 | SIRT1 | 36 | |
| ESR1 | 36 | SP1 | 34 | |
| KAT2B | 34 | CFTR | 33 | |
| NEDD4L | 34 | KDR | 32 | |
| CUL3 | 32 | MYB | 31 | |
| ATG7 | 32 | ACTR1A | 29 | |
| CLTC | 32 | PRKCA | 28 | |
| ITCH | 31 | VAMP2 | 27 | |
| UBE2B | 31 | DICER1 | 26 | |
PPI protein-protein interaction
GO term, KEGG pathway enrichment and PPI network analyses of validated grade-associated functional DE-miRNAs
Because six of the 28 DE-miRNAs showed significantly different expression levels between the high- and low-grade BSGs, the analysis of the target genes of these six DE-miRNAs was expected to be more meaningful. miRWalk2.0 was used to predict the target genes of these 6 validated DE-miRNAs and generated 1346 potential target genes. The enriched GO terms for the target genes are presented in Table S3. For the target genes of these 6 validated DE-miRNAs, the most enriched GO terms were positive regulation of transcription from RNA polymerase II promoters in the BP category, nucleoplasm in the CC category, and protein binding in the MF category. The most enriched KEGG pathway for the target genes of these 6 DE-miRNAs was pathways in cancer. The PPI analysis showed that the top 20 hub genes were UBC, PHLPP2, MAPK3, VEGFA, NOTCH1, PIKFYVE, BCL2, CCND1, ESR1, SIRT1, RB1, KRAS, SMAD4, NEDD4L, NFKB1, KDR, SMURF1, BTRC, IGF1R and APP according to the degree of expression.
hsa-miR-34a-5p inhibits BSG cell invasion in vitro
To study the functional roles of miRNAs in BSGs, we chose hsa-miR-34a-5p, one of the most downregulated miRNAs in tissues, to construct a cell model of over expression. Three BSG cell lines, TT10728, TT11201 and TT10630 (Figure 6A), with relatively low levels of hsa-miR-34a-5p expression were used to construct cell models of over expression for studying the function of hsa-miR-34a-5p. Real-time PCR assays confirmed that the hsa-miR-34a-5p level in the BSG cells was changed (Figure 6B). We then tested the influence of hsa-miR-34a-5p on cell behaviour. The transwell assay showed that hsa-miR-34a-5p significantly inhibited cell invasion compared with the control (Figure 6C-E). This result indicated that hsa-miR-34a-5p may affect BSG cell invasion in vitro.
Validated dysregulated target genes of hsa-miR-34a-5p in BSGs
To verify the effect of abnormal miRNA expression on the miRNA-target genes, two BSG cell lines, TT11201 and TT10630, were chosen to construct cell models of miR-34a-5p over expression. Total RNAs and proteins were extracted, and the transcription and protein levels of dysregulated target genes were determined via q-PCR and immunoblot assays, respectively. We found that the transcription levels of some target genes, including CDK4, CCNE1, CDC25A, DDX21, VEGFA, c-MYC, CDC25C and LDHA, were downregulated in two cell lines (Figure 7A). Moreover, in the TT10630 cells, the protein levels of CDK4, CCNE1, CDC25A, DDX21, VEGFA, c-MYC and CDC25C were downregulated, while the protein levels of CDK4, CCNE1, CDC25A, DDX21, VEGFA and LDHA were downregulated in the TT11201 cells (Figure 7B). These results indicated that miR-34a-5p could downregulate some of its targets in BSG cells.
Figure 5
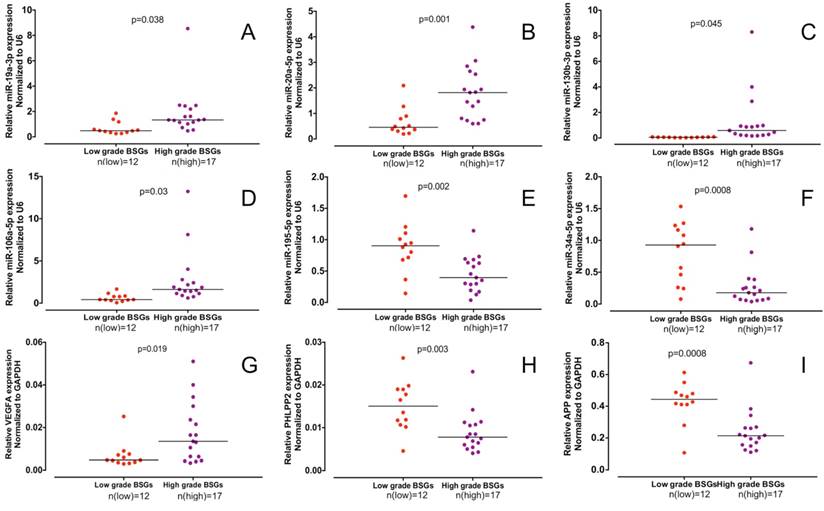
Expression of miR-130b-3p, miR-19a-3p, miR-20a-5p, miR-106a-5p, miR-34a-5p, hsa-miR-195-5p, VEGFA, PHLPP2 and APP in samples from patients with BSGs. (A) Expression level of miR-130b-3p. (B) Expression level of miR-19a-3p. (C) Expression level of miR-20a-5p. (D) Expression level of miR-106a-5p. (E) Expression level of miR-34a-5p. (F) Expression level of miR-195-5p. (G) Expression level of VEGFA. (H) Expression level of PHLPP2. (I) Expression level of APP.
Figure 6
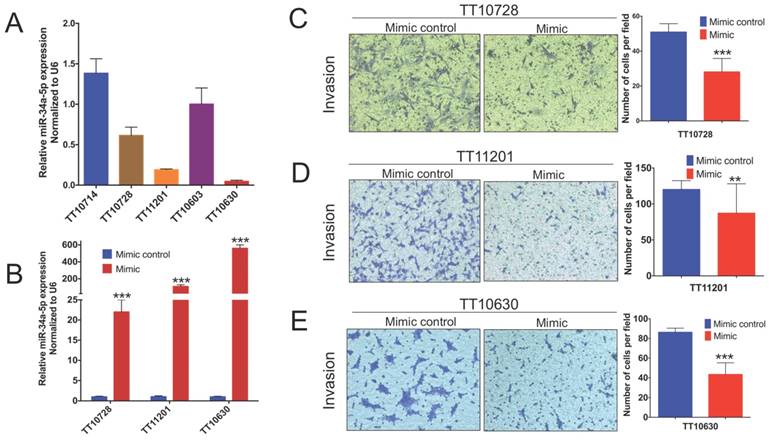
hsa-miR-34a-5p attenuate BSGs cell invasion in vitro. (A) hsa-miR-34a-5p expression in five BSGs cell lines. (B) qPCR analysis of miR-34a-5p overexpression in TT10728, TT11201 and TT10630 cells transfected with a miR-34a-5p mimic. (C) Invasion of TT10728 cells transfected with miR-34a-5p mimic. (D) Invasion of TT11201 cells transfected with miR-34a-5p mimic. (E) Invasion of TT10630 cells transfected with miR-34a-5p mimic. The data are from three independent experiments. Error bars represent SEM. Fields are ×100 magnification. **p < 0.01, ***p < 0.001.
Figure 7
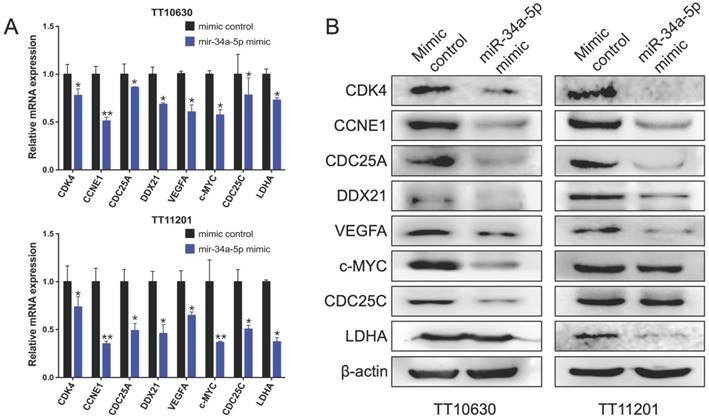
Validated dysregulated target genes of miR-34a-5p in BSGs. (A) Relative mRNA expression of indicated miR-34a-5p targets. (B) Western blot of target genes expression of miR-34a-5p. *p < 0.05, **p < 0.01.
Discussion
The TNM staging system used for somatic tumours is not used for tumours in the central nervous system, which are instead classified according to guidelines developed by the WHO; these guidelines are important for determining the appropriate treatment and evaluating the prognosis. According to this classification, gliomas are classified into 4 grades, from grade I (the lowest malignancy and the best prognosis) to grade IV (the highest malignancy and the worst prognosis) [26]. Among the four grades, WHO grades I and II are classified as low-grade gliomas, and WHO grades III and IV are classified as high-grade gliomas. In the present study, bioinformatics analyses were performed to investigate the miRNA-mediated mechanism differentiating between low- and high-grade BSGs and to identify the molecular targets of those miRNAs. Initially, we identified the DE-miRNAs between low- and high-grade BSG tissues based on the Affymetrix GeneChip miRNA 4.0 Arrays. Then, according to the expression of each miRNA, we used Kaplan-Meier survival analysis to select 28 functional DE-miRNAs that affect the prognosis of BSGs, including 13 upregulated miRNAs and 15 downregulated miRNAs. Next, using the online target gene tool of miRWalk2.0, we identified the potential target genes of these functional DE-miRNAs. The GO term and KEGG pathway enrichment analyses showed that these target genes may participate in many important cancer-related biological processes, molecular functions and signalling pathways. The PPI network analysis predicted the significant hub genes and the specific connections among them.
Among the functional DE-miRNAs, we found that hsa-miR-1290 (upregulated) and hsa-miR-31-5p (downregulated) have the greatest FC in expression between low- and high-grade BSG tissues. hsa-miR-1290 has been previously reported to be overexpressed in glioma cells and tissues and promotes the proliferation, migration and invasion of glioma cells by targeting LHX6 [27]. hsa-miR-31-5p has been found to be regulated by TNFα and attenuates growth and proliferation in U-251 cells [28]. These two miRNAs (hsa-miR-1290 and hsa-miR-31-5p) have not been systemically studied in BSGs before. Their mechanisms as oncogenes or tumour suppressor genes in BSGs should be investigated.
MicroRNAs have been extensively studied in supratentorial gliomas. miR-7, miR-21 and miR-451 are among those that have been analysed. Previous studies have shown that miR-7 is downregulated in gliomas and inhibits angiogenesis by targeting O-linked-N-acetylglucosamine transferase, whereas miR-21 is upregulated in gliomas and promotes invasion by targeting specific inhibitors of MMPs, and miR-451 is upregulated in gliomas and promotes tumour cell proliferation and migration by directly targeting CAB3. According to our study, none of these miRNAs are differentially expressed between low- and high-grade BSGs. The reason may be that BSGs and supratentorial gliomas have different pathogeneses. This finding has not been previously reported, and further studies are needed.
The GO term and KEGG pathway enrichment analyses were performed on the target genes of the identified functional DE-miRNAs. For the target genes of upregulated functional DE-miRNAs, the most enriched GO terms were associated with axonogenesis at the BP level, the endosomal part at the CC level and transcriptional activator activity, RNA polymerase II transcription regulatory region sequence-specific binding at the MF level, respectively. Furthermore, the most enriched GO terms of the target genes of downregulated functional DE-miRNAs were related to gland development at the BP level, dendrites at the CC level and transcription factor activity, RNA polymerase II core promoter proximal region sequence-specific binding at the MF level, respectively. In addition, a KEGG pathway analysis was performed, and several pathways associated with BSGs were found among the highly enriched KEGG pathways. Axon guidance, endocytosis, signalling pathways regulating the pluripotency of stem cells, the FoxO signalling pathway, and transcriptional misregulation in cancer were identified as being enriched in the target genes of the upregulated functional miRNAs, and the AMPK signalling pathway, the HIF-1 signalling pathway, the PI3K-Akt signalling pathway, axon guidance, the Hippo signalling pathway, the Wnt signalling pathway and the MAPK signalling pathway were identified as being enriched in the target genes of the downregulated functional miRNAs. FOXOs have been shown to modulate cell death, proliferation and differentiation in gliomas [29, 30]. Moreover, FOXOs suppress MYC expression, induce apoptosis, decrease glycolysis and inhibit glucose uptake in gliomas [31]. AMPK is a conserved cellular energy sensor that is activated by metabolic stress to promote energy conservation and glucose uptake [32], and researchers found that activation of AMPK inhibits the growth of EGFRvIII-expressing glioblastomas [33]. HIF-1, acting as the key hypoxia regulatory factor, has been shown to be important in promoting both angiogenesis and invasion in gliomas [34]. Knockdown of HIF-1α in glioma cells reduces migration and impairs their ability to form tumour spheres [35]. Recently, evidence suggested that cytarabine attenuates the leptomeningeal metastasis of high-grade glioma by targeting the PI3K/Akt/ mTOR pathway [36]. The Hippo signalling pathway is considered a key player in the regulation of tumourigenesis, and inactivating the Hippo signalling pathway enhances stem cell-like phenotypes in glioblastoma [37,38]. Extensive studies have shown that aberrant Wnt/beta-catenin signalling plays a key role in the development of glioblastoma, including in cell proliferation, cell apoptosis and cell invasion [39]. Alterations in the MAPK pathway have been found in 88% of adult glioblastomas [40]. It is a conserved signalling cascade that utilizes a series of protein kinases to transduce signals from the cell membrane to the nucleus and that plays a crucial role in mediating a range of biological functions, including cell growth, survival, and differentiation [41]. GO term and KEGG pathway enrichment analyses of the target genes further supports the potential involvement of DE-miRNAs in BSGs.
The PPI network of the target genes was constructed, and it was found that PHLPP2 and VEGFA were the hub genes that had the highest degrees of connectivity (80 and 58, respectively) among the targets of the upregulated and downregulated functional DE-miRNAs. PHLPPs have been described as survival/proliferation suppressors in various cancers [42] and were reported to be direct phosphatases for Akt [43]. Researchers have found that PHLPP2 is progressively lost in gliomas and acts as a true tumour suppressor, inactivating the IKKβ kinase to suppress the NF-κB pathway [44]. Furthermore, a large body of research indicates that VEGFA is the most potent mediator of tumour-induced angiogenesis in gliomas [45,46]. Elevated VEGFA expression is correlated with both increased tumour micro-vessel density and an increased risk for glioma recurrence as well as a poor prognosis [47,48]. These data support that PHLPP2 and VEGFA may be candidate targets associated with glioma malignancy, whereas their role in BSGs has remained largely unexplored.
We found that hsa-miR-34a-5p inhibits BSG cell invasion in vitro. hsa-miR-34a is commonly deleted in human cancers and, as shown here, is frequently absent in BSGs [49]. miR-34a has usually been considered to be a tumour suppressor in human gliomas through different mechanisms. Previous studies have found that miR-34a functions as a tumour suppressor by modulating EGFR and attenuates cell invasion and growth in GBM [50,51]. Gao et al. found that the expression level of human miR-34a correlates with glioma grade and prognosis [52]. Moreover, miR-34a attenuated glioma cell progression and chemoresistance via targeting PD-L1 [53]. Although there have been many reports about the tumour suppressor effect of miR-34a in glioma, the role of this miRNA in BSGs was largely unclear, and in-depth studies regarding the mechanism of action of miR-34a are still needed.
Conclusions
This study provides a comprehensive bioinformatics analysis of functional DE-miRNAs associated with WHO grades of BSGs. In total, 13 upregulated miRNAs and 15 downregulated miRNAs were identified, and 2546 target genes were selected. In addition, the target genes of the functional DE-miRNAs were determined to be associated with several significant signalling pathways in BSGs, such as the FoxO signalling pathway, the AMPK signalling pathway, the HIF-1 signalling pathway and the MAPK signalling pathway. Functional DE-miRNAs, such as hsa-miR-130b-3p and hsa-miR-34a-5p, and hub target genes, including PHLPP2 and VEGFA, are potential targets for the treatment of BSGs. We also found hsa-miR-34a-5p inhibits BSGs cell invasion in vitro. These findings significantly improve our understanding of the progression and malignancy of BSGs, and the functional DE-miRNAs together with their target genes are expected to be significant factors in the diagnosis of BSGs and important markers for the prognostic evaluation of BSGs.
Abbreviations
BSGs: brainstem gliomas; DE-miRNAs: differentially expressed miRNAs; PPI: protein-protein interaction network; qPCR: quantitative real-time PCR; AMPK: adenosine 5'-monophosphate-activated protein kinase; HIF1: hypoxia inducible factor-1; PI3K: phosphoinositide 3 kinase; MAPK: mitogen-activated protein kinase; PHLPP2: PH domain leucine-rich repeat protein phosphatase 2; VEGFA: vascular endothelial growth factor A; WHO: world health organization; Gy: grey; MMPs: matrix metalloproteases; RECK: reversion-inducing-cysteine-rich protein with kazal motifs; MARCKS: myristoylated alanine-rich C-kinase substrate protein; TIMP3: tissue inhibitors of metalloproteases 3; CAB3: coenzyme A biosynthesis protein 3; GO: gene ontology; KEGG: kyoto encyclopedia of genes and genomes; KPS: karnofsky performance scale; OS: overall survival; AA: anaplastic astrocytoma; AOA: anaplastic oligodendroastrocytoma; GBM: glioblastoma; PLO: Poly-L-ornithine; DMEM: Dulbecco's modified eagle medium; bFGF: basic fibroblast growth factor; EGF: epidermal growth factor; EGFR: epidermal growth factor receptor; PDGFAB: platelet derived growth factor-AB GEO: gene expression omnibus; RMA: robust multi-array average; FC: fold change; BP: biological process; CC: cellular component; MF: molecular function; FOXO: forkhead box, class O; PD-L1: programmed death-ligand 1.
Supplementary Material
Supplementary figures and tables.
Acknowledgements
The study was supported by “National Natural Science Foundation of China” (Grant Number 81472661 and 81872048), the “National key research and development program of China” (Grant Number 2016YFA0500303), “Beijing Municipal Natural Science Foundation” (Grant Number 7161004) and “Beijing Municipal Administration of Hospitals Clinical Medicine Development of Special Funding Support” (Grant No.ZYLX201608).
Author Contributions
Xin Chen, Dezuo Dong, Yongmei Song and Liwei Zhang conceived and designed the experiments; Changcun Pan, Lu Kong, Xiong Xiao, Cheng Xu, Yu Sun and Yibo Geng collected the data and perform the experiments; Xin Chen, Zitong Zhao, Wei Zhou and Lijie Huang analysed the data; Xin Chen, Yongmei Song and Liwei Zhang wrote the paper.
Ethical approval
All procedures performed in studies involving human participants were in accordance with the ethical standards of the institutional and/or national research committee and with the 1964 Helsinki declaration and its later amendments or comparable ethical standards.
Informed consent
Informed consent was obtained from all individual participants included in the study.
Competing Interests
The authors have declared that no competing interest exists.
References
1. Ostrom QT, Gittleman H, Fulop J. et al. CBTRUS Statistical Report: Primary Brain and Central Nervous System Tumors Diagnosed in the United States in 2008-2012. Neuro Oncol. 2015;17(Suppl 4):iv1-iv62
2. Reithmeier T, Kuzeawu A, Hentschel B. et al. Retrospective analysis of 104 histologically proven adult brainstem gliomas: clinical symptoms, therapeutic approaches and prognostic factors. Bmc Cancer. 2014;14:115
3. Hamilton MG, Lauryssen C, Hagen N. Focal midbrain glioma: long term survival in a cohort of 16 patients and the implications for management. Can J Neurol Sci. 1996;23:204-7
4. Chen X, Pan C, Zhang P. et al. BRAF V600E mutation is a significant prognosticator of the tumour regrowth rate in brainstem gangliogliomas. J Clin Neurosci. 2017;46:50-57
5. Laigle-Donadey F, Doz F, Delattre JY. Brainstem gliomas in children and adults. Curr Opin Oncol. 2008;20:662-7
6. Kesari S, Kim RS, Markos V. et al. Prognostic factors in adult brainstem gliomas: a multicenter, retrospective analysis of 101 cases. J Neurooncol. 2008;88:175-83
7. Vanan MI, Eisenstat DD. DIPG in Children - What Can We Learn from the Past? Front Oncol. 2015;5:237
8. Theeler BJ, Ellezam B, Melguizo-Gavilanes I. et al. Adult brainstem gliomas: Correlation of clinical and molecular features. J Neurol Sci. 2015;353:92-7
9. Reyes-Botero G, Giry M, Mokhtari K. et al. Molecular analysis of diffuse intrinsic brainstem gliomas in adults. J Neurooncol. 2014;116:405-11
10. Porkholm M, Raunio A, Vainionpää R. et al. Molecular alterations in pediatric brainstem gliomas. Pediatr Blood Cancer. 2018:65
11. Goodwin CR, Xu R, Iyer R. et al. Local delivery methods of therapeutic agents in the treatment of diffuse intrinsic brainstem gliomas. Clin Neurol Neurosurg. 2016;142:120
12. Bartel DP. MicroRNAs: genomics, biogenesis, mechanism, and function. Cell. 2004;116:281-97
13. Beyer S, Fleming J, Meng W. et al. The Role of miRNAs in Angiogenesis, Invasion and Metabolism and Their Therapeutic Implications in Gliomas. Cancers. 2017:9
14. Babae N, Bourajjaj M, Liu Y. et al. Systemic miRNA-7 delivery inhibits tumor angiogenesis and growth in murine xenograft glioblastoma. Oncotarget. 2014;5:6687-700
15. Giese A, Westphal M. Glioma invasion in the central nervous system. Neurosurgery. 1996;39:235
16. Awad AJ, Burns TC, Zhang Y. et al. Targeting MET for glioma therapy. Neurosurgical Focus. 2014;37:E10
17. Godlewski J, Bronisz A, Nowicki MO. et al. microRNA-451: A conditional switch controlling glioma cell proliferation and migration. Cell Cycle. 2010;9:2814-20
18. Godlewski J, Nowicki MO, Bronisz A. et al. MicroRNA-451 Regulates LKB1/AMPK Signaling and Allows Adaptation to Metabolic Stress in Glioma Cells. Mol Cell. 2010;37:620
19. Cheng X, Liu X, Geng Y. et al. Patient-derived DIPG cells preserve stem-like characteristics and generate orthotopic tumors. Oncotarget. 2017;8:76644
20. Irizarry RA, Hobbs B, Collin F. et al. Exploration, normalization, and summaries of high density oligonucleotide array probe level data. Biostatistics. 2003;4:249-64
21. Dweep H, Gretz N. miRWalk2.0: a comprehensive atlas of microRNA-target interactions. Nat Methods. 2015;12:697
22. Ashburner M, Ball C. et al. Gene ontology: tool for the unification of biology. The Gene Ontology Consortium. Nat Genet. 2000;25:25-9
23. Kanehisa M. The KEGG database. Novartis Found Symp. 2002;247:91
24. Szklarczyk D, Franceschini A, Wyder S. et al. STRING v10: protein-protein interaction networks, integrated over the tree of life. Nucleic Acids Res. 2015;43:D447-52
25. He X, Zhang J. Why do hubs tend to be essential in protein networks? Plos Genet. 2006;2:e88
26. Louis DN, Ohgaki H, Wiestler OD. et al. The 2007 WHO classification of tumours of the central nervous system. Acta Neuropathol. 2007;114:97-109
27. Yan L, Sun K, Liu Y. et al. MiR-1290 promotes proliferation, migration and invasion of glioma cells by targeting LHX6. J Cell Physiol. 2018;233:6621-6629
28. Peng Z, Ying L. Effects of TNFα on cell viability, proliferation and apoptosis of glioma cells U251. J BUON. 2014;19:733-41
29. Sunayama J, Sato A, Matsuda KI. et al. FoxO3a Functions as a Key Integrator of Cellular Signals That Control Glioblastoma Stem-like Cell Differentiation and Tumorigenicity. Stem Cells. 2011;29:1327-37
30. Lau CJ, Koty Z, Nalbantoglu J. Differential response of glioma cells to FOXO1-directed therapy. Cancer Res. 2009;69:5433
31. Masui K, Tanaka K, Akhavan D. et al. mTOR Complex 2 Controls Glycolytic Metabolism in Glioblastoma through FoxO Acetylation and Upregulation of c-Myc. Cell Metab. 2013;18:726
32. Hardie DG. AMP-activated/SNF1 protein kinases: conserved guardians of cellular energy. Nat Rev Mol Cell Biol. 2007;8:774-85
33. Guo D, Hildebrandt IJ, Prins RM. et al. The AMPK agonist AICAR inhibits the growth of EGFRvIII-expressing glioblastomas by inhibiting lipogenesis. Proc Natl Acad Sci U S A. 2009;106:12932-7
34. Kaur B, Khwaja FW, Severson EA. et al. Hypoxia and the hypoxia-inducible-factor pathway in glioma growth and angiogenesis. Neuro Oncol. 2005;7:134
35. Méndez O, Zavadil J, Esencay M. et al. Knock down of HIF-1alpha in glioma cells reduces migration in vitro and invasion in vivo and impairs their ability to form tumor spheres. Mol Cancer. 2010;9:133
36. Zhao KH, Zhang C, Bai Y. et al. Antiglioma effects of cytarabine on leptomeningeal metastasis of high-grade glioma by targeting the PI3K/Akt/mTOR pathway. Drug Des Devel Ther. 2017;11:1905-15
37. Halder G, Johnson RL. Hippo signaling: growth control and beyond. Development. 2011;138:9-22
38. Zhu G, Wang Y, Mijiti M. et al. Upregulation of miR-130b enhances stem cell-like phenotype in glioblastoma by inactivating the Hippo signaling pathway. Biochem Biophys Res Commun. 2015;465:194-9
39. Zhang K, Zhang J, Han L. et al. Wnt/beta-catenin signaling in glioma. J Neuroimmune Pharmacol. 2012;7:740-9
40. Mclendon R, Friedman A, Bigner D. et al. Comprehensive genomic characterization defines human glioblastoma genes and core pathways. Nature. 2008;455:1061-8
41. Tatevossian RG, Lawson ARJ, Tim F. et al. MAPK pathway activation and the origins of pediatric low-grade astrocytomas. J Cell Physiol. 2010;222:509-14
42. Brognard J. et al. PHLPP and a second isoform, PHLPP2, differentially attenuate the amplitude of Akt signaling by regulating distinct Akt isoforms. Mol Cell. 2007;25:917-31
43. Gao T, Furnari F, Newton AC. PHLPP: a phosphatase that directly dephosphorylates Akt, promotes apoptosis, and suppresses tumor growth. Mol Cell. 2005;18:13-24
44. Agarwal NK, Zhu X, Gagea M. et al. PHLPP2 suppresses the NF-κB pathway by inactivating IKKβ kinase. Oncotarget. 2014;5:815-23
45. Kim KJ, Li B, Winer J. et al. Inhibition of vascular endothelial growth factor-induced angiogenesis suppresses tumour growth in vivo. Nature. 1993;362:841
46. Plate KH, Breier G, Weich HA. et al. Vascular endothelial growth factor is a potential tumour angiogenesis factor in human gliomas in vivo. Nature. 1992;359:845-8
47. Chaudhry IH, O'Donovan DG, Brenchley PEC. et al. Vascular endothelial growth factor expression correlates with tumour grade and vascularity in gliomas. Histopathology. 2001;39:409-15
48. Varlet P, Guillamo JS, Nataf F. et al. Vascular endothelial growth factor expression in oligodendrogliomas: a correlative study withSainte-Anne malignancy grade, growth fractionand patient survival. Neuropathol Appl Neurobiol. 2000;26:379-89
49. Chang TC, Wentzel EA, Kent OA. et al. Transactivation of miR-34a by p53 broadly influences gene expression and promotes apoptosis. Mol Cell. 2007;26:745-52
50. Yin D, Ogawa S, Kawamata N. et al. miR-34a functions as a tumor suppressor modulating EGFR in glioblastoma multiforme. Oncogene. 2013;32:1155
51. Yin Y, Ornell KJ, Beliveau A. et al. Modulation of MicroRNAs 34a and 21 Affects Viability, Senescence, and Invasion in Glioblastoma Multiforme. J Biomed Nanotechnol. 2016;12:1782-97
52. Gao H, Zhao H, Xiang W. Expression level of human miR-34a correlates with glioma grade and prognosis. J Neurooncol. 2013;113:221-8
53. Wang Y, Wang L. miR-34a attenuates glioma cells progression and chemoresistance via targeting PD-L1. Biotechnol Lett. 2017;39:1-8
Author contact
![]() Corresponding authors: Liwei Zhang, E-mail: 112016000201edu.cn Affiliations: Department of Neurosurgery, Beijing Tiantan Hospital, Capital Medical University, Tiantanxili 6, Dongcheng District, Beijing, 100050, China. Postal Address: No.6 Tiantanxili, Dongcheng District, Beijing, China, 100050. Tel: 86-010-67098431; Fax: 86-010-67051377 and Yongmei Song, E-mail: symlh2006com Affiliations: State Key Laboratory of Molecular Oncology, National Cancer Center/Cancer Hospital, Chinese Academy of Medical Sciences and Peking Union Medical College, Beijing 100021, China. Postal Address: No.17 Panjiayuannanli, Chaoyang District, Beijing, China, 100021. Tel: 86-010-87787496; Fax: 86-010-87787496
Corresponding authors: Liwei Zhang, E-mail: 112016000201edu.cn Affiliations: Department of Neurosurgery, Beijing Tiantan Hospital, Capital Medical University, Tiantanxili 6, Dongcheng District, Beijing, 100050, China. Postal Address: No.6 Tiantanxili, Dongcheng District, Beijing, China, 100050. Tel: 86-010-67098431; Fax: 86-010-67051377 and Yongmei Song, E-mail: symlh2006com Affiliations: State Key Laboratory of Molecular Oncology, National Cancer Center/Cancer Hospital, Chinese Academy of Medical Sciences and Peking Union Medical College, Beijing 100021, China. Postal Address: No.17 Panjiayuannanli, Chaoyang District, Beijing, China, 100021. Tel: 86-010-87787496; Fax: 86-010-87787496
Citation styles
APA
Chen, X., Dong, D., Pan, C., Xu, C., Sun, Y., Geng, Y., Kong, L., Xiao, X., Zhao, Z., Zhou, W., Huang, L., Song, Y., Zhang, L. (2018). Identification of Grade-associated MicroRNAs in Brainstem Gliomas Based on Microarray Data. Journal of Cancer, 9(23), 4463-4476. https://doi.org/10.7150/jca.26417.
ACS
Chen, X.; Dong, D.; Pan, C.; Xu, C.; Sun, Y.; Geng, Y.; Kong, L.; Xiao, X.; Zhao, Z.; Zhou, W.; Huang, L.; Song, Y.; Zhang, L. Identification of Grade-associated MicroRNAs in Brainstem Gliomas Based on Microarray Data. J. Cancer 2018, 9 (23), 4463-4476. DOI: 10.7150/jca.26417.
NLM
Chen X, Dong D, Pan C, Xu C, Sun Y, Geng Y, Kong L, Xiao X, Zhao Z, Zhou W, Huang L, Song Y, Zhang L. Identification of Grade-associated MicroRNAs in Brainstem Gliomas Based on Microarray Data. J Cancer 2018; 9(23):4463-4476. doi:10.7150/jca.26417. https://www.jcancer.org/v09p4463.htm
CSE
Chen X, Dong D, Pan C, Xu C, Sun Y, Geng Y, Kong L, Xiao X, Zhao Z, Zhou W, Huang L, Song Y, Zhang L. 2018. Identification of Grade-associated MicroRNAs in Brainstem Gliomas Based on Microarray Data. J Cancer. 9(23):4463-4476.
This is an open access article distributed under the terms of the Creative Commons Attribution (CC BY-NC) license (https://creativecommons.org/licenses/by-nc/4.0/). See http://ivyspring.com/terms for full terms and conditions.