Journal of Cancer
ISSN: 1837-9664
3.2
Impact Factor
ISSN: 1837-9664

 Global reach, higher impact
J Cancer 2019; 10(6):1479-1488. doi:10.7150/jca.29282 This issue Cite
Research Paper
Significance of Amphiregulin (AREG) for the Outcome of Low and High Grade Astrocytoma Patients
Giedrius Steponaitis ![]() , Arunas Kazlauskas, Daina Skiriute, Paulina Vaitkiene, Kestutis Skauminas, Arimantas Tamasauskas
, Arunas Kazlauskas, Daina Skiriute, Paulina Vaitkiene, Kestutis Skauminas, Arimantas Tamasauskas
Laboratory of Molecular Neurooncology, Neuroscience Institute, Lithuanian University of Health Sciences, Eiveniu str. 4, Kaunas, LT 50161, Lithuania
Received 2018-8-16; Accepted 2018-12-5; Published 2019-2-23
Citation:
Steponaitis G, Kazlauskas A, Skiriute D, Vaitkiene P, Skauminas K, Tamasauskas A. Significance of Amphiregulin (AREG) for the Outcome of Low and High Grade Astrocytoma Patients. J Cancer 2019; 10(6):1479-1488. doi:10.7150/jca.29282. https://www.jcancer.org/v10p1479.htm
Other stylesAbstract
Background: Amphiregulin (AREG) is one of the ligands of the epidermal growth factor receptor which levels was shown to have a tight coherence with various types of cancer. AREG was also designated to be a promising marker for several types of cancer however precious little data about AREG role in the most frequent and generally lethal human brain tumours - astrocytomas reported up to date. The aim of the study was to investigate how AREG changes at epigenetic and expression levels reflect on astrocytoma malignancy and patient outcome.
Methods: In total 205 low and high grade astrocytoma samples (15 pilocytic astrocytomas, 56 diffuse astrocytomas, 32 anaplastic astrocytomas and 102 glioblastomas) were used for target mRNA, protein expression and DNA methylation analysis applying qRT-PCR, Western-Blot and MS-PCR assays, respectively.
Results: Present research revealed that AREG expression level and methylation in cancer tissue is dependent on the grade of astrocytoma. GBM tissue disclosed elevated AREG mRNA expression but reduced AREG protein level as compared to grade II and grade III astrocytomas (p<0.001). Increased methylation frequency was also more abundant in GBM (74%) than grade I, II and III astrocytomas (25%, 34%, and 36%, respectively). The survival analysis revealed relevant differences in patient overall survival between AREG methylation, mRNA and protein expression groups. Kaplan-Meier analysis encompassing only malignant tumours showed similar results indicating that AREG is associated with astrocytoma patient survival independently from astrocytoma grade.
Conclusions: Current findings demonstrate that AREG appearance is associated with patient survival as well as astrocytomas malignancy indicating its influence on tumour progression and suggest its applicability as a promising marker.
Keywords: amphiregulin, astrocytoma, glioma, expression, methylation
Background
Gliomas are the most abundant brain tumours of which for the most part predominate astrocytomas [1]. In accordance with the 4th edition of World Health Organization (WHO) classification, four types of astrocytic tumours are described according to its malignancy (pilocytic astrocytoma, WHO grade I; diffuse astrocytoma, grade II; anaplastic astrocytoma, grade III and glioblastoma, grade IV) [2]. The current criteria used to characterize clinically relevant types of astrocytoma are not entirely sufficient indicators and the application of new molecular markers is essential to improve tumour characterization and subtyping. A growing body of epidemiologic and molecular research has identified an important role of genomic and epigenomic alterations in astrocytoma initiation, susceptibility, and prognosis. Information on distinct molecular alterations predisposing to cancer could be utilized for more accurate diagnosis, tumour subtyping, treatment strategy or prognosis of the disease.
Amphiregulin (AREG) is one of the ligands of the epidermal growth factor receptor (EGFR) [3] which was observed to be altered in malignant astrocytomas [4-6] and which is responsible for activation of a complex network of pathways, including the Ras/MAPK, PI3K/AKT, PLCγ and STAT. Modulation of listed signalling cascades promotes multiple cellular responses such as invasiveness, motility, angiogenesis, proliferation, etc. [3,7]. AREG mRNA consists of six exons that are translated as 252 AA type I transmembrane glycoprotein precursor - Pro-AREG. Pro-AREG is expressed on the cell surface with a hydrophilic extracellular N-terminus, a heparin-binding (HB) domain and the EGF-like domain followed by a juxtamembrane stalk containing the cleavage site (Lys187) for “ectodomain shedding”, a hydrophobic transmembrane domain and a short hydrophilic intracellular cytoplasmic tail [8]. Cleavage of Pro-AREG appears at two N-terminal sites which produce two major soluble forms of AREG (~19 and ~21 kDa). Besides, ectodomain shedding of pro-AREG can give rise to a larger soluble protein of 43 kDa in proportion to the entire extracellular domain. Shedding of extracellular Pro-AREG domain can be initiated by TACE enzyme - a member of the disintegrin and metalloproteinase (ADAM) family also known as ADAM17. After the Pro-AREG cleavage at Lys187 is complete, secreted mature ligand behaves as an autocrine or paracrine factor on the adjacent cells with its consanguine receptor - epidermal growth factor receptor (EGFR) [3,9]. The interaction between AREG and EGFR triggers substantial intracellular signalling cascades, suchlike the survival PI3K/Akt and the mitogenic MAPK pathways [3,10].
AREG was originally identified to appear in a wide range of physiological processes such as bone formation, axonal outgrowth, mammary gland development, keratinocyte proliferation, blastocyst implantation and etc. [7]. In case of cancer, AREG is mostly described as an oncogenic factor. AREG was found to be up-regulated in a broad diversity of neoplasms suchlike lung [11], colon and stomach [12,13], pancreas [14], breast [15], prostate [16], bladder [17], liver [18] as well as skin and biliary [7]. Functional studies of amphiregulin showed that AREG can behave as a pro-oncogenic factor playing a part in most of the hallmarks of cancer [19]. AREG significance for cancer development and progression is also supported by clinical data showing that circulating AREG may serve as a prognostic [20] and/or a predictive [21] biomarker for non-small-cell lung cancer (NSCLC).
Despite the overwhelming data about AREG role in a wide variety of cancers there is lacking extensive information about AREG behaviour in human astrocytomas. The level of AREG showed to be important over the carcinogenesis and this prompt us to verify molecular properties of AREG in astrocytic tumours in the prospect of a potential biomarker.
Methods
Patients and tissue samples
The study in total included 205 WHO grade I-IV astrocytomas: 15 (7.3%) pilocytic astrocytomas WHO grade I, 56 (27.5%) diffuse astrocytomas WHO grade II, 32 (15.6%) anaplastic astrocytomas WHO grade III, and 102 (49.8%) glioblastomas - WHO grade IV astrocytomas (table 1). All astrocytic tumours were surgically resected without prior treatment. The diagnoses of tumour samples were identified by routine clinical pathologists' workload according to the 2007 WHO criteria [2]. Tumorous tissues of astrocytoma patients were collected following written informed consent, after approval of the Ethics Committee for Biomedical Research of the Lithuanian University of Health Sciences (LUHS). The study was performed in accordance with the principles of the Declaration of Helsinki. Tumour tissue samples after resection were immediately snap-frozen in liquid nitrogen and stored until the analysis.
The analysis included following clinical data: patient gender, age at the time of the operation and patient survival status. Listed data were collected for each patient. The overall survival of the patient was calculated from the date of tumour resection to the date of patient death or database closure date. Database closure was on April 2018.
Table 1
Clinical characteristics of study sample.
| WHO grade Histological type | Sample size | Patient age (years) | Gender | |||
|---|---|---|---|---|---|---|
| mean | median | male | female | |||
| Grade I Pilocytic astrocytoma | 15 | 34.4 | 26.1 | 4 | 11 | |
| Grade II Diffuse astrocytoma | 56 | 39.7 | 36.9 | 32 | 24 | |
| Grade III Anaplastic astrocytoma | 32 | 41.6 | 41.2 | 17 | 15 | |
| Grade IV Glioblastoma | 102 | 61.7 | 62.3 | 40 | 62 | |
| Total: | 205 | 50.6 | 51.4 | 93 | 112 | |
qRT-PCR
Tumour RNA was extracted using TRIzol and cDNA was synthesized using 1μg RNA with RevertAid H Minus M-MuLV Reverse Transcriptase (Cat. No. EP0451, ThermoFisher Scientific Inc.) as previously described [22]. mRNA expression of AREG was investigated applying quantitative RT-PCR SYBR Green I and TaqMan assays in 3 replicates on 7500 Fast Real-time PCR detection system (Applied Biosystems) and relative quantification when normalized to reference gene method was used (ΔCT). PCR reaction in a total volume of 12μl consisted of 3 μl of cDNA, 6 µl TaqMan Universal Master Mix (Cat. No. 4304437, Applied Biosystems), 1 µl of AREG or TBP (TATA-Box Binding Protein) TaqMan probe and nuclease-free water. PCR reaction using SYBR Green I consisted of 3 μl of cDNA, 6 µl of Maxima SYBR Green/ROX qPCR Master Mix (Cat. No. K0223, ThermoFisher Scientific Inc.), primers for AREG or ACTB and nuclease-free water. All procedures and calculations using appropriate controls were performed as previously described [22], applying following probes and primers: AREG TaqMan probe (assay no: Hs00950669_m1) TBP TaqMan probe (assay no: Hs00427620_m1). Primers used in SYBR Green I assay for AREG 5′-TGGAAGCAGTAACATGCAATGTC-3′ (sense) and 5′-GGCTGCTAATGCAATTTTTGATAA-3′ (antisense) to a total concentration of 0.5 μM, (amplicon length: 116 bp). Primers used in SYBR Green I assay for ACTB 5′-AGAGCTACGAGCTGCCTGAC-3′ (sense) and 5′-AGCACTGTGTTGGCGTACAG-3′ (antisense) to a total concentration of 0.1 μM, (amplicon length: 184 bp).
Western-Blot analysis
Preparation of tissue extracts from cryogenically homogenized tumour samples, SDS-PAGE and protein transfer to nitrocellulose membrane procedures were done as previously described [23]. For Amphiregulin detection primary rabbit antibody against AREG (dilution 1:800; Cat. No. bs-3847R, Bios antibodies) in 5% non‑fat milk in PBS was used (incubated for 4h at room temperature - RT). After washing in PBS supplemented with 0.5% Tween‑20 buffer, membranes with immuno-complexes were incubated for 1 hour at RT with anti‑rabbit secondary antibody conjugated with horseradish peroxidase (HRP) (dilution 1:4000; Cat. No. 314360, Pierce antibodies, ThermoFisher Scientific Inc.). Signals were visualized using liquid 3,3',5,5'‑tetramethylbenzidine substrate (Cat. No. T0565‑100ML, Sigma‑Aldrich, MerckMillipore) and documented using an ordinary scanner. Detection assay of endogenous control - ACTB on the same membranes after mild stripping and re-probing was performed as previously described [23]. Expression bands of AREG and ACTB were evaluated using image analysis program ImageJ version 1.47 (National Institute of Health, Bethesda, USA).
Methylation specific PCR
Tumour tissue DNA purification using modified salting‑out method, bisulfite modification using EpiJET Bisulfite Conversion Kit (Cat No: K1461, Thermo Scientific, Inc.), target amplification and methylation detection procedures were performed as previously described [23]. MSP primers for methylated and unmethylated sequences were designed using free access online software's [24,25]. Methylation assay of AREG promoter was performed using two primer sets for different CpG dinucleotide sites.
1st primer set for AREG promoter methylation analysis: For methylated sequence: 5′- TATTTACGGTCGGGTTTTGAC-3′ (sense); 5′-ACTATCCCGAAACCTCTAAAACG-3′ (antisense) amplicon length: 130bp; For unmethylated sequence: 5′-TTTTTATTTATGGTTGGGTTTTGAT-3′ (sense); 5′- AACTATCCCAAAACCTCTAAAACACT -3′ (antisense) amplicon length: 135bp. 2nd primer set for AREG promoter methylation analysis: For methylated sequence: 5′- CGGCGTATATTTTCGGTTTTTATTC-3′ (sense);5′- GTCTCGATCTCTAAAACAACTCGAT-3′ (antisense) amplicon length: 96 bp. For unmethylated sequence: 5′- GAGAGTGGTGTATATTTTTGGTTTTTATTT-3′ (sense) 5′-ATCTCAATCTCTAAAACAACTCAAT-3′ (antisense) amplicon length: 101 bp.
MSP consisted of 7.5 μl of Maxima Hot Start PCR Master Mix (Cat No: K1052, Thermo Scientific Inc.), 10 pmol of each primer (Metabion International AG) and nuclease-free water in a total volume of 15 µl. MSP was carried out under standard conditions with the annealing temperature of 58 °C and 62 °C (1st and 2nd primer pair respectively) for 30 s. MSP products were analysed as previously described [23]. The appearance of the band with correct molecular weight in gel indicated the presence of either unmethylated or methylated alleles (Fig. 4C). In a case of amplification of both variants (methylated and unmethylated), a sample was assumed to be methylated.
Statistical analyses
Statistical calculations were performed using SPSS Statistics 20 (SPSS Inc., Chicago, IL) software package. To evaluate the differences across astrocytoma grades and qRT-PCR and Western-blot expression data Kruskal-Wallis test was used. Mann-Whitney test was used to evaluate mRNA and protein expression differences between methylation and between patient clinical data groups (age, gender, tumour grade, survival groups). Chi-square test was used for association analysis between methylation and patient clinical data. The Kaplan-Meier method was applied to estimate survival functions and the log-rank test used to compare survival difference between groups. For survival analysis, quantitative data such as protein expression and normalized mRNA expression of AREG was divided into two expression groups as categorical data (low and high expression) according to the 50th percentile. Prognostic factors such as gender, age, pathological grade, AREG promoter methylation, protein and mRNA expression were first examined individually (univariate analysis), and all factors that had a strong impact on survival (p< 0.05) were then evaluated jointly in Cox regression analysis (multivariate analysis). Astrocytoma grade II was selected as reference category when analyzing nominal covariates. The p<0.05 was considered significant.
Results
AREG mRNA expression in tumour tissue
Using qRT-PCR technique AREG mRNA expression was analysed in 171 tumours (11 grade I, 47 grade II, 25 grade III and 88 grade IV). The amplification curves of AREG mRNA appeared at very late cycles (cycle threshold - CT from 26 to 36) as compared to endogenous controls (ACTB and TBP) even in the control sample comprising of a pool of healthy human brain mRNA (Ct=30.4). In order to elucidate the situation TaqMan gene expression assay was used and very similar data to those previously described were obtained. The latter analysis indicated that AREG expression at mRNA level in astrocytic tumours is very weak. Nevertheless, the mRNA expression was not detected in more than one-third of samples (the signal was under the sensitivity threshold) even after several repeats of the assay. Assay relevant data from 106 samples were normalized using ACTB and TBP endogenous controls. Analysis showed that upregulated AREG mRNA level was characteristic for glioblastoma tissue compared to grade II astrocytoma (p<0.001). Meanwhile, grade III astrocytoma samples showed a tendency to have lower AREG mRNA expression as compared to glioblastoma (p=0.14), pilocytic astrocytoma tissue expressed AREG mRNA at a similar level as GBM (Fig. 1; table 2).
We also checked if patient age (at operation time) and gender were related with tumour AREG mRNA expression. Mann-Whitney U test showed a significant relation between patient age and AREG mRNA expression (p=0.024, N=106) and older patients tend to have higher AREG mRNA levels (age mean 59.89 vs. 46.38). The gender of the patient had no impact on AREG mRNA level (p=0.397).
Figure 1
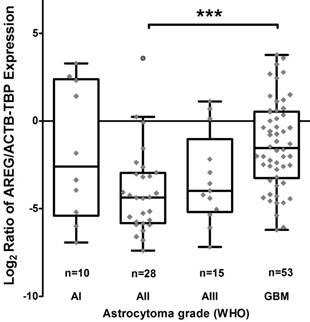
Tukey Boxplot of AREG mRNA expression in WHO grade I-IV astrocytomas. (A) Boxplot with scatter dot of AREG mRNA expression normalized to TBP-ACTB. Glioblastoma tissue showed significantly upregulated AREG level compared to grade II astrocytomas. AI-AIII - WHO grade I-III astrocytoma, GBM - glioblastoma.
Table 2
Association of AREG molecular properties and astrocytoma patients' clinicopathological features.
| Cases | Methylation1 | mRNA expression | Protein expression | |||||||||
|---|---|---|---|---|---|---|---|---|---|---|---|---|
| M N (%) | U N (%) | p-value | Low N (%) | High N (%) | p-value | Low N (%) | High N (%) | p-value | ||||
| Gender | Male | 24 (35.3) | 31 (47.7) | 0.147 | 24 (57.1) | 18 (42.9) | 0.237 | 42 (60.9) | 30 (42.9) | 0.061 | ||
| Female | 44 (64.7) | 34 (52.3) | 29 (45.3) | 35(54.7) | 27 (39.1) | 40 (57.1) | ||||||
| Age (years) | ≤50 | 20 (29.4) | 45 (69.2) | <0.001 | 31 (62) | 19 (38) | <0.024 | 24 (34.8) | 47 (67.1) | <0.001 | ||
| >50 | 48 (70.6) | 20 (30.8) | 22 (39.3) | 34 (60.7) | 45 (65.2) | 23 (32.9) | ||||||
| WHO Grade | I | 3 (25) | 9 (75) | <0.001 | 5 (50) | 5 (50) | 0.006 | 6 (8.7) | 7 (10) | <0.001 | ||
| II | 13 (34.2) | 25 (65.8) | 23 (82.1) | 5 (17.9) | 6 (8.7) | 35 (50) | ||||||
| III | 9 (36) | 16 (64) | 9 (60) | 6 (40) | 13 (18.8) | 14 (20) | ||||||
| IV | 43 (74.1) | 15 (25.9) | 16 (30.2) | 37 (69.8) | 44 (63.8) | 14 (20) | ||||||
| Survival (months) | <24 | 41 (60.3) | 17 (26.2) | <0.001 | 12 (25) | 36 (75) | <0.001 | 46 (67.7) | 29 (41.2) | 0.009 | ||
| >24 | 27 (39.7) | 48 (73.8) | 41 (70.7) | 17 (29.3) | 22 (32.4) | 41 (58.6) | ||||||
| Methylation1 | M (%) | 22 (44) | 28 (56) | 0.443 | 16 (45.7) | 19 (54.3) | 0.66 | |||||
| U (%) | 20 (52.6) | 18 (43.2) | 19 (45.2) | 23 (54.8) | ||||||||
| mRNA expression | Low | 10 (26.3) | 28 (73.7) | <0.001 | ||||||||
| High | 19 (70.4) | 8 (29.6) | ||||||||||
1 - AREG promoter methylation status obtained with first primer set. M - methylated, U - unmethylated. N - number of samples. Expression data (of mRNA and protein) were divided into Low and High expression groups according to 50th percentile.
Tumour AREG protein level
To assess if AREG mRNA expression in astrocytomas is associated with AREG protein level next we analysed AREG protein expression for 139 tumour samples (13 grade I, 41 grade II, 27 grade III and 58 GBM) using Western blot assay. Contrary to AREG mRNA data immunoblot analysis showed significantly lower AREG protein level in the most aggressive astrocytic tumour - glioblastoma samples as compared to grade II (p<0.001) and grade III (p=0.019) astrocytoma (Fig. 2A). No significant difference in AREG protein expression between grade II and grade III astrocytomas was observed. Contrary to grade II and grade III astrocytomas, pilocytic astrocytomas (grade I) tissue revealed lower AREG protein level which was similar to glioblastoma tissue (fig. 2A). It should be noticed that cohort of grade I astrocytoma patient's age was younger (median 26.1 years) as compared to grade II, III and IV astrocytoma patients (median 36.9, 41.2 and 62.2 years respectively).
Figure 2
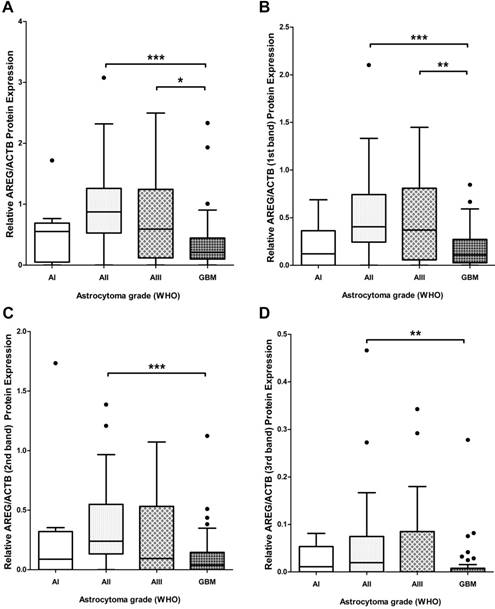
Tukey Boxplot of AREG protein level in in WHO grade I-IV astrocytomas. (A) AREG protein expression calculated including signals intensity of all detected isoforms. GBM tissue showed significantly downregulated AREG level compared to grade II and grade III astrocytomas. (B) AREG protein expression calculated including signal intensity of only 1st (heaviest) isoform (~50 kDa) showed similar associations as combined intensity calculations. (C) AREG protein level measured according to signal intensity of only 2nd (middle) isoform (~45 kDa) showed downregulated AREG in glioblastoma compared grade II astrocytoma. (D) AREG protein expression quantified including signal intensity of only 3rd (lightest) isoform (~42 kDa) showed significantly lower AREG levels in glioblastoma as compared to grade II astrocytoma tissue. Asterisk: *p<0.05; **p<0.01; ***p<0.001; AI-AIII - WHO grade I-III astrocytoma, GBM - glioblastoma.
Due to the contradictory AREG protein and mRNA expression findings, we decided to analyse immunoblot data more deeply. Visualization of AREG showed three protein isoforms (Fig. 3) between 55 and 40 kDa which are described in the literature [26]. Signal densities of all three AREG isoforms were recorded as separate signals and normalized values used for statistical analysis. The data of individual isoform signal measurements showed to be similar to those from total signal intensity measurement. AREG level was significantly downregulated in glioblastoma samples as compared to grade II and grade III astrocytoma in the case of the first peak (pro-AREG ~50 kDa) (p<0.001 and p=0.01, respectively). No significant differences between grade II and grade III, grade I and grade IV, grade I and grade III were found. Second peak (~45 kDa) analysis showed significant AREG downregulation in glioblastomas compared to grade II astrocytoma's (p<0.001) but no other significant differences were found. Third isoform (~42 kDa) analysis showed significantly suppressed AREG expression in glioblastoma when compared to grade II astrocytoma (see Fig. 2 B, C, D).
Next, we checked if patient's age and gender were dependent on AREG protein expression (total signal). Mann- Whitney U test showed that patient's age was significantly associated with AREG expression (p=0.004) and younger patients tend to have higher tumour AREG expression vs. older patients (age mean 59.1 vs. 81.1). Patient gender has no significant association AREG protein expression ((p=0.061) where men AREG level was slightly higher than women) (table 2).
AREG methylation in tumour
The methylation of AREG gene promoter in tumours was analysed with two sets of primers for 133 samples with first primer set and for 94 samples with second primer set. Findings from both primer sets showed similar data. Analysis showed that AREG promoter methylation frequency is depending on astrocytoma grade (N=133; χ2=22.2; df=3; p<0.001 / N=94; χ2=12.3; df=3; p=0.006) and was more frequent in glioblastomas (N=133, 74%) as compared to lower grade astrocytomas (N=133, 25%, 34%, 36% grade I, II, III, respectively) (Fig. 4A, B). Furthermore, AREG promoter methylation in astrocytomas was associated with patients age. Methylation frequency in a tumours of older patients tended to be higher than those of younger age (Mann-Whitney U test, N=133, p<0.001 / N=94; p=0.055). Patient gender showed no relation with AREG methylation (table 2).
Figure 3
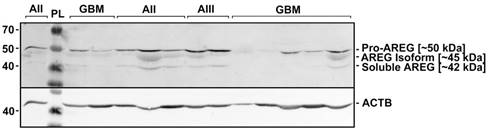
Representative results of AREG protein Western blot analysis in WHO grade I-IV astrocytomas. Astrocytomas of WHO grade II, III, and IV (glioblastoma) are indicated as AII, AIII, and GBM, respectively. PL - protein ladder (Spectra™ Multicolor Broad Range Protein Ladder, Thermo Fisher Scientific Inc.). Three isoforms (~50; ~45; 42 kDa) of AREG protein were detected which are described in the literature [27].
Figure 4
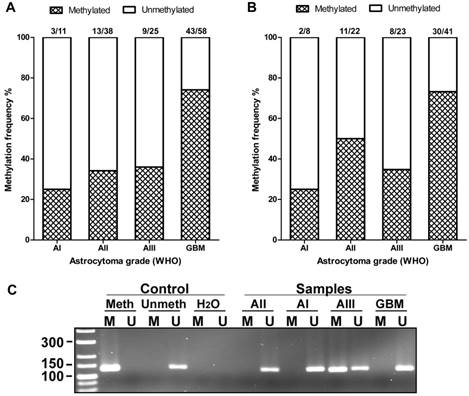
AREG promoter methylation in WHO grades I-IV astrocytomas. (A) Methylation frequency (%) showed in darkened bars for each of astrocytoma grade. Data obtained using 1st set of primers (n=132). (B) Data obtained using 2nd set of primers (n=94). (C) Representative MS-PCR for AREG. Meth -„Standard Bisulfite Converted Universal Methylated Human DNA“ as positive methylation control, Unmeth - normal human peripheral lymphocyte DNA as negative methylation control, H2O - water control. AI, AII, AIII, GBM - astrocytoma grade I-IV samples. M - primer for methylated and U - primer for unmethylated DNA.
Associations of molecular properties of AREG
Data showed increased AREG promoter methylation and mRNA level but decreased AREG protein level in the same tissue set of high grade astrocytomas. For this reason linear correlation between the variables was checked. No correlations between AREG protein level and methylation status (Spearman's r=-0.55, p>0.05), mRNA level and methylation status (r=0.037, p>0.05) was found (p>0.05). Nevertheless, significant but weak inverse correlation between AREG protein level and mRNA expression was found (Spearman's r=-0.334, p=0.001). Mann-Whitney U test showed significant associations between AREG protein and mRNA expression (CT values) (p<0.001), but no link between AREG mRNA expression and AREG methylation (p=0.443) and no association between protein expression and methylation (p=0.66) (table 2).
The impact of molecular alterations of AREG on patient survival
Next, we decided to analyse the association between AREG expression and patient survival.
The Kaplan-Meier analysis when applying the log-rank test revealed a strong association between AREG mRNA expression and patient overall survival (Log-rank test, χ2=13.031, df=1, p<0.001) (see Fig. 5A). Patients having tumours with high AREG mRNA level had worse survival prognosis than low AREG expression patients. Either, amphiregulin protein level and patient survival also showed to be significantly related. Contrary to mRNA data, patients with high protein level in tumour had better survival rates than low protein expression patients (Log-rank test, χ2=10.52, df=1, p=0.001) (Fig. 5C).
MSP data analysis also showed that AREG methylation is significantly associated with patients' survival. Patients whose tumours were found to have unmethylated AREG had better survival prognosis as compared to methylated AREG patients (Log-rank test, N=133, χ2=18.61, df=1, p<0.001 / N=94, χ2=5.88, df=1, p=0.015) (Fig. 6A, B).
Patient survival was strongly associated with AREG mRNA, protein expression, and methylation. To check if this coherency is not the result of tumour grade, we eliminated benign tumour patients (astrocytoma grade I and grade II) from the analysis and performed survival analysis only with malignant tumour patients. The results were similar to those when all the samples were analysed (for the complete details see Fig. 5B,D; 6C,D).
Univariate Cox regression analysis was used to assess the prognostic potential of patients clinical and molecular variables, such as astrocytoma malignancy grade, patient age and gender, AREG promoter methylation, mRNA and protein expression. Grade I astrocytomas were removed from the analysis because of an insufficient number of samples and alive patient status. Univariate Cox analysis showed that astrocytoma grade (p<0.001, HR=2.88), patient age (p<0.001, HR=1.062), AREG mRNA expression (p=0.018, HR=1.094), protein level (p=0.046, HR= 0.669) and AREG promoter methylation status (N= 133, p<0.001, HR=2.43) were independent variables significantly associated with patient overall survival rates.
All variables that had a strong impact on patient overall survival were included in multivariate Cox analysis. Multivariate Cox analysis showed that only tumour malignancy and patient age were independent prognostic factors which increased the risk of shorter patient survival (table 3).
Figure 5
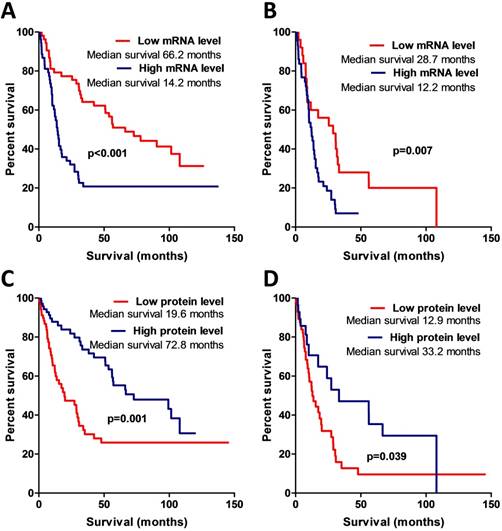
Kaplan-Meier curves representing patient survival and AREG mRNA and protein expression. (A) Kaplan-Meier curves of AREG mRNA data divided into two expression groups according to 50th percentile, Log-rank test, χ2=13.03, df=1, p<0.001. (B) Kaplan-Meier survival curves using mRNA data only from malignant (WHO grade III and grade IV) astrocytomas, Log-rank test, χ2=7.4, df=1, p=0.007. (C) Kaplan-Meier curves of AREG protein expression groups according to 50th percentile. All dataset used for the analysis. Log-rank test, χ2=10.52, df=1, p=0.001. (D) Kaplan-Meier curves of AREG protein expression groups. Only malignant astrocytomas (grade III and IV) used for the estimation. Log-rank test, χ2=4.26, df=1, p=0.039.
Table 3
Multivariate Cox regression analysis of potential prognostic factors
| Factor | HR 95% Cl | B | p-value |
|---|---|---|---|
| Astrocytoma WHO grade | |||
| grade II | |||
| grade III | 1.367 (0.451 - 4.143) | 0.313 | 0.581 |
| grade IV (GBM) | 9.292 (1.334 - 64.717) | 2.229 | 0.024 |
| Age (scale) | 1.066 (1.009 - 1.126) | 0.064 | 0.022 |
| AREG mRNA level (scale) | 1.038 (0.885 - 1.219) | 0.038 | 0.645 |
| AREG protein level (scale) | 1.937 (0.958 - 3.917) | 0.661 | 0.066 |
| AREG methylation status (n=133) | 2.043 (0.873 - 4.78) | 0.714 | 0.100 |
Discussion
Novel molecular markers are instrumental in the case of astrocytoma malignancies not only for improvement of diagnostics accuracy but also for prognosis evaluation and follow-up of the patients. The aim of this study was to examine AREG molecular alterations in the different grade of astrocytomas with a perspective application of this target in diagnostic and/or prognostic schemes since AREG showed to be a very promising target for prognostics and/or diagnostics in other types of cancers [11,18,20,27-29]. In this study, we for the first time showed AREG protein and mRNA level and AREG methylation frequency in the same set of patients for all grade of astrocytoma tumours.
Since then, it was found that AREG mRNA expression is strongly regulated by methylation, and is associated with CIMP status in colorectal cancer [30] we decided to incorporate AREG promoter methylation in the analysis. Methylation analysis showed highly methylated AREG promoter regions in glioblastoma (74%) compared with lower grade astrocytoma (25-36%). To our knowledge, there are only two studies yet on AREG promoter methylation in human astrocytoma tissues. The first study published by Laffaire et al. showed 52% frequency of AREG promoter methylation in low-grade gliomas (grade II oligodendrogliomas, grade II astrocytomas) [31] while present research showed comparable methylation frequency 34% and 50% (1st primer set and 2nd primer set, respectively) in grade II astrocytomas. The second study published by our team revealed 56.8 % AREG methylation frequency in glioblastomas (n=99) (different sample set) [32]. In the present analysis, we showed similar AREG methylation frequency data given the fact that GBMs are very heterogeneous tumours, even survival analysis in both studies revealed shorter overall survival for GBM patients with methylated AREG promoter. As the AREG methylation is constantly increasing with grade and is related to patient survival, that may show AREG methylation importance for the tumour genesis.
Figure 6
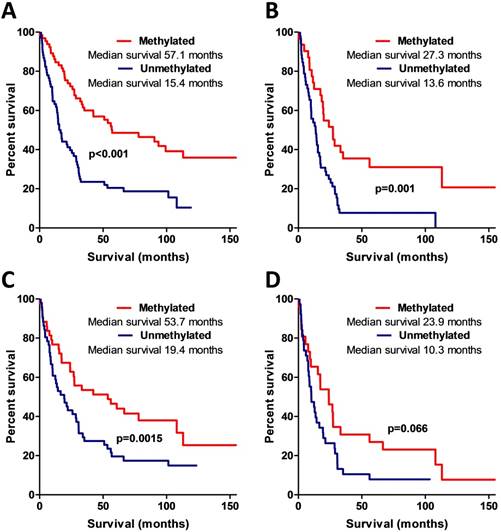
Kaplan-Meier curves representing AREG promoter methylation and patient survival. (A) Kaplan-Meier curves of AREG promoter methylation groups (using 1st primer set), Log-rank test, N=132, χ2=18.61, df=1, p<0.001. (B) Kaplan-Meier curves of AREG promoter methylation groups in only malignant (WHO grade II-III) astrocytomas (using 1st primer set), Log-rank test N=132, χ2=11.24, df=1, p=0.001. (C). Kaplan-Meier curves of AREG promoter methylation groups (using 2nd primer set), Log-rank test N=94, χ2=5.88, df=1, p=0.015. (D) Kaplan-Meier curves of AREG promoter methylation groups in only malignant (grade II-III) astrocytomas (using 2nd primer set), Log-rank test N=94, χ2=3.37, df=1, p=0.066.
During WB analysis we found downregulated AREG protein level in glioblastomas as compared to lower grade II and III astrocytomas but not grade I astrocytoma. This could be related to the fact that pilocytic astrocytomas are more characteristic for young patients, especially for children and this anticipates different molecular-genetic and epigenetic events and tumour behaviour [33]. Survival analysis showed that low AREG protein expression was related to better patient survival prognosis. These data are contrary to the data found in other neoplasms including colon, breast, lung, liver, ovary, pancreas, prostate, bladder, and skin cancers where upregulated AREG level in cancerous tissue was found [3,7,18,28]. Moreover upregulated AREG protein level was associated with poor overall survival of patients with colorectal cancer [29], hepatocellular carcinoma [18], pancreatic ductal adenocarcinoma [28], non-small cell lung cancer [11] and mucoepidermoid carcinoma of the major salivary glands [34]. Nevertheless, AREG was also described as a bifunctional modulator which can either stimulate or inhibit the growth of lung cancer cells depending on the biological settings [35]. There is no data to compare AREG protein expression in human brain astrocytomas up to date. Present study revealed decreased AREG protein level in malignant tumours and this could support the hypothesis that elevated expression of shedding initiator - TACE/ADAM17 in glioblastoma [36,37] accelerate the release of cleaved AREG protein from the membrane to the extracellular matrix. Cancer cells themselves are able to alter the adjacent tissue to establish a supportive and permissive environment for tumour progression [38] and AREG in malignant tumours could act like a messenger directed to adjacent non-malignant or healthy tissue. This could explain decreased level of AREG protein in glioblastomas as compared to grade II and III astrocytomas where TACE/ADAM17 is expressed at lower level [37] and where AREG most likely acts in autocrine or juxtacrine manner.
AREG expression at mRNA level showed increased mRNA values in glioblastoma as compared to grade II but not grade I astrocytoma and III astrocytoma. Patients with low AREG mRNA level had better survival prognosis than high AREG expression patients. mRNA data of AREG we found in astrocytomas do not opposite the tendency that AREG at mRNA level is from slightly to highly upregulated in malignant tumours such as stomach and colon [13,29], breast [15,39], liver [40], biliary [41], prostate [16], salivary glands [34], ovarian, and pancreatic cancers [3,7]. Moreover, similarly to astrocytomas, AREG mRNA expression was found to be related with patient overall survival in lung and gastric cancer [42], mucoepidermoid carcinoma of the major salivary glands [34], colorectal cancer [29,43,44] and pancreatic ductal adenocarcinoma [29]. Present findings meets the data available in TCGA database where mRNA level of AREG significantly differs between astrocytoma grades and tumours of high AREG expression are significantly associated with worse patient survival [5,6]. Also, some other studies indicated AREG mRNA level as important prognostic biomarker [13,18,28,29,34,44]. A number of data including present research indicates that AREG is important player in tumorigenesis and has promising capabilities as a biomarker for patient survival prognostication and diagnostics.
Conclusions
The analysis of molecular properties of amphiregulin in astrocytoma tissue have shown that AREG plays a role in astrocytoma pathogenesis and this indicates the direction for future research of AREG as a tumorigenic factor and promising biomarker in astrocytomas.
Acknowledgements
We kindly thank to Ms. Ruta Sinceviciute for the help in methylation research. We also heartily thank Ms. Jūratė Žeglienė for assistance in tissue sampling and patient clinical data gathering.
Funding
This work was funded by grants (No. MIP-052/ 2015) and (No. LIG‐12003) from the Research Council of Lithuania.
Authors' contributions
G.S., D.S., A.K., P.V. generated the idea. G.S. performed computational and statistical analysis of the data. G.S., P.V., D.S., A.K. performed experiments. G.S. wrote the manuscript. A.T. and K.S. coordinated postoperative patient sample acquisition.
Ethics Committee Approval and Patient Consent
Patient tissues were collected following written informed consent after approval of the Ethics Committee for Biomedical Research of the Lithuanian University of Health Sciences (LUHS) P2-9/2003. The study was performed in accordance with the principles of the Declaration of Helsinki.
Competing Interests
The authors have declared that no competing interest exists.
References
1. Schwartzbaum JA, Fisher JL, Aldape KD, Wrensch M. Epidemiology and molecular pathology of glioma. Nat Clin Pract Neurol. 2006;2(9):494-503
2. Louis DN, Ohgaki H, Wiestler OD, Cavenee WK, Burger PC, Jouvet A. et al. The 2007 WHO classification of tumours of the central nervous system. Acta Neuropathol. 2007;114(2):97-109
3. Berasain C, Avila MA. Amphiregulin. Semin Cell Dev Biol. 2014;28:31-41
4. Hayden EC. Genomics boosts brain-cancer work. Nature. 2010;463(7279):278-278
5. The Cancer Genome Atlas - Data Portal. Available at:. https://tcga-data.nci.nih.gov/docs/publications/tcga/?
6. GlioVis - Visualization Tools for Glioma Datasets. Available at:. http://gliovis.bioinfo.cnio.es/
7. Busser B, Sancey L, Brambilla E, Coll J-L, Hurbin A. The multiple roles of amphiregulin in human cancer. Biochim Biophys Acta. 2011;1816(2):119-31
8. Levano KS, Kenny PA. Clarification of the C-terminal proteolytic processing site of human Amphiregulin. FEBS Lett. 2012;586(19):3500-2
9. Sahin U, Weskamp G, Kelly K, Zhou H-M, Higashiyama S, Peschon J. et al. Distinct roles for ADAM10 and ADAM17 in ectodomain shedding of six EGFR ligands. J Cell Biol. 2004;164(5):769-79
10. Avila MA, Berasain C. Amphiregulin. Schwab M. (eds) Encyclopedia of Cancer Springer Berlin Heidelberg, Berlin, Heidelberg, pp1-4
11. Busser B, Coll J-L, Hurbin A. The increasing role of amphiregulin in non-small cell lung cancer. Pathol Biol. 2009;57(7-8):511-512
12. Cook PW, Pittelkow MR, Keeble WW, Graves-Deal R, Coffey RJ, Shipley GD. Amphiregulin messenger RNA is elevated in psoriatic epidermis and gastrointestinal carcinomas. Cancer Res. 1992;52(11):3224-7
13. Ohchi T, Akagi Y, Kinugasa T, Kakuma T, Kawahara A, Sasatomi T. et al. Amphiregulin is a prognostic factor in colorectal cancer. Anticancer Res. 2012;32(6):2315-21
14. Tun MT, Pai RK, Kwok S, Dong A, Gupta A, Visser BC. et al. Diagnostic accuracy of cyst fluid amphiregulin in pancreatic cysts. BMC Gastroenterol. 2012;12:15
15. Peterson EA, Jenkins EC, Lofgren KA, Chandiramani N, Liu H, Aranda E. et al. Amphiregulin Is a Critical Downstream Effector of Estrogen Signaling in ERα-Positive Breast Cancer. Cancer Res. 2015;75(22):4830-8
16. Bostwick DG, Qian J, Maihle NJ. Amphiregulin expression in prostatic intraepithelial neoplasia and adenocarcinoma: a study of 93 cases. Prostate. 2004;58(2):164-8
17. Amsellem-Ouazana D, Bièche I, Tozlu S, Botto H, Debré B, Lidereau R. Gene Expression Profiling of ERBB Receptors and Ligands in Human Transitional Cell Carcinoma of the Bladder. J Urol. 2006;175(3):1127-1132
18. Han S, Bai E, Jin G, He C, Guo X, Wang L. et al. Expression and clinical significance of YAP, TAZ, and AREG in hepatocellular carcinoma. J Immunol Res. 2014;2014:261365
19. Hanahan D, Weinberg RA. Hallmarks of cancer: the next generation. Cell. 2011;144(5):646-74
20. Addison CL, Ding K, Zhao H, Le Maître A, Goss GD, Seymour L. et al. Plasma transforming growth factor alpha and amphiregulin protein levels in NCIC Clinical Trials Group BR.21. J Clin Oncol. 2010;28(36):5247-56
21. Ishikawa N, Daigo Y, Takano A, Taniwaki M, Kato T, Hayama S. et al. Increases of amphiregulin and transforming growth factor-alpha in serum as predictors of poor response to gefitinib among patients with advanced non-small cell lung cancers. Cancer Res. 2005;65(20):9176-84
22. Steponaitis G, Skiriutė D, Kazlauskas A, Golubickaitė I, Stakaitis R, Tamašauskas A, Vaitkienė P. High CHI3L1 expression is associated with glioma patient survival. Diagn Pathol. 2016;11:42
23. Steponaitis G, Kazlauskas A, Skiriute D, Valiulyte I, Skauminas K, Tamasauskas A, Vaitkiene P. Testin (TES) as a candidate tumour suppressor and prognostic marker in human astrocytoma. Oncol Lett. 2016;12(5):3305-3311
24. Li L-C, Dahiya R. MethPrimer: designing primers for methylation PCRs. Bioinformatics. 2002;18(11):1427-31
25. Arányi T, Váradi A, Simon I, Tusnády GE. The BiSearch web server. BMC Bioinformatics. 2006;7:431
26. Brown CL, Meise KS, Plowman GD, Coffey RJ, Dempsey PJ. Cell surface ectodomain cleavage of human amphiregulin precursor is sensitive to a metalloprotease inhibitor: Release of a predominant N- glycosylated 43-kDa soluble form. J Biol Chem. 1998;273(27):17258-17268
27. Sebio A, Páez D, Salazar J, Berenguer-Llergo A, Paré-Brunet L, Lasa A. et al. Intergenic polymorphisms in the amphiregulin gene region as biomarkers in metastatic colorectal cancer patients treated with anti-EGFR plus irinotecan. Pharmacogenomics J. 2014;14(3):256-62
28. Wang L, Wu H, Wang L, Lu J, Duan H, Liu X, Liang Z. Expression of amphiregulin predicts poor outcome in patients with pancreatic ductal adenocarcinoma. Diagn Pathol. 2016;11(1):60
29. Jing C, Jin YH, You Z, Qiong Q, Jun Z. Prognostic value of amphiregulin and epiregulin mRNA expression in metastatic colorectal cancer patients. Oncotarget. 2016
30. Lee MS, McGuffey EJ, Morris JS, Manyam G, Baladandayuthapani V, Wei W. et al. Association of CpG island methylator phenotype and EREG/AREG methylation and expression in colorectal cancer. Br J Cancer. 2016;114(12):1352-61
31. Laffaire J, Everhard S, Idbaih A, Crinière E, Marie Y, de Reyniès A. et al. Methylation profiling identifies 2 groups of gliomas according to their tumourigenesis. Neuro Oncol. 2011;13(1):84-98
32. Skiriute D, Vaitkiene P, Ašmoniene V, Steponaitis G, Deltuva VP, Tamašauskas A. Promoter methylation of AREG, HOXA11, hMLH1, NDRG2, NPTX2 and Tes genes in glioblastoma. J Neurooncol. 2013;113(3):441-449
33. Pathak P, Kumar A, Jha P, Purkait S, Faruq M, Suri A. et al. Genetic alterations related to BRAF-FGFR genes and dysregulated MAPK/ERK/mTOR signaling in adult pilocytic astrocytoma. Brain Pathol. 2016
34. Shinomiya H, Ito Y, Kubo M, Yonezawa K, Otsuki N, Iwae S. et al. Expression of amphiregulin in mucoepidermoid carcinoma of the major salivary glands: a molecular and clinicopathological study. Hum Pathol. 2016;57:37-44
35. Mallakin A, Sugiyama T, Kai F, Taneja P, Kendig RD, Frazier DP. et al. The Arf-inducing transcription factor Dmp1 encodes a transcriptional activator of amphiregulin, thrombospondin-1, JunB and Egr1. Int J cancer. 2010;126(6):1403-16
36. The Human Protein Atlas. Expression of ADAM17 in cancer. Available at: https://. www.proteinatlas.org/ENSG00000151694-ADAM17/
37. Wu B, Sha L, Wang Y, Xu W, Yu Y, Feng F. et al. Diagnostic and prognostic value of a disintegrin and metalloproteinase-17 in patients with gliomas. Oncol Lett. 2014;8(6):2616-2620
38. Quail DF, Joyce JA. Microenvironmental regulation of tumour progression and metastasis. Nat Med. 2013;19(11):1423-37
39. Normanno N, Kim N, Wen D, Smith K, Harris AL, Plowman G. et al. Expression of messenger RNA for amphiregulin, heregulin, and cripto-1, three new members of the epidermal growth factor family, in human breast carcinomas. Breast Cancer Res Treat. 1995;35(3):293-7
40. Castillo J, Erroba E, Perugorría MJ, Santamaría M, Lee DC, Prieto J. et al. Amphiregulin contributes to the transformed phenotype of human hepatocellular carcinoma cells. Cancer Res. 2006;66(12):6129-38
41. Hansel DE, Rahman A, Hidalgo M, Thuluvath PJ, Lillemoe KD, Shulick R. et al. Identification of novel cellular targets in biliary tract cancers using global gene expression technology. Am J Pathol. 2003;163(1):217-29
42. Wang S, Zhang Y, Wang Y, Ye P, Li J, Li H. et al. Amphiregulin Confers Regulatory T Cell Suppressive Function and Tumour Invasion via the EGFR/GSK-3β/Foxp3 Axis. J Biol Chem. 2016
43. Jacobs B, De Roock W, Piessevaux H, Van Oirbeek R, Biesmans B, De Schutter J. et al. Amphiregulin and epiregulin mRNA expression in primary tumours predicts outcome in metastatic colorectal cancer treated with cetuximab. J Clin Oncol. 2009;27(30):5068-74
44. Li X-D, Miao S-Y, Wang G-L, Yang L, Shu Y-Q, Yin Y-M. Amphiregulin and epiregulin expression in colorectal carcinoma and the correlation with clinicopathological characteristics. Onkologie. 2010;33(7):353-8
Author contact
![]() Corresponding author: Giedrius Steponaitis, Laboratory of Molecular Neurooncology, Neuroscience Institute, Lithuanian University of Health Sciences, Eivenių str. 4, LT-50161, Kaunas, Lithuania. E-mail: giedrius.steponaitislt; workplace phone: +370 37 302968; Mob. phone: +37062263339
Corresponding author: Giedrius Steponaitis, Laboratory of Molecular Neurooncology, Neuroscience Institute, Lithuanian University of Health Sciences, Eivenių str. 4, LT-50161, Kaunas, Lithuania. E-mail: giedrius.steponaitislt; workplace phone: +370 37 302968; Mob. phone: +37062263339
Citation styles
APA
Steponaitis, G., Kazlauskas, A., Skiriute, D., Vaitkiene, P., Skauminas, K., Tamasauskas, A. (2019). Significance of Amphiregulin (AREG) for the Outcome of Low and High Grade Astrocytoma Patients. Journal of Cancer, 10(6), 1479-1488. https://doi.org/10.7150/jca.29282.
ACS
Steponaitis, G.; Kazlauskas, A.; Skiriute, D.; Vaitkiene, P.; Skauminas, K.; Tamasauskas, A. Significance of Amphiregulin (AREG) for the Outcome of Low and High Grade Astrocytoma Patients. J. Cancer 2019, 10 (6), 1479-1488. DOI: 10.7150/jca.29282.
NLM
Steponaitis G, Kazlauskas A, Skiriute D, Vaitkiene P, Skauminas K, Tamasauskas A. Significance of Amphiregulin (AREG) for the Outcome of Low and High Grade Astrocytoma Patients. J Cancer 2019; 10(6):1479-1488. doi:10.7150/jca.29282. https://www.jcancer.org/v10p1479.htm
CSE
Steponaitis G, Kazlauskas A, Skiriute D, Vaitkiene P, Skauminas K, Tamasauskas A. 2019. Significance of Amphiregulin (AREG) for the Outcome of Low and High Grade Astrocytoma Patients. J Cancer. 10(6):1479-1488.
This is an open access article distributed under the terms of the Creative Commons Attribution (CC BY-NC) license (https://creativecommons.org/licenses/by-nc/4.0/). See http://ivyspring.com/terms for full terms and conditions.