Journal of Cancer
ISSN: 1837-9664
3.2
Impact Factor
ISSN: 1837-9664

 Global reach, higher impact
J Cancer 2019; 10(7):1707-1716. doi:10.7150/jca.28605 This issue Cite
Research Paper
Prognostic Value of MTV, SUVmax and the T/N Ratio of PET/CT in Patients with Glioma: A Systematic Review and Meta-Analysis
Qing Zhang1*, Xian Gao2*, Guohua Wei3*, Cheng Qiu4, Hongyi Qu1 ![]() , Xin Zhou2
, Xin Zhou2 ![]()
1. Department of Neurosurgery, Xinghua People's Hospital, Xinghua 225700, Jiangsu, P.R. China.
2. Department of Oncology, First Affiliated Hospital of Nanjing Medical University, Nanjing 210029, China.
3. Department of Anesthesiology, First Affiliated Hospital of Nanjing Medical University, Nanjing 210029, China.
4. Department of Neurosurgery, Second Affiliated Hospital of Nanjing Medical University, Nanjing 210000, Jiangsu, P.R. China.
*These authors contributed equally to this work.
Received 2018-7-18; Accepted 2019-1-13; Published 2019-4-5
Citation:
Zhang Q, Gao X, Wei G, Qiu C, Qu H, Zhou X. Prognostic Value of MTV, SUVmax and the T/N Ratio of PET/CT in Patients with Glioma: A Systematic Review and Meta-Analysis. J Cancer 2019; 10(7):1707-1716. doi:10.7150/jca.28605. https://www.jcancer.org/v10p1707.htm
Other stylesAbstract
Background: In the past decade, positron emission tomography/computed tomography (PET/CT) has become an important imaging tool for clinical assessment of tumor patients. Our meta-analysis aimed to compare the predictive value of PET/CT parameters regard to overall survival (OS) and progression-free survival (PFS) outcomes in glioma.
Methods: Relevant articles were systematically searched in PMC, PubMed, EMBASE and WEB of science. Studies involving the prognostic roles of PET/CT parameters with OS and PFS in glioma patients were evaluated. The impact of metabolic tumor volume (MTV), maximal standard uptake value (SUVmax), and the ratio of uptake in tumor to normal (T/N ratio) on survival was measured by calculating combined hazard ratios (HRs) and 95% confidence intervals (CIs).
Results: A total of 32 articles with 1715 patients were included. The combined HRs of higher MTV, higher SUVmax and higher T/N ratio for OS were 1.14 (95% CI: 0.98-1.32, P heterogeneity<0.001), 1.69 (95% CI: 1.18-2.41, P heterogeneity<0.001) and 1.68 (95% CI: 1.40-2.01, P heterogeneity< 0.001), respectively. Regarding PFS, the combined HRs were 1.04 (95% CI: 0.97-1.11, P heterogeneity=0.002) with higher MTV, 1.45 (95% CI: 1.11-1.90, P heterogeneity<0.001) with higher SUVmax and 2.07 (95% CI: 1.45-2.95, P heterogeneity<0.001) with higher T/N ratio. Results remained similar in the sub-group analyses.
Conclusion: PET/CT parameters T/N ratio may be a significant prognostic factor in patients with glioma. Evidence of SUVmax and MTV needed more large-scale studies performed to validate. PET/CT scan could be a promising technique to provide prognostic information for these patients.
Keywords: PET/CT, MTV, SUVmax, T/N ratio, glioma, survival
Introduction
Intracranial space-occupying neoplasms can be categorized into two main groups: primary tumors and metastatic lesions. Glioma, originating from glial cells, is the most common type, which accounts for almost 80 % of all malignant primary intracranial neoplasms. It has a relatively high incidence of approximately 4-5/100000 population per year, with a peak incidence at the sixth decade of life [1, 2]. Glioma was classified into 4 histological grades by the World Health Organization (WHO) [3]. Grade I and II lesions were considered non-invasive, while grade III and IV correspond to invasive tumors with poor clinical prognosis [4]. Current management of glioma consists of surgical excision, radiotherapy and chemotherapyeutic drugs like temozolomide (TMZ), nitrosoureas and bevacizumab [5-7]. Despite the development of above treatment modalities, the outcome of glioma patients still remained unpredictable and unsatisfying. The highest grade glioma, glioblastoma, was reported to have a rapid progression of deterioration, whose median overall survival (OS) was merely 14-16 months after diagnosis [8]. Hence, a favorable prognosis of glioma depends on precise diagnosis at early time, effectively individual treatments and valid biomarkers to predict it.
The gold standard diagnosis requires pathological examination. However, biopsy or resection from brain tissue usually cause inevitable lesion. During present clinical practice, noninvasive tools such as computed tomography (CT) and magnetic resonance imaging (MRI) with contrast-enhancing agents were supposed as the first diagnostic procedures for patients with suspected cerebral neoplasms [9]. But these two technique measures have limited values in assessment of biological activity, invasion capacity or potential metastatic process of tumors.
Of late, positron emission tomography/ computed tomography (PET/CT), which can potentially address the above-mentioned drawbacks, has gained a lot of attention. It provides additional insight based on functional molecular imaging and features using diverse tracers to visualize biological processes like cell proliferation, membrane biosynthesis, hypoxic metabolism, glucose consumption and expression of amino acid or nucleic acid transporters in vivo [10]. At present, radiolabeled glucose (18F-fluorodeoxyglucose, 18F-FDG) and amino acids (11C-methionine, 11C- MET; 18F-fluoroethyltyrosine, 18F-FET; 3,4-dihydroxy- 6-18F-fluoro-l-phenylalanine, 18F-FDOPA and α-11C- methyl-tryptophan, AMT) are the most clinically utilized radiopharmaceuticals to detect both primary and recurrent brain tumors [11-15]. Choline analogues (18F-fluoromethylcholine, 18F-FCho and 11C-Choline), thymidine analogues (3′-deoxy-3′-18F-fluorothymidine, 18F-FLT and 4′-Methyl-11C-thiothymidine, 11C-4DST) and nitroimidazole derivatives (18F-fluoromisonidazole, 18F-FMISO, which exclusively trapped in cells with low oxygen concentration and used for hypoxic imaging) also appeared to be successfully novel neuro-oncological PET tracers [16-19].
The potential function of PET/CT scan in oncology is well documented. Besides prognosis of tumor burden, the imaging modality can be even more useful in planning radiation therapy (RT), evaluating treatment-related response and surveilling recurrence or metastasis [20]. As popularity of PET/CT technology, increasingly clinical researches were conducted to explore imaging biomarkers capable of predicting survival. Previous studies have already demonstrated some PET-derived quantitative parameters have predictive capability in nasopharyngeal carcinoma, pancreatic carcinoma, lymphoma, non-small cell lung cancer (NSCLC) and some other cancers [21-27]. Given no consensus about the prognostic value of maximum standardized uptake value (SUVmax), metabolic tumor volume (MTV) and the ratio of uptake in tumor to normal (T/N ratio) parameters of PET/CT in glioma patients, we conducted a meta-analysis to assess whether these parameters play positive roles in predicting survival in glioma.
Material and Methods
Literature search
We carefully searched PMC, PubMed, EMBASE and WEB of science to collect potentially relevant published articles about the assessment of PET/CT in prognosis of glioma. Medical subheading (Mesh) terms relating to glioma (e.g. “glioma,” “glioblastoma” or “brain tumor”) in combination with words related to PET (e.g. “PET,” “FDG,” “FET,” “FLT,” “MET,” “DOPA” or “positron emission tomography”) and terms to prognosis (e.g. “prognosis,” “survival”, “outcome” or “prognostic”) were used to retrieve eligible studies for our analyses until September 2018. Furthermore, the references of literatures which may contain additional potentially relevant studies were also examined.
Studies were considered eligible if they met the following criteria: (a) included cancer patients who were pathologically proven glioma; (b) patients who received PET scan tests; (c) investigated the association between the parameters of PET and overall survival (OS) or progression-free survival (PFS); (d) were published as a full paper in English.
Studies were excluded based on the following criteria: (a) patients with brain metastasis due to other sites malignant tumors and non-glioma primary brain tumors; (b) studies which reveal duplicate data or repeated analysis; (c) lack of key information provided by investigators for further analysis; (d) non-human research.
Data extraction
Main information was evaluated and extracted from included studies by two independent investigators under the guidelines of a critical review checklist of the Dutch Cochrane Centre proposed by Meta-analysis of Observational Studies in Epidemiology (MOOSE) [28]. For each selected publication, we recorded the following information: first author, year of publication, country of origin, ethnicity, total number of participants, histological grade, type of PET scan, cut-off value, hazard ratios (HRs) of PET parameters for OS and PFS with their 95% confidence interval (CIs) and P values. In cases where data was not available, we extracted the HR and 95% CIs indirectly by calculating the associated statistical data such as number of events, number at risk, P values of the log-rank test and 95% CIs according to the methods published by Parmar MK et al. [29]. For discrepancies at the patient level between the two investigators, we invited another investigator to participate in discussion until consensus achieved in interpretation of results.
Statistical analysis
HRs with their 95% CIs obtained from studies were used to calculate combined HRs. Cochran's Q test and the Higgins I-squared statistic were applied to investigate the heterogeneity of combined results. If the result of the Q-test revealed P heterogeneity<0.05 and I²>50%, suggesting the existence of significant heterogeneity in our analysis, then the random-effect model (DerSimonian-Laird method) was applied to calculate the combined HR [30]. Otherwise, a fixed-effect model (the Mantel-Haenszel method) was applied [31]. Potential heterogeneity among studies were detected by conducting stratification and meta- regression analyses. Publication bias was detected by performing the Begg's funnel plot and Egger's linear regression test with a p<0.05 representing significant [32]. The Trim and fill method was used to assess potential asymmetry in the funnel plot. All reported p-values are two-sided. All above calculations were performed on the STATA software, version 16.0 (STATA Corporation, College Station, TX, USA).
Results
Study characteristics
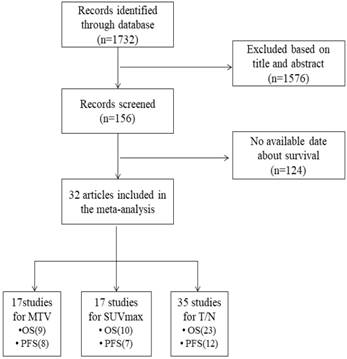
The electronic and manual searches output 1732 potentially eligible articles from above databases. After applying the inclusion and exclusion criteria in titles and abstracts, 156 articles remained. Excluding 124 articles without extractable patients' survival data, a total of 32 articles which reported the prognostic information about PET/CT quantization parameters (SUVmax, MTV or the T/N ratio) in glioma patients were included in our meta-analysis. The study screening procedure and reasons for exclusion are summarized in Figure 1.
Among 32 articles enrolled in our study, 17 studies dealt with the prognostic value of MTV with 9 [33-41] for OS and 8 [34, 38-44] for PFS; 17 studies dealt with the predictive capacity of SUVmax with 10 [33, 34, 45-51] for OS and 7 [34, 43, 45, 49, 51, 52] for PFS. Only 1 study [53] for T/CL (ratio of the tumor to contralateral SUVmax), 1 study [54] for G/C (ratio of a glioma to the contralateral cortex), 2 studies [51, 55] evaluated the diagnostic ability for T/B (ratio of maximal activity to the metabolically active biological tumor volume), 4 [36, 38, 40, 41] for TNR (tumor-to- normal region ratio) and 3 [34, 56, 57] for SUVmax/BG (ratio of SUVmax to background activity in the contralateral hemisphere). Considering definitions of these five indicators (T/CL, G/C, T/CL, TNR, SUVmax/BG) had analogous summarization with T/N ratio, we eliminated difference of terminology among studies and combined these parameters as T/N ratio. Thus, 35 studies evaluated T/N ratio with 23 studies [34-38, 40, 41, 45, 48, 50, 51, 53-62] for OS and 12 studies [34, 38, 41-45, 51, 55, 63, 64] for PFS were analyzed in our meta-analysis. Moreover, the eligible articles authored by Takuya Toyonaga [40] and Akira Toriihara [51] both investigated two different types of PET/CT so that we regarded each article as two studies. In our meta-analysis, different types of PET scanner listed as follows: FDG-PET, 18F-FET-PET, 18F-DOPA-PET, 11C-MET-PET, 11C-Choline-PET, FMISO-PET, FLT-PET, AMT-PET and 62Cu-ATSM-PET. Thirteen articles enrolled patients with high-grade glioma (grade III-IV). Ethnicity background of patients was classified as Caucasian or Asian and number of patients ranged from 14 to 152. Main characteristics of the 32 articles are described in Table 1.
Predictive value of MTV, SUVmax and T/N ratio for OS
The combined HR for studies evaluated MTV for OS was 1.14 (95% CI: 0.98-1.32, P heterogeneity< 0.001). Meanwhile, the prognostic role of SUVmax and T/N ratio was similar with combined HR of 1.69 (95% CI: 1.18-2.41, P heterogeneity<0.001) and 1.68 (95% CI: 1.40-2.01, P heterogeneity<0.001, Figure 2), separately.
Among eligible studies of SUVmax for OS, subgroup analysis was performed in relation to data resource. The results showed that data extracted from univariate analysis had a significant HR of 1.11 (95% CI: 1.01-1.21, P heterogeneity=0.091), while multivariate analysis data had an HR of 2.18 (95% CI: 0.91-5.22, P heterogeneity=0.005).
As for T/N ratio, we conducted subgroup analyses by cut-off value, ethnicity, histological grade, types of PET and data resource. Based on the median cut-off value (1.8), the cohorts were divided into the high value and low value groups. The results indicated that the HRs for T/N ratio were 1.34 (95% CI: 1.12-1.60, P heterogeneity=0.001) and 3.44 (95% CI: 1.94-6.12, P heterogeneity<0.001) for high and low cut-off value group, respectively. Dealing with different ethnicities, high T/N ratio was a significantly prognostic marker for not only Caucasian patients (HR=1.62, 95% CI: 1.28-2.05, P heterogeneity<0.001) but also Asian patients (HR=2.25, 95% CI: 1.46-3.47, P heterogeneity=0.007). When performing subgroup analyses stratified by number of participants (since mean number was 56, studies with more than 56 participants were classified as “large” and studies with less than 56 patients were classified as “small”), we found that high T/N ratio predicted unfavorable survival regardless of large (HR=1.33, 95% CI: 1.12-1.58, P heterogeneity<0.001) or small sample size (HR=2.64, 95% CI: 1.81-3.87, P heterogeneity=0.041). Also, subgroup analyses by PET type revealed that FDG-PET (HR=3.05, 95% CI: 2.10-4.42, P heterogeneity=0.714), 18F-FET-PET (HR=1.15, 95% CI: 1.07-1.23, P heterogeneity=0.112) and 11C-MET-PET (HR=1.59, 95% CI: 1.36-1.86, P heterogeneity=0.385) could indicate poor OS. Data from univariate (HR=1.21, 95% CI: 1.07-1.36, P heterogeneity =0.389) and multivariate analysis (HR=2.13, 95% CI: 1.62-2.79, P heterogeneity<0.001) both revealed unfavorable OS. Finally, high T/N ratio was significantly related with lower survival rates in glioma patients with high-grade (III-IV; HR=1.56, 95% CI=1.27-1.92, P heterogeneity=0.001) and other mixed grade (HR= 2.12, 95% CI: 1.42-3.16, P heterogeneity<0.001). Main results of subgroup analysis are shown in Table 2.
Figure 1
Flowchart for the study selection process.
Table 1
Main characteristics of the studies included in this meta-analysis.
| Author | Year | Country | Number | Grade | Types | Ethnicity | Cut-off value | ||
|---|---|---|---|---|---|---|---|---|---|
| MTV | SUVmax | T/N ratio | |||||||
| Ce´cile Colavolpe | 2011 | France | 41 | III-IV | FDG-PET | Caucasian | NR | NR | 1.2 |
| Albert J.S. Idema | 2012 | Netherlands | 26 | III-IV | FLT-PET | Caucasian | NR | NR | NR |
| Ce´cile Colavolpe | 2012 | France | 25 | III-IV | FDG-PET | Caucasian | NR | 7 | 1.348 |
| Sellam Karunanithi | 2013 | India | 33 | I-IV | 18F-FDOPA-PET | Asian | NR | NR | 1.51 |
| Nathalie L. Jansen | 2013 | Germany | 59 | II | 18F-FET-PET | Caucasian | NR | NR | NR |
| Reinhart Sweeney | 2013 | Germany | 28 | II-IV | 18F-FET-PET | Caucasian | NR | 2.6 | NR |
| Niklas Thon | 2014 | Germany | 98 | II-IV | 18F-FET-PET | Caucasian | NR | 2.3 | NR |
| Wanhu Li | 2014 | China | 16 | III-IV | 11C-Choline-PET | Asian | NR | 0.995 | 1.42 |
| David O. Kamson | 2014 | USA | 39 | III-IV | AMT-PET | Caucasian | NR | 4.62 | NR |
| Johannes Schwarzenberg | 2014 | USA | 30 | III-IV | 18F-FDOPA-PET | Caucasian | 18 | NR | NR |
| Nathalie L. Jansen | 2014 | Germany | 121 | III-IV | 18F-FET-PET | Caucasian | NR | NR | 1.8 |
| Fen Zhao | 2014 | China | 56 | III-IV | 18F-FET-PET | Asian | NR | NR | 10.94 |
| Jens Gempt | 2015 | Germany | 152 | II-IV | 18F-FET-PET | Caucasian | NR | NR | 1.6/3 |
| Min Young Yoo | 2015 | Korea | 30 | III-IV | 11C-MET-PET | Asian | 35 | NR | 3.3 |
| Kentaro Kobayashi | 2015 | Japan | 33 | II-IV | 11C-MET-PET | Asian | 59.95 | NR | 3.42 |
| Thomas Pyka | 2015 | Germany | 113 | III-IV | 18F-FET-PET | Caucasian | 19.7 | NR | 2.74 |
| Carlos Leiva-Salinas | 2016 | USA | 56 | IV | FDG-PET | Caucasian | NR | NR | 2 |
| Takuya Toyonaga | 2016 | Japan | 32 | IV | FMISO-PET/FDG-PET | Asian | 15.01/15.01 | NR | 4.19/1.42 |
| Gloria C. Chiang | 2016 | USA | 44 | IV | FDG-PET | Caucasian | NR | NR | NR |
| Katsuya Mitamura | 2016 | Japan | 36 | II-IV | FLT-PET | Asian | NR | NR | NR |
| Soren Moller | 2016 | Denmark | 31 | III-IV | 18F-FET-PET | Caucasian | NR | NR | NR |
| Tae-Young Jung | 2016 | Korea | 35 | III-IV | 11C-MET-PET | Asian | 60 | NR | 2.8 |
| Takano K | 2016 | Japan | 35 | II-III | 11C-MET-PET | Asian | NR | NR | 2 |
| Nina Poetsch | 2017 | Austria | 142 | II-IV | 11C-MET-PET | Caucasian | NR | NR | 2.4 |
| Egesta Lopci | 2017 | Italy | 109 | I-IV | 11C-MET-PET | Caucasian | NR | 3.5 | NR |
| Giovanni Morana | 2017 | Italy | 18 | II-IV | 18F-DOPA-PET | Caucasian | NR | NR | 1.53 |
| Comron Hassanzadeh | 2017 | USA | 30 | IV | FDG-PET | Caucasian | NR | NR | 1.5 |
| Charlotte Debus | 2018 | Germany | 14 | IV | 18F-FET-PET | Caucasian | NR | NR | 2.92 |
| Dongwoo Kim | 2018 | Korea | 59 | II-IV | FDG-PET | Asian | NR | NR | 0.8 |
| Soyoung Kim | 2018 | Korea | 73 | II-IV | 11C-MET-PET | Asian | 1.0 | NR | 1.6 |
| Chirag B. Patel | 2018 | USA | 45 | I-IV | 18F-DOPA-PET | Caucasian | NR | NR | 1.7 |
| Akira Toriihara | 2018 | Japan | 56 | II-IV | 62Cu-ATSM-PET/FDG-PET | Asian | NR | 1.3/1.5/4.1/6.8 | 1.6/1.8/2.0/2.1 |
MTV: metabolic tumor volume; SUVmax: maximum standardized uptake value; T/N ratio: ratio of uptake in tumor to normal; NR: not reported.
Table 2
Meta-analysis results.
| Outcome | Parameters | Variables | Study Number | Model | HR (95%CI) | P heterogeneity |
|---|---|---|---|---|---|---|
| OS | MTV | All | 9 | Random | 1.14 (0.98,1.32) | <0.001 |
| SUV max | All | 10 | Random | 1.69 (1.18,2.41) | <0.001 | |
| Resource | ||||||
| Univariate | 4 | Fixed | 1.11 (1.01,1.21) | 0.091 | ||
| Multivariate | 6 | Random | 2.18 (0.91,5.22) | 0.005 | ||
| T/N ratio | All | 23 | Random | 1.68 (1.40,2.01) | <0.001 | |
| Cut-off value | ||||||
| Low | 11 | Random | 3.44 (1.94,6.12) | <0.001 | ||
| High | 10 | Random | 1.34 (1.12,1.60) | 0.001 | ||
| Ethnicity | ||||||
| Caucasian | 11 | Random | 1.62 (1.28,2.05) | <0.001 | ||
| Asian | 12 | Random | 2.25 (1.46,3.47) | 0.007 | ||
| Grade | ||||||
| High | 13 | Random | 1.56 (1.27,1.92) | 0.001 | ||
| Mixed | 10 | Random | 2.12 (1.42,3.16) | <0.001 | ||
| Resource | ||||||
| Univariate | 8 | Fixed | 1.21 (1.07,1.36) | 0.389 | ||
| Multivariate | 15 | Random | 2.13 (1.62,2.79) | <0.001 | ||
| Number | ||||||
| Small | 13 | Random | 2.64 (1.81,3.87) | 0.041 | ||
| Large | 10 | Random | 1.33 (1.12,1.58) | <0.001 | ||
| Type of PET | ||||||
| FDG-PET | 7 | Fixed | 3.05 (2.10,4.42) | 0.714 | ||
| 18F-FET-PET | 6 | Fixed | 1.15 (1.07,1.23) | 0.112 | ||
| 11C-MET-PET | 4 | Fixed | 1.59 (1.36,1.86) | 0.385 | ||
| PFS | MTV | All | 8 | Random | 1.04 (0.97,1.11) | 0.002 |
| SUV max | All | 7 | Random | 1.45 (1.11,1.90) | <0.001 | |
| Resource | ||||||
| Univariate | 4 | Random | 1.16 (0.96,1.41) | 0.022 | ||
| Multivariate | 3 | Fixed | 3.15 (1.86,5.35) | 0.134 | ||
| T/N ratio | All | 12 | Random | 2.07 (1.45,2.95) | <0.001 | |
| Resource | ||||||
| Univariate | 8 | Random | 1.66 (1.14,2.42) | <0.001 | ||
| Multivariate | 4 | Fixed | 4.30 (2.53,7.33) | 0.991 |
Bold: with statistical significance; HR: hazard ratio; MTV: metabolic tumor volume; SUVmax: maximal standard uptake value; T/N ratio: ratio of uptake in tumor to normal; OS: overall survival; PFS: progression-free survival.
Figure 2
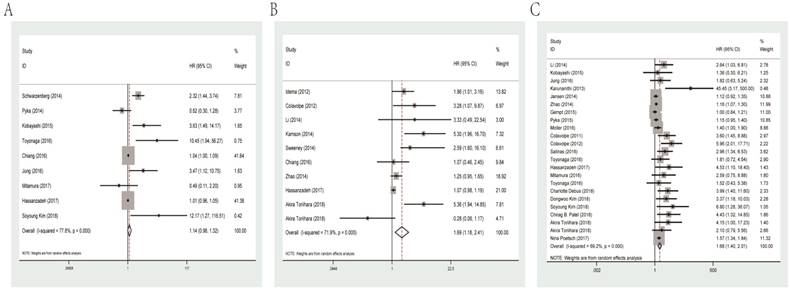
Forest plots of studies evaluating HRs of MTV (A), SUVmax (B) and the T/N ratio (C) for OS of glioma patients. HR: hazard ratio; MTV: metabolic tumor volume; SUVmax: maximal standard uptake value; T/N ratio: ratio of uptake in tumor to normal; OS: overall survival.
Predictive value of MTV, SUVmax and T/N ratio for PFS
For PFS of glioma patients, MTV (HR=1.04, 95% CI: 0.97-1.11, P heterogeneity=0.002) was not a significant indicator. While SUVmax and T/N ratio could act as meaningful predicators for PFS with combined HRs of 1.45 (95% CI: 1.11-1.90, P heterogeneity<0.001) and 2.07 (95% CI: 1.45-2.95, P heterogeneity<0.001), respectively. Forest plots of MTV, SUVmax and T/N ratio for PFS are shown in Figure 3.
Subgroup analysis was carried out by data resource for the meaningful parameter SUVmax and T/N ratio, evaluating that studies adopted univariate analysis had an HR of 1.16 (95% CI: 0.96-1.41, P heterogeneity=0.022) and multivariate analysis showed an HR of 3.15 (95% CI: 1.86-5.35, P heterogeneity=0.134) in terms of SUVmax. As for T/N ratio, it predicted an unfavorable prognosis for PFS regardless of univariate analysis (HR=1.66, 95% CI: 1.14-2.42, P heterogeneity<0.001) or multivariate analysis (HR=4.30, 95% CI: 2.53-7.33, P heterogeneity =0.991; Table 2).
Heterogeneity, Sensitivity analysis and Publication bias
Meta-regression was conducted with the following variables: year of publication, number of participants (large vs. small), ethnicity, histological grade, type of PET/CT, cut-off value and data resource (univariate vs. multivariate) to explore the potential source of heterogeneity among studies. The results showed that year of publication, ethnicity, histological grade, type of PET/CT and data resource did not contribute to the source of heterogeneity. However, number of participants (large vs. small) (P=0.031) and cut-off value (P=0.047) were exception which could explain most of the heterogeneity significantly.
To evaluate sensitivity, we sequentially removed each individual study to investigate their influence on the combined results of SUVmax for OS, SUVmax for PFS, the T/N ratio for OS and the T/N ratio for PFS (Figure 4). The combined HRs were found to be stable, suggesting no individual study significantly affected the results.
Figure 3
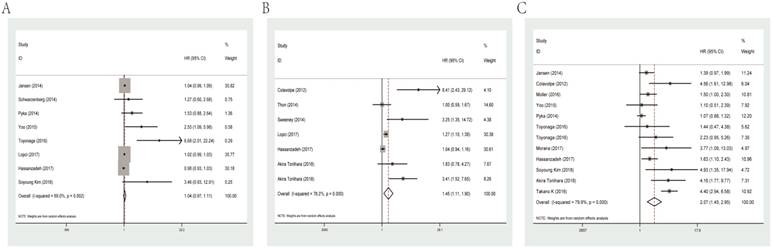
Forest plots of studies evaluating HRs of MTV (A), SUVmax (B) and the T/N ratio (C) for PFS of glioma patients. HR: hazard ratio; MTV: metabolic tumor volume; SUVmax: maximal standard uptake value; T/N ratio: ratio of uptake in tumor to normal; PFS: progression-free survival.
Figure 4
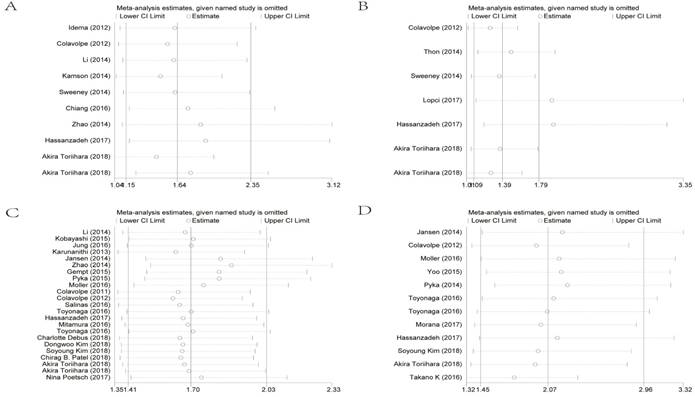
Effect of individual studies on the combined HR dealt with SUVmax for OS (A), SUVmax for PFS (B), the T/N ratio for OS (C) and the T/N ratio for PFS (D). HR: hazard ratio; SUVmax: maximal standard uptake value; T/N ratio: ratio of uptake in tumor to normal; OS: overall survival; PFS: progression-free survival.
Figure 5
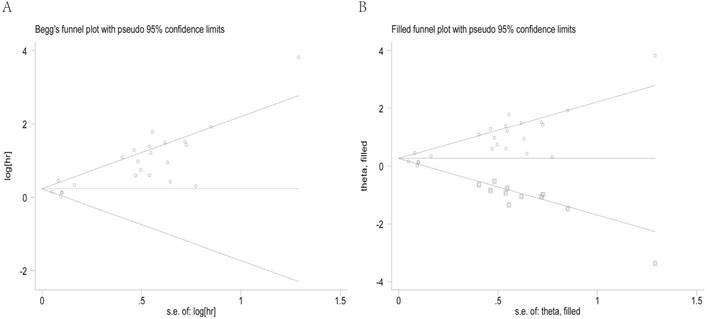
Begg's funnel plots for all of the included studies reported with the T/N ratio for OS (A). Funnel plot adjusted with trim and fill method for the T/N ratio for OS (B). Circles: included studies. Diamonds: presumed missing studies. T/N ratio: ratio of uptake in tumor to normal; OS: overall survival.
Begg's funnel plot and the Egger's linear regression test were used to assess publication bias. As shown in Figure 5A, the funnel plot was asymmetric with the P=0.113. The calculation of Egger's test for OS was P<0.001, revealing existence of bias. For further confirmation, a trim and fill method was conducted and the combined HR with hypothetically non-published studies was recalculated to evaluate the asymmetry (Figure 5B). However, the recalculated HR of 1.29 (95%CI: 1.07-1.56, P heterogeneity< 0.001) showed the indicative value of the T/N ratio for OS remained unchanged.
Discussion
PET/CT has developed to be an indispensable imaging technology which was widely used for tumor staging and evaluating clinical outcomes in recent years. Utilizing various radioactive tracers, PET scan was used to delineate areas of tumor based on their increased energy demand in the body, providing real-time information to detect the metabolic behavior of malignant glioma due to abnormal cellular needs [65]. Currently, accurate imaging biomarkers could predict response at an early time point after treatment initiation, enabling change or discontinuation of therapy to prevent ineffective treatment or adverse events of treatment [66]. Moreover, identification of therapeutic failure may help reduce medical resources and costs. Previous studies have reported that some common PET parameters might act as useful biomarkers for the prediction of OS and PFS in cancer patients. In this article, we performed a comprehensive meta-analysis to summarize the existing evidence of prognostic role of PET/CT in patients with malignant glioma.
In the present study, we analyzed data from 32 articles involving 1715 patients and provided some meaningful findings regarding the use of PET/CT for predicting survival of glioma patients. First, the T/N ratio was associated with poor prognosis for OS and PFS. Subgroup analyses revealed that unfavorable OS and PFS could be found in both univariate and multivariate analysis method regardless of participants number, ethnicity and histological grade of glioma. High or low cut-off value set for T/N ratio did not change the results. Sensitivity analyses and the recalculated HRs via trim and fill method mentioned above further verified our verdict. In terms of SUVmax, the combined data demonstrated its prognostic value for OS and PFS. But the HR of SUVmax evaluating OS by multivariate analysis method and the result evaluating PFS by univariate analysis method revealed to have no statistical significance in subgroup analyses, reducing the persuasive power to some extent. Even so, we should not negate the clinical performance of this parameter in prognostic judgment. Another important index MTV failed to predict outcomes according to our results, nevertheless, we did not allow a definitely negative conclusion on it due to limited research inclusion for the present analyses, thus remaining to be demonstrated in large-scale studies in the future.
The above results emphasized the superior performance of the T/N ratio than SUVmax and MTV in use of PET/CT imaging. Then we retrieved relevant paper trying to explain the consequence. Studies have revealed that the definition regions of interest (ROIs) meant the area of highest contrast agent uptake which showed signal intensity reflected by the morphologic characteristics of lesion [60]. SUVmax acted as a semi-quantitative metabolic parameter not only determined by ROI placed in the tumorous area of highest uptake but also recorded for the healthy cerebral cortex [67, 68]. In fact, radioactivity uptake of normal tissues may vary with each individual, which could lead to the differences in SUV value of tumor tissues with similar biological behavior. However, the index T/N was normalized by calculating the ratio of the tumor SUVmax and the contralateral normal cortex SUVmax, which efficiently excluded the interference of normal tissue in particular. Accordingly, T/N ratio might be more valuable in clinical prognosis when compared to SUVmax. Our analysis results further confirmed this finding. However, MTV (one article in our analysis also defined it as biologic tumor volume (BTV)) [42], was a parameter quantitating metabolic volume of tumor burden in contrast to SUVmax and T/N ratio. Recently, Kim YI et al. performed a meta-analysis of 11C-MET-PET confirmed that MTV as well as T/N ratio served as important predictors correlated with the eventual outcomes of glioma patients [69]. But we could not persist the prognostic value of these indices applicable to all types of PET/CT. After comprehensive analysis, our results of the parameter MTV showed no statistical significance. Based on evidence cited above, we speculated the T/N ratio for predicting clinical outcomes in glioma tended to be more credible than parameter SUVmax and MTV. Considering conflicting data existed in the present research, we expected more systematic evaluation conducted to validate our findings in the future.
Lately, several studies demonstrated that these metabolic and volumetric parameters were closely associated with the eventual outcomes of patients with glioma [69, 70]. Conducting the research work near-simultaneously, our research might provide more reliable results than these previous analyses because it contained a larger number of studies selected through strict inclusion criteria. In addition, we expanded the findings of previous narrative reviews by investigating different PET tracers and providing a quantitative overview of the prognostic accuracy of those PET scans. So far, the value of some tracers, such as radiolabeled glucose FDG and amino acid PET tracers 11C-MET as well as 18F-FET, has been evaluated with promising results in glioma patients in terms of tumor delineation, prognostication and the differentiation of tumor recurrence after adjuvant chemoradiotherapy. While novel promising glioma PET tracers like 18F-FLT and AMT are under investigation. In our research of T/N ratio for OS, including 7 studies for FDG-PET, 6 studies for 18F-FET-PET and 4 studies for 11C-MET-PET, whereas other 6 types of PET were all mentioned in each 1 study separately. After systematic analyses, we demonstrated that FDG-PET, 18F-FET-PET and 11C-MET-PET were closely correlated with poor OS, but could not validate the indicative capability of the remaining 6 PET types due to limited evidence. Remarkably, Vincent Dunet et al. once conducted a meta-analysis confirmed that even though both FDG-PET and 18F-FET-PET quantitative parameters allowed distinction between low and high-grade glioma, only T/N ratio on 18FET-PET has predictive capacity for the diagnosis of brain tumor and nontumorous lesions, but not FDG-PET [71]. Compared with our study outcomes, it showed inconsistent results in conclusion. That should be mentioned, we still need more convictive studies regarding comparisons between these two types of PET/CT or even among other different PET tracers in clinical trials for glioma.
Univariate meta-regression was carried out to explore the potential source of heterogeneity, indicating number of participants and cut off value could explain most of the heterogeneity among studies evaluating T/N ratio for OS. However, these types of heterogeneity were difficult to exclude since cut-off value was set by each researcher as recruitment of the same numeric value seemed difficult to enforce. Yet, we have attempted to accommodate various inclusion criteria to minimize differences among study populations, but some unreported or unmeasured patient characteristics, in part, prevented us from controlling the impact of heterogeneity from participants. These required studies including more participants from different backgrounds to explore the prognostic value of the T/N ratio. Meanwhile, publication bias was found in the meta-analysis and the recalculated HR by the trim and fill method showed statistical significance of the T/N ratio for OS which reconfirmed the prognostic role of high T/N ratio for patients' outcomes.
Several shortcomings in our analysis should be considered. First, the studies retrieved were limited in articles published in English, which might partially contribute to publication bias although the result did not change after recalculating by trim and fill method. Second, this research only included 1715 patients which might reduce the persuasive power of the results to some extent. Third, the clinical treatments are inevitable factors affecting the test results, since patients usually received different therapies (e.g. various chemotherapy schemes, the types of surgery or radiotherapy). Last but not the least, many included studies did not provide direct sufficient HRs so that we had to extrapolat from the survival curves which might result in certain inaccuracy.
Conclusion
The results of this meta-analysis confirmed that PET/CT parameter T/N ratio tended to be superior to SUVmax and MTV in predicting outcomes among glioma patients. Despite the publication bias observed across studies, the parameter could still provide useful information for survival time of patients with glioma and progression of the disease. Due to limited number of included trials in our analysis, future large-scale studies are necessary to validate our findings and explore more helpful prognostic variables associated with PET/CT images to enhance survival rate of glioma patients.
Acknowledgements
This work was supported by the National Natural Science Foundation of China [Grant number: 81702364] and the Natural Science Foundation of Jiangsu Province [Grant number: BK20171085].
Competing Interests
The authors have declared that no competing interest exists.
References
1. Stupp R, Brada M, van den Bent MJ, Tonn JC, Pentheroudakis G, Group EGW. High-grade glioma: ESMO Clinical Practice Guidelines for diagnosis, treatment and follow-up. Annals of oncology: official journal of the European Society for Medical Oncology. 2014;25(Suppl 3):iii93-101
2. Porter KR, McCarthy BJ, Freels S, Kim Y, Davis FG. Prevalence estimates for primary brain tumors in the United States by age, gender, behavior, and histology. Neuro-oncology. 2010;12:520-7
3. Louis DN, Ohgaki H, Wiestler OD, Cavenee WK, Burger PC, Jouvet A. et al. The 2007 WHO classification of tumours of the central nervous system. Acta neuropathologica. 2007;114:97-109
4. Goodenberger ML, Jenkins RB. Genetics of adult glioma. Cancer genetics. 2012;205:613-21
5. Anton K, Baehring JM, Mayer T. Glioblastoma multiforme: overview of current treatment and future perspectives. Hematology/oncology clinics of North America. 2012;26:825-53
6. de Vries NA, Beijnen JH, van Tellingen O. High-grade glioma mouse models and their applicability for preclinical testing. Cancer treatment reviews. 2009;35:714-23
7. Stupp R, Dietrich PY, Ostermann Kraljevic S, Pica A, Maillard I, Maeder P. et al. Promising survival for patients with newly diagnosed glioblastoma multiforme treated with concomitant radiation plus temozolomide followed by adjuvant temozolomide. Journal of clinical oncology: official journal of the American Society of Clinical Oncology. 2002;20:1375-82
8. Ostrom QT, Gittleman H, Liao P, Rouse C, Chen Y, Dowling J. et al. CBTRUS statistical report: primary brain and central nervous system tumors diagnosed in the United States in 2007-2011. Neuro-oncology. 2014;16(Suppl 4):iv1-63
9. Tsougos I, Svolos P, Kousi E, Fountas K, Theodorou K, Fezoulidis I. et al. Differentiation of glioblastoma multiforme from metastatic brain tumor using proton magnetic resonance spectroscopy, diffusion and perfusion metrics at 3 T. Cancer imaging: the official publication of the International Cancer Imaging Society. 2012;12:423-36
10. la Fougere C, Suchorska B, Bartenstein P, Kreth FW, Tonn JC. Molecular imaging of gliomas with PET: opportunities and limitations. Neuro-oncology. 2011;13:806-19
11. Alkonyi B, Barger GR, Mittal S, Muzik O, Chugani DC, Bahl G. et al. Accurate differentiation of recurrent gliomas from radiation injury by kinetic analysis of alpha-11C-methyl-L-tryptophan PET. Journal of nuclear medicine: official publication, Society of Nuclear Medicine. 2012;53:1058-64
12. Chen W, Silverman DH, Delaloye S, Czernin J, Kamdar N, Pope W. et al. 18F-FDOPA PET imaging of brain tumors: comparison study with 18F-FDG PET and evaluation of diagnostic accuracy. Journal of nuclear medicine: official publication, Society of Nuclear Medicine. 2006;47:904-11
13. Derlon JM, Bourdet C, Bustany P, Chatel M, Theron J, Darcel F. et al. [11C]L-methionine uptake in gliomas. Neurosurgery. 1989;25:720-8
14. Di Chiro G. Positron emission tomography using [18F] fluorodeoxyglucose in brain tumors. A powerful diagnostic and prognostic tool. Investigative radiology. 1987;22:360-71
15. Wester HJ, Herz M, Weber W, Heiss P, Senekowitsch-Schmidtke R, Schwaiger M. et al. Synthesis and radiopharmacology of O-(2-[18F]fluoroethyl)-L-tyrosine for tumor imaging. Journal of nuclear medicine: official publication, Society of Nuclear Medicine. 1999;40:205-12
16. Shields AF, Grierson JR, Dohmen BM, Machulla HJ, Stayanoff JC, Lawhorn-Crews JM. et al. Imaging proliferation in vivo with [F-18]FLT and positron emission tomography. Nature medicine. 1998;4:1334-6
17. Swanson KR, Chakraborty G, Wang CH, Rockne R, Harpold HL, Muzi M. et al. Complementary but distinct roles for MRI and 18F-fluoromisonidazole PET in the assessment of human glioblastomas. Journal of nuclear medicine: official publication, Society of Nuclear Medicine. 2009;50:36-44
18. Toyohara J, Okada M, Toramatsu C, Suzuki K, Irie T. Feasibility studies of 4'-[methyl-(11)C]thiothymidine as a tumor proliferation imaging agent in mice. Nuclear medicine and biology. 2008;35:67-74
19. Treglia G, Giovannini E, Di Franco D, Calcagni ML, Rufini V, Picchio M. et al. The role of positron emission tomography using carbon-11 and fluorine-18 choline in tumors other than prostate cancer: a systematic review. Annals of nuclear medicine. 2012;26:451-61
20. Albert NL, Weller M, Suchorska B, Galldiks N, Soffietti R, Kim MM. et al. Response Assessment in Neuro-Oncology working group and European Association for Neuro-Oncology recommendations for the clinical use of PET imaging in gliomas. Neuro-oncology. 2016;18:1199-208
21. Chen L, Wu X, Ma X, Guo L, Zhu C, Li Q. Prognostic value of 18F-FDG PET-CT-based functional parameters in patients with soft tissue sarcoma: A meta-analysis. Medicine. 2017;96:e5913
22. Li Q, Zhang J, Cheng W, Zhu C, Chen L, Xia F. et al. Prognostic value of maximum standard uptake value, metabolic tumor volume, and total lesion glycolysis of positron emission tomography/computed tomography in patients with nasopharyngeal carcinoma: A systematic review and meta-analysis. Medicine. 2017;96:e8084
23. Liu J, Dong M, Sun X, Li W, Xing L, Yu J. Prognostic Value of 18F-FDG PET/CT in Surgical Non-Small Cell Lung Cancer: A Meta-Analysis. PloS one. 2016;11:e0146195
24. Xia Q, Liu J, Wu C, Song S, Tong L, Huang G. et al. Prognostic significance of (18)FDG PET/CT in colorectal cancer patients with liver metastases: a meta-analysis. Cancer imaging: the official publication of the International Cancer Imaging Society. 2015;15:19
25. Xie M, Wu K, Liu Y, Jiang Q, Xie Y. Predictive value of F-18 FDG PET/CT quantization parameters in diffuse large B cell lymphoma: a meta-analysis with 702 participants. Medical oncology. 2015;32:446
26. Zhu D, Wang L, Zhang H, Chen J, Wang Y, Byanju S. et al. Prognostic value of 18F-FDG-PET/CT parameters in patients with pancreatic carcinoma: A systematic review and meta-analysis. Medicine. 2017;96:e7813
27. Zhu W, Xing L, Yue J, Sun X, Sun X, Zhao H. et al. Prognostic significance of SUV on PET/CT in patients with localised oesophagogastric junction cancer receiving neoadjuvant chemotherapy/chemoradiation:a systematic review and meta-analysis. The British journal of radiology. 2012;85:e694-701
28. Stroup DF, Berlin JA, Morton SC, Olkin I, Williamson GD, Rennie D. et al. Meta-analysis of observational studies in epidemiology: a proposal for reporting. Meta-analysis Of Observational Studies in Epidemiology (MOOSE) group. Jama. 2000;283:2008-12
29. Parmar MK, Torri V, Stewart L. Extracting summary statistics to perform meta-analyses of the published literature for survival endpoints. Statistics in medicine. 1998;17:2815-34
30. Mantel N, Haenszel W. Statistical aspects of the analysis of data from retrospective studies of disease. Journal of the National Cancer Institute. 1959;22:719-48
31. DerSimonian R, Laird N. Meta-analysis in clinical trials. Controlled clinical trials. 1986;7:177-88
32. Egger M, Davey Smith G, Schneider M, Minder C. Bias in meta-analysis detected by a simple, graphical test. Bmj. 1997;315:629-34
33. Chiang GC, Galla N, Ferraro R, Kovanlikaya I. The Added Prognostic Value of Metabolic Tumor Size on FDG-PET at First Suspected Recurrence of Glioblastoma Multiforme. Journal of neuroimaging: official journal of the American Society of Neuroimaging. 2017;27:243-7
34. Hassanzadeh C, Rao YJ, Chundury A, Rowe J, Ponisio MR, Sharma A. et al. Multiparametric MRI and [(18)F]Fluorodeoxyglucose Positron Emission Tomography Imaging Is a Potential Prognostic Imaging Biomarker in Recurrent Glioblastoma. Frontiers in oncology. 2017;7:178
35. Jung TY, Min JJ, Bom HS, Jung S, Kim IY, Lim SH. et al. Prognostic value of post-treatment metabolic tumor volume from (11)C-methionine PET/CT in recurrent malignant glioma. Neurosurgical review. 2017;40:223-9
36. Kobayashi K, Hirata K, Yamaguchi S, Manabe O, Terasaka S, Kobayashi H. et al. Prognostic value of volume-based measurements on (11)C-methionine PET in glioma patients. European journal of nuclear medicine and molecular imaging. 2015;42:1071-80
37. Mitamura K, Yamamoto Y, Kudomi N, Maeda Y, Norikane T, Miyake K. et al. Intratumoral heterogeneity of (18)F-FLT uptake predicts proliferation and survival in patients with newly diagnosed gliomas. Annals of nuclear medicine. 2017;31:46-52
38. Pyka T, Gempt J, Hiob D, Ringel F, Schlegel J, Bette S. et al. Textural analysis of pre-therapeutic [18F]-FET-PET and its correlation with tumor grade and patient survival in high-grade gliomas. European journal of nuclear medicine and molecular imaging. 2016;43:133-41
39. Schwarzenberg J, Czernin J, Cloughesy TF, Ellingson BM, Pope WB, Grogan T. et al. Treatment response evaluation using 18F-FDOPA PET in patients with recurrent malignant glioma on bevacizumab therapy. Clinical cancer research: an official journal of the American Association for Cancer Research. 2014;20:3550-9
40. Toyonaga T, Yamaguchi S, Hirata K, Kobayashi K, Manabe O, Watanabe S. et al. Hypoxic glucose metabolism in glioblastoma as a potential prognostic factor. European journal of nuclear medicine and molecular imaging. 2017;44:611-9
41. Kim S, Kim D, Kim SH, Park MA, Chang JH, Yun M. The roles of (11)C-acetate PET/CT in predicting tumor differentiation and survival in patients with cerebral glioma. European journal of nuclear medicine and molecular imaging. 2018;45:1012-20
42. Jansen NL, Suchorska B, Wenter V, Eigenbrod S, Schmid-Tannwald C, Zwergal A. et al. Dynamic 18F-FET PET in newly diagnosed astrocytic low-grade glioma identifies high-risk patients. Journal of nuclear medicine: official publication, Society of Nuclear Medicine. 2014;55:198-203
43. Lopci E, Riva M, Olivari L, Raneri F, Soffietti R, Piccardo A. et al. Prognostic value of molecular and imaging biomarkers in patients with supratentorial glioma. European journal of nuclear medicine and molecular imaging. 2017;44:1155-64
44. Yoo MY, Paeng JC, Cheon GJ, Lee DS, Chung JK, Kim EE. et al. Prognostic Value of Metabolic Tumor Volume on (11)C-Methionine PET in Predicting Progression-Free Survival in High-Grade Glioma. Nuclear medicine and molecular imaging. 2015;49:291-7
45. Colavolpe C, Chinot O, Metellus P, Mancini J, Barrie M, Bequet-Boucard C. et al. FDG-PET predicts survival in recurrent high-grade gliomas treated with bevacizumab and irinotecan. Neuro-oncology. 2012;14:649-57
46. Idema AJ, Hoffmann AL, Boogaarts HD, Troost EG, Wesseling P, Heerschap A. et al. 3'-Deoxy-3'-18F-fluorothymidine PET-derived proliferative volume predicts overall survival in high-grade glioma patients. Journal of nuclear medicine: official publication, Society of Nuclear Medicine. 2012;53:1904-10
47. Kamson DO, Mittal S, Robinette NL, Muzik O, Kupsky WJ, Barger GR. et al. Increased tryptophan uptake on PET has strong independent prognostic value in patients with a previously treated high-grade glioma. Neuro-oncology. 2014;16:1373-83
48. Li W, Ma L, Wang X, Sun J, Wang S, Hu X. (11)C-choline PET/CT tumor recurrence detection and survival prediction in post-treatment patients with high-grade gliomas. Tumour biology: the journal of the International Society for Oncodevelopmental Biology and Medicine. 2014;35:12353-60
49. Sweeney R, Polat B, Samnick S, Reiners C, Flentje M, Verburg FA. O-(2-[(18)F]fluoroethyl)-L-tyrosine uptake is an independent prognostic determinant in patients with glioma referred for radiation therapy. Annals of nuclear medicine. 2014;28:154-62
50. Zhao F, Cui Y, Li M, Fu Z, Chen Z, Kong L. et al. Prognostic value of 3'-deoxy-3'-18F-fluorothymidine ([(18)F] FLT PET) in patients with recurrent malignant gliomas. Nuclear medicine and biology. 2014;41:710-5
51. Toriihara A, Ohtake M, Tateishi K, Hino-Shishikura A, Yoneyama T, Kitazume Y. et al. Prognostic implications of (62)Cu-diacetyl-bis (N(4)-methylthiosemicarbazone) PET/CT in patients with glioma. Annals of nuclear medicine. 2018;32:264-71
52. Thon N, Kunz M, Lemke L, Jansen NL, Eigenbrod S, Kreth S. et al. Dynamic 18F-FET PET in suspected WHO grade II gliomas defines distinct biological subgroups with different clinical courses. International journal of cancer. 2015;136:2132-45
53. Colavolpe C, Metellus P, Mancini J, Barrie M, Bequet-Boucard C, Figarella-Branger D. et al. Independent prognostic value of pre-treatment 18-FDG-PET in high-grade gliomas. Journal of neuro-oncology. 2012;107:527-35
54. Kim D, Kim S, Kim SH, Chang JH, Yun M. Prediction of Overall Survival Based on Isocitrate Dehydrogenase 1 Mutation and 18F-FDG Uptake on PET/CT in Patients With Cerebral Gliomas. Clinical nuclear medicine. 2018;43:311-6
55. Moller S, Law I, Munck Af Rosenschold P, Costa J, Poulsen HS, Engelholm SA. et al. Prognostic value of (18)F-FET PET imaging in re-irradiation of high-grade glioma: Results of a phase I clinical trial. Radiotherapy and oncology: journal of the European Society for Therapeutic Radiology and Oncology. 2016;121:132-7
56. Jansen NL, Suchorska B, Wenter V, Schmid-Tannwald C, Todica A, Eigenbrod S. et al. Prognostic significance of dynamic 18F-FET PET in newly diagnosed astrocytic high-grade glioma. Journal of nuclear medicine: official publication, Society of Nuclear Medicine. 2015;56:9-15
57. Debus C, Waltenberger M, Floca R, Afshar-Oromieh A, Bougatf N, Adeberg S. et al. Impact of (18)F-FET PET on Target Volume Definition and Tumor Progression of Recurrent High Grade Glioma Treated with Carbon-Ion Radiotherapy. Scientific reports. 2018;8:7201
58. Gempt J, Bette S, Ryang YM, Buchmann N, Peschke P, Pyka T. et al. 18F-fluoro-ethyl-tyrosine positron emission tomography for grading and estimation of prognosis in patients with intracranial gliomas. European journal of radiology. 2015;84:955-62
59. Karunanithi S, Sharma P, Kumar A, Gupta DK, Khangembam BC, Ballal S. et al. Can (18)F-FDOPA PET/CT predict survival in patients with suspected recurrent glioma? A prospective study. European journal of radiology. 2014;83:219-25
60. Leiva-Salinas C, Schiff D, Flors L, Patrie JT, Rehm PK. FDG PET/MR Imaging Coregistration Helps Predict Survival in Patients with Glioblastoma and Radiologic Progression after Standard of Care Treatment. Radiology. 2017;283:508-14
61. Patel CB, Fazzari E, Chakhoyan A, Yao J, Raymond C, Nguyen H. et al. (18)F-FDOPA PET and MRI characteristics correlate with degree of malignancy and predict survival in treatment-naive gliomas: a cross-sectional study. Journal of neuro-oncology. 2018;139:399-409
62. Poetsch N, Woehrer A, Gesperger J, Furtner J, Haug AR, Wilhelm D. et al. Visual and semiquantitative 11C-methionine PET: an independent prognostic factor for survival of newly diagnosed and treatment-naive gliomas. Neuro-oncology. 2018;20:411-9
63. Morana G, Piccardo A, Tortora D, Puntoni M, Severino M, Nozza P. et al. Grading and outcome prediction of pediatric diffuse astrocytic tumors with diffusion and arterial spin labeling perfusion MRI in comparison with 18F-DOPA PET. European journal of nuclear medicine and molecular imaging. 2017;44:2084-93
64. Takano K, Kinoshita M, Arita H, Okita Y, Chiba Y, Kagawa N. et al. Diagnostic and Prognostic Value of 11C-Methionine PET for Nonenhancing Gliomas. AJNR American journal of neuroradiology. 2016;37:44-50
65. James ML, Gambhir SS. A molecular imaging primer: modalities, imaging agents, and applications. Physiological reviews. 2012;92:897-965
66. Bolcaen J, Acou M, Descamps B, Kersemans K, Deblaere K, Vanhove C. et al. PET for Therapy Response Assessment in Glioblastoma. In: (ed.) De Vleeschouwer S. Glioblastoma. Brisbane (AU). 2017
67. Kinahan PE, Fletcher JW. Positron emission tomography-computed tomography standardized uptake values in clinical practice and assessing response to therapy. Seminars in ultrasound, CT, and MR. 2010;31:496-505
68. Miyake K, Ogawa D, Okada M, Hatakeyama T, Tamiya T. Usefulness of positron emission tomographic studies for gliomas. Neurologia medico-chirurgica. 2016;56:396-408
69. Kim YI, Kim Y, Lee JY, Jang SJ. Prognostic Value of the Metabolic and Volumetric Parameters of (11)C-Methionine Positron-Emission Tomography for Gliomas: A Systematic Review and Meta-Analysis. AJNR American journal of neuroradiology. 2018;39:1629-34
70. Xu W, Gao L, Shao A, Zheng J, Zhang J. The performance of 11C-Methionine PET in the differential diagnosis of glioma recurrence. Oncotarget. 2017;8:91030-9
71. Dunet V, Pomoni A, Hottinger A, Nicod-Lalonde M, Prior JO. Performance of 18F-FET versus 18F-FDG-PET for the diagnosis and grading of brain tumors: systematic review and meta-analysis. Neuro-oncology. 2016;18:426-34
Author contact
![]() Corresponding authors: Xin Zhou(zhouxin5523org.cn) or Hongyi Qu(qing_flycom). Address: Department of Oncology, First Affiliated Hospital of Nanjing Medical University, Nanjing 210029, China. TEL: +86-025-83718836; FAX: +86-025-83718836
Corresponding authors: Xin Zhou(zhouxin5523org.cn) or Hongyi Qu(qing_flycom). Address: Department of Oncology, First Affiliated Hospital of Nanjing Medical University, Nanjing 210029, China. TEL: +86-025-83718836; FAX: +86-025-83718836
Citation styles
APA
Zhang, Q., Gao, X., Wei, G., Qiu, C., Qu, H., Zhou, X. (2019). Prognostic Value of MTV, SUVmax and the T/N Ratio of PET/CT in Patients with Glioma: A Systematic Review and Meta-Analysis. Journal of Cancer, 10(7), 1707-1716. https://doi.org/10.7150/jca.28605.
ACS
Zhang, Q.; Gao, X.; Wei, G.; Qiu, C.; Qu, H.; Zhou, X. Prognostic Value of MTV, SUVmax and the T/N Ratio of PET/CT in Patients with Glioma: A Systematic Review and Meta-Analysis. J. Cancer 2019, 10 (7), 1707-1716. DOI: 10.7150/jca.28605.
NLM
Zhang Q, Gao X, Wei G, Qiu C, Qu H, Zhou X. Prognostic Value of MTV, SUVmax and the T/N Ratio of PET/CT in Patients with Glioma: A Systematic Review and Meta-Analysis. J Cancer 2019; 10(7):1707-1716. doi:10.7150/jca.28605. https://www.jcancer.org/v10p1707.htm
CSE
Zhang Q, Gao X, Wei G, Qiu C, Qu H, Zhou X. 2019. Prognostic Value of MTV, SUVmax and the T/N Ratio of PET/CT in Patients with Glioma: A Systematic Review and Meta-Analysis. J Cancer. 10(7):1707-1716.
This is an open access article distributed under the terms of the Creative Commons Attribution (CC BY-NC) license (https://creativecommons.org/licenses/by-nc/4.0/). See http://ivyspring.com/terms for full terms and conditions.