Journal of Cancer
ISSN: 1837-9664
3.2
Impact Factor
ISSN: 1837-9664

 Global reach, higher impact
J Cancer 2019; 10(13):3037-3045. doi:10.7150/jca.30624 This issue Cite
Research Paper
Incidence of metastatic disease and survival among patients with newly diagnosed primary CNS tumors in the United States from 2004-2013
Hao Lian1, Craig Daniels2, Yi-Peng Han1, Qi-Feng Li1, Yang Zhao1, Bao-Cheng Wang1, Chang-Bin Zhu1, Wei-Wei Mao1, Michael D. Taylor2 ![]() , Jie Ma1
, Jie Ma1 ![]()
1. Department of Pediatric Neurosurgery, Xinhua Hospital Affiliated to Shanghai Jiao Tong University School of Medicine, Shanghai 200092, China
2. Division of Neurosurgery, Program in Developmental and Stem Cell Biology, Arthur and Sonia Labatt Brain Tumour Research Centre, Hospital for Sick Children, Toronto, Ontario M5G 1X8, Canada
Received 2018-10-12; Accepted 2019-4-24; Published 2019-6-2
Citation:
Lian H, Daniels C, Han YP, Li QF, Zhao Y, Wang BC, Zhu CB, Mao WW, Taylor MD, Ma J. Incidence of metastatic disease and survival among patients with newly diagnosed primary CNS tumors in the United States from 2004-2013. J Cancer 2019; 10(13):3037-3045. doi:10.7150/jca.30624. https://www.jcancer.org/v10p3037.htm
Other stylesAbstract
Background: Population-based estimates of the incidence and prognosis of metastatic disease at the initial diagnosis of primary central nervous system (CNS) tumors are currently lacking.
Methods: A total of 43,455 patients diagnosed with a primary CNS tumor were enrolled to evaluate metastatic rates utilizing the data from the Surveillance, Epidemiology, and End Results (SEER) program. We used multivariate logistic regression to analyze the risk factors associated with the presence of metastasis at the first visit of patients with metastatic medulloblastoma (MB), atypical teratoid/rhabdoid tumor (ATRT), glioblastoma multiforme (GBM), or pilocytic astrocytoma (PA). Hazard ratios (HRs) and 95% confidence intervals (CIs) for cancer-specific death (CSD) of patients with these four CNS tumors were analyzed using multivariate Cox regression.
Results: In patients with primary CNS embryonal tumors, the metastatic rates of patients with MB and ATRT were 14.51% and 19.25%, respectively. The metastatic rate for MB patients aged 0 to 18 years was 16.69%. In the patients with glioma, the metastatic rates of patients with PA and GBM were 1.55% and 1.39%, respectively. On multivariate logistic regression among patients with glioma, GBM (vs PA; OR, 2.12; 95% CI, 1.37 to 3.30; P=0.001) was associated with greater odds of having metastatic disease at diagnosis. On multivariate logistic regression among patients with GBM, MB, or ATRT, MB (vs GBM; OR, 4.66; 95% CI, 2.81 to 7.72; P<0.001) and ATRT (vs GBM; OR, 5.65; 95% CI, 3.27 to 9.75; P<0.001) were associated with greater odds of having metastatic disease at diagnosis. In the multivariate Cox proportional hazards model for CSD among patients with metastatic GBM or MB at diagnosis, gross total resection/total lobectomy (vs partial resection/partial lobectomy) was not related to a decreased or an increased risk of CSD. In patients with metastatic ATRT, compared to no surgery, gross total resection/total lobectomy or partial resection/partial lobectomy was not associated with a decreased risk of CSD.
Conclusions: The findings in this study provide a population-based estimate of the incidence and prognosis of metastatic disease at the initial diagnosis of primary CNS tumors. These survival outcomes are relevant because they will help to prioritize future research directions to improve the treatment strategies of these metastatic CNS tumors.
Keywords: metastatic central nervous system tumors, medulloblastoma, glioblastoma multiforme, pilocytic astrocytoma, atypical teratoid/rhabdoid tumor
Introduction
Limited data are available on the incidence of metastasis among primary CNS tumors.
Medulloblastoma (MB), a CNS embryonal tumor originating from the posterior fossa, is the most frequent malignant pediatric brain tumor [1]. Eighteen percent of the children with MB present with metastatic disease at diagnosis [2]. Atypical teratoid/rhabdoid tumor (ATRT) is a highly malignant CNS embryonal tumor commonly affecting children <3 years of age [3]. Recent data indicate that it is the most frequent malignant CNS tumor in children <6 months of age [4]. For ATRT, CSF involvement via leptomeningeal dissemination can be observed in 15%-30% of patients [3]. GBM is the most frequent of all malignant CNS tumors [5] and is also the most frequent primary brain tumor in adults [6]. Cerebrospinal fluid (CSF) involvement through leptomeningeal dissemination is present in approximately 2% of patients with GBM [7]. PA is the most common glioma in children and adolescents [5, 8, 9]. In the literature, the incidence of metastatic disease at diagnosis of PA ranges from 0.9% to 5% [10-12]. However, robust population-based studies comparing metastatic rates between patients with CNS neoplasms, especially these four common CNS tumors, are lacking.
Metastatic disease represents a significant cause of mortality among patients with CNS tumors. Compared to patients with nonmetastatic CNS tumors, patients with metastatic CNS tumors who receive the same treatment modalities such as surgery, radiation therapy, and chemotherapy are likely to have very different prognoses [10, 13]. Nevertheless, population-level studies for sociodemographic and clinical predictors of outcomes among patients with newly diagnosed CNS tumors and metastatic disease are also lacking.
The aim of the present study was to utilize the Surveillance, Epidemiology, and End Results (SEER) database to characterize the incidence rate of metastatic disease at the initial diagnosis in patients with CNS tumors on a population-based level. We also endeavored to quantify survival estimates of patients with MB, ATRT, GBM or PA and to comprehensively evaluate the demographic, clinical, and prognostic features for patients with these four CNS tumors and any metastatic disease present at diagnosis.
Methods
Patients and clinicopathological data
Information on cancer incidence, treatment, and survival was derived from the SEER 18 Regs Custom Data (2000-2013). We utilized the SEER 18 Regs Research Data (2000-2014) to compute annual percent changes (APCs) of patients with metastatic MB, ATRT, GBM, or PA in the incidence rates from 2004 to 2013 to examine the trends over time. Within the SEER 18 Regs Custom Data, we identified 59,596 patients who were diagnosed with primary CNS tumors from 2004-2013 in the primary sites C70.0-C72.9 (International Classification of Diseases for Oncology Third Edition (ICD-O-3)). Patients who experienced their first primary cancer were included in the cohort [14, 15]. We excluded patients diagnosed between 2004 and 2013 for whom the presence or absence of metastatic disease at the time of initial CNS tumor diagnosis was unknown, leaving 43,455 patients in the final cohort for the analyses of metastatic rates. All primary CNS tumors analyzed are shown in table 1 with their respective ICD-O-3 histology codes. Of these, we removed patients who were diagnosed at autopsy or via death certificate, leaving 870 patients with metastatic CNS tumors for survival analysis. We selected patients with relatively common and frequently occurring CNS embryonal tumors or gliomas with high metastatic rates, including MB (ICD-O-3 histology codes: 9470, 9471, 9472, 9474), ATRT (9508), GBM (9440, 9441, 9442), and PA (9421), to perform further analyses of the APCs of patients with metastases between 2004 and 2013 by age at diagnosis, sex and race. Race was classified as white, black, or other (American Indian/Alaska Native, Asian/Pacific Islander) according to the SEER database (Figure 1).
Statistical analysis
Multivariate logistic regression was used to determine whether the age at diagnosis, sex, or race were related to the presence of metastatic disease at diagnosis of MB, ATRT, GBM, or PA; other variables in the model included primary site, ICD-O-3 histology groups, and insurance status [16]. In this study, we employed the SEER cause-specific death classification variable to obtain estimates for cancer-specific survival [17]. Patients who were still alive on December 31, 2013, or who had died of other causes were censored. Survival rates (at 1, 3 and 5 years) by cancer-specific death by surgery [18], radiotherapy, and chemotherapy for patients with metastatic MB, GBM, or ATRT from 2004 to 2013 were calculated using the Kaplan-Meier method. HRs, 95% CIs, and P values for the cancer-specific death of patients with metastatic MB, ATRT, GBM, or PA related to age at diagnosis, sex, race, primary site, ICD-O-3 histology groups, insurance status, radiotherapy, chemotherapy, or surgery were calculated using multivariate Cox proportional hazards analysis. All analyses, except APCs and nomograms, were conducted using SPSS software, version 23.0. APCs were calculated using the joinpoint regression software program (version 4.5.0.1; http://surveillance.cancer.gov/joinpoint/download). We generated nomograms of the multivariate Cox models with the R package 'rms' version 4-4.2.
Figure 1
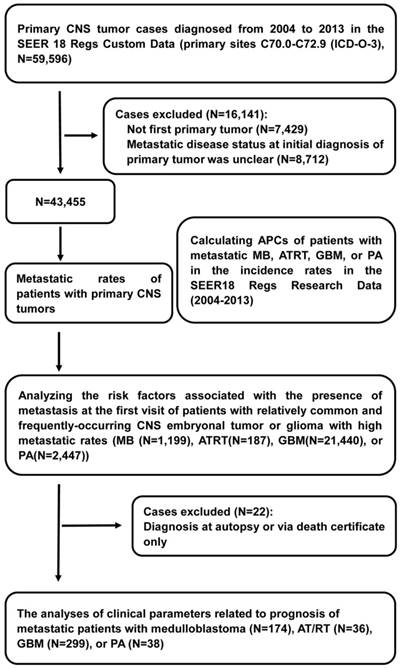
Flow diagram of selections and analyses of primary Central Nervous System (CNS) tumor cases from the Surveillance, Epidemiology, and End Results (SEER) program database. Abbreviations: ICD-O-3, International Classification of Diseases for Oncology Third Edition; APCs, annual percentage changes; MB, medulloblastoma; ATRT, atypical teratoid/rhabdoid tumor; GBM, glioblastoma multiforme; and PA, pilocytic astrocytoma.
Results
Incidence
The metastatic number and incidence proportions of patients with CNS tumors, as stratified by SEER ICD-O-3 histology codes, are provided in table 1. Among patients with primary CNS embryonal tumors, the metastatic rates of patients with ATRT or MB were 19.25% and 14.51%, respectively. In addition, the metastatic rate of MB patients aged 0 to 18 years was 16.69%. Among the patients with glioma, the metastatic rates of patients with ependymoma (NOS), PA, GBM, or oligodendroglioma were 1.94, 1.55%, 1.39%, and 0.29%, respectively. In general, the metastatic rates of patients with ATRT were the highest, and the metastatic rates of patients with oligodendroglioma were the lowest for patients with CNS embryonal tumors or gliomas. Figure 2 and supplemental table 1 show the incidence trends of patients with metastatic MB, ATRT, GBM, or PA diagnosed from 2004 to 2013. Joinpoint analyses identified 2007 as the single inflection point among male patients with metastatic MB: there was an increasing trend in the incidence rates from 2004 to 2007 (APC, 48.5; 95% CI, 23.8 to 78.3; P=0.03), and a decreasing trend in the incidence rates from 2007 to 2013 (APC, -13.5; 95% CI, -18.0 to -8.7; P=0.03). Similarly, joinpoint analyses identified 2009 as the single inflection point among all patients with metastatic ATRT: there was an increasing trend in the incidence rates from 2004 to 2009 (APC, 26.5; 95% CI, 17.3 to 36.5; P=0.02), and a decreasing trend in the incidence rates from 2009 to 2013 (APC, -20.5; 95% CI, -28.0 to -12.2; P=0.02). In addition, joinpoint analyses identified 2009 as the single inflection point among metastatic ATRT patients aged 0 to 19 years: there was an increasing trend in the incidence rates from 2004 to 2009 (APC, 23.2; 95% CI, 14.2 to 33.0; P=0.029), and a declining trend in the incidence rates from 2009 to 2013 (APC, -18.0; 95% CI, -25.8 to -9.5; P=0.029).
On multivariate logistic regression analysis on patients with MB from 2004 to 2013 (table 2), ages 7 to 18 years (vs age 0 to 3 years; OR, 0.62; 95% CI, 0.40 to 0.97; P=0.037) and an age greater than 18 years (vs age 0 to 3 years; OR, 0.39; 95% CI, 0.23 to 0.65; P<0.001) indicated lower odds of having metastatic disease at diagnosis, while large cell MB (vs desmoplastic nodular MB; OR, 3.80; 95% CI, 1.71 to 8.46; P=0.001) was associated with significantly greater odds of having metastatic disease at diagnosis. On multivariate logistic regression analysis on patients with glioma from 2004 to 2013 (table 3), an age greater than 18 years (vs age 0 to 18 years; OR, 0.54; 95% CI, 0.40 to 0.74; P<0.001), and primary site in the temporal lobe (vs primary site in the cerebrum; OR, 0.50; 95% CI, 0.31 to 0.80; P=0.004) were associated with lower odds of having metastatic disease at diagnosis. When compared to other variables, other races (vs white race; OR, 2.05; 95% CI, 1.54 to 2.74; P<0.001), primary site in the ventricle (vs primary site in the cerebrum; OR, 2.54; 95% CI, 1.39 to 4.65; P=0.003), anaplastic ependymoma (vs PA; OR, 3.42; 95% CI, 1.92 to 6.09; P<0.001), myxopapillary ependymoma (vs PA; OR, 7.39; 95% CI, 1.31 to 41.64; P=0.023), and GBM (vs PA; OR, 2.12; 95% CI, 1.37 to 3.30; P=0.001) were associated with greater odds of having metastatic disease at diagnosis. The variables including age at diagnosis, sex, race, primary site, and insurance status were all validated as not being related to a risk of metastatic disease at diagnosis in the multivariate logistic regression analysis for patients with ATRT (supplemental table 2). Comparing patients with GBM to those with MB or ATRT, patients with MB (vs GBM; OR, 4.66; 95% CI, 2.81 to 7.72; P<0.001) and ATRT (vs GBM; OR, 5.65; 95% CI, 3.27 to 9.75; P<0.001) had greater odds of having metastatic disease at diagnosis (supplemental table 3) according to the multivariate logistic regression analysis.
Table 1
Metastatic Rates of Patients with Primary CNS Tumors Diagnosed From 2004 to 2013
| SEER ICD-O-3 Histology Groups | No. of Metastatic Cases (n = 870) | No. of Entire Cases (n = 43,231) | Metastatic Rate, % |
|---|---|---|---|
| 9130/3 Hemangioendothelioma, malignant | 1 | 1 | 100.00 |
| 8728/3 Meningeal melanomatosis | 1 | 3 | 33.33 |
| 8890/3 Leiomyosarcoma, NOS | 1 | 3 | 33.33 |
| 9071/3 Yolk sac tumor | 1 | 3 | 33.33 |
| 8900/3 Rhabdomyosarcoma, NOS | 1 | 3 | 33.33 |
| 8720/3 Malignant melanoma, NOS | 6 | 22 | 27.27 |
| 8680/3 Paraganglioma, malignant | 1 | 4 | 25.00 |
| 9260/3 Ewing sarcoma | 2 | 8 | 25.00 |
| 9501/3 Medulloepithelioma, NOS | 1 | 4 | 25.00 |
| 9161/3 Hemangioblastoma, malignant | 2 | 9 | 22.22 |
| 9508/3 Atypical teratoid/rhabdoid tumor | 36 | 187 | 19.25 |
| 8801/3 Spindle cell sarcoma | 1 | 6 | 16.67 |
| 9100/3 Choriocarcinoma, NOS | 1 | 6 | 16.67 |
| 9390/3 Choroid plexus papilloma, malignant | 11 | 68 | 16.18 |
| 9470/3, 9471/3, 9472/3, 9474/3 Medulloblastomaa | 174 | 1199 | 14.51 |
| 9490/3 Ganglioneuroblastoma | 2 | 15 | 13.33 |
| 9473/3 Primitive neuroectodermal tumor | 43 | 333 | 12.91 |
| 8963/3 Malignant rhabdoid tumor | 2 | 16 | 12.50 |
| 9539/3 Meningeal sarcomatosis | 2 | 20 | 10.00 |
| 9560/3 Neurilemoma, malignant (OBS) | 4 | 42 | 9.52 |
| 9394/3 Myxopapillary ependymoma, malignant | 2 | 21 | 9.52 |
| 9150/3 Hemangiopericytoma, malignant | 8 | 89 | 8.99 |
| 9364/3 Peripheral neuroectodermal tumor | 1 | 12 | 8.33 |
| 8800/3 Sarcoma, NOS | 1 | 12 | 8.33 |
| 9080/3 Teratoma, malignant, NOS | 2 | 26 | 7.69 |
| 9392/3 Ependymoma, anaplastic | 19 | 367 | 5.18 |
| 8000/3 Neoplasm, malignant | 34 | 702 | 4.84 |
| 9540/3 Malignant peripheral nerve sheath tumor | 2 | 51 | 3.92 |
| 9530/3, 9531/3, 9532/3, 9534/3, 9537/3 Meningioma | 21 | 582 | 3.61 |
| 9064/3, 9085/3 Germinoma | 5 | 194 | 2.58 |
| 9381/3 Gliomatosis cerebri | 2 | 83 | 2.41 |
| 9391/3 Ependymoma, NOS | 29 | 1495 | 1.94 |
| 9370/3 Chordoma, NOS | 1 | 62 | 1.61 |
| 9421/3 Pilocytic astrocytoma, malignant | 38 | 2447 | 1.55 |
| 9440/3, 9441/3, 9442/3 Glioblastoma multiforme | 299 | 21510 | 1.39 |
| 9505/3 Ganglioglioma, anaplastic | 1 | 72 | 1.39 |
| 9420/3 Fibrillary astrocytoma | 9 | 651 | 1.38 |
| 9424/3 Pleomorphic xanthoastrocytoma | 3 | 235 | 1.28 |
| 9400/3 Astrocytoma, NOS | 30 | 2706 | 1.11 |
| 9411/3 Gemistocytic astrocytoma | 3 | 297 | 1.01 |
| 9401/3 Astrocytoma, anaplastic | 26 | 2576 | 1.01 |
| 9380/3 Glioma, malignant | 26 | 2844 | 0.91 |
| 9382/3 Mixed glioma | 7 | 1452 | 0.48 |
| 9450/3, 9451/3, 9460/3 Oligodendroglioma | 8 | 2793 | 0.29 |
a Metastatic rate of medulloblastoma patients aged 0 to 18 years was 16.69%.
Table 2
Multivariable Logistic Regression for the Presence of Metastatic Disease at Diagnosis of Medulloblastoma From 2004 to 2013a
| Patients, No. | Multivariate Analysis | |||||
|---|---|---|---|---|---|---|
| Non-metastatic Disease | Metastatic Disease | |||||
| Variable | (n=1025) | (n=174) | OR (95% CI) | P Value | ||
| Age at diagnosis, y | ||||||
| 0 to 3 | 190 | 44 | 1 [Reference] | NA | ||
| 4 to 6 | 150 | 42 | NA | NA | ||
| 7 to 18 | 359 | 54 | 0.62 (0.40-0.97) | .037 | ||
| >18 | 326 | 34 | 0.39 (0.23-0.65) | <.001 | ||
| Sex | ||||||
| Female | 399 | 64 | 1 [Reference] | NA | ||
| Male | 626 | 110 | NA | NA | ||
| Race | ||||||
| White | 848 | 143 | 1 [Reference] | NA | ||
| Black | 86 | 10 | NA | NA | ||
| Otherb Unknown | 85 6 | 21 0 | NA NA | . | NA NA | |
| Primary site | ||||||
| Cerebellum, NOS | 836 | 137 | 1 [Reference] | NA | ||
| Cerebral meninges | 1 | 0 | NA | NA | ||
| Cerebrum | 2 | 2 | NA | NA | ||
| Parietal lobe | 1 | 0 | NA | . | NA | |
| Occipital lobe | 0 | 1 | NA | NA | ||
| Ventricle, NOS | 37 | 6 | NA | NA | ||
| Brain stem | 105 | 18 | NA | . | NA | |
| Overlapping lesion of brain | 2 | 0 | NA | NA | ||
| Brain, NOS | 41 | 9 | NA | . | NA | |
| Spinal cord | 0 | 1 | NA | NA | ||
| ICD-O-3 Histology Groups | ||||||
| Desmoplastic nodular medulloblastoma | 145 | 14 | 1 [Reference] | NA | ||
| Medullomyoblastoma | 2 | 1 | NA | NA | ||
| Large cell medulloblastoma | 50 | 17 | 3.80 (1.71-8.46) | .001 | ||
| Medulloblastoma, NOS | 828 | 142 | 2.00 (1.11-3.63) | .022 | ||
| Insurance status | ||||||
| Uninsured | 30 | 7 | 1 [Reference] | NA | ||
| Insured | 713 | 122 | NA | NA | ||
| Unknown | 282 | 45 | NA | NA | ||
a Only significant results presented (P < .05). b American Indian/Alaska Native, Asian/Pacific Islander.
Figure 2
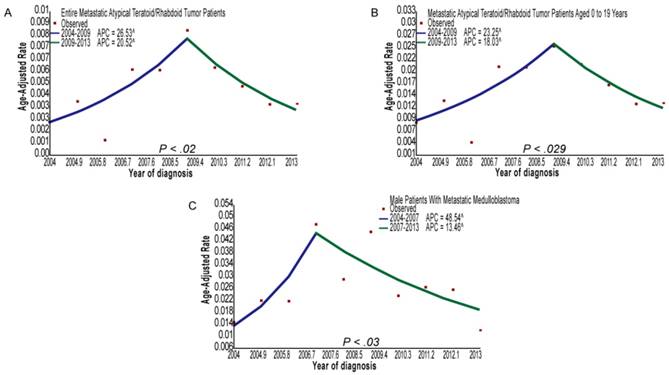
(A) Joinpoint analysis of all the metastatic atypical teratoid/rhabdoid tumor patients from 2004 to 2013. (B) Joinpoint analysis of metastatic atypical teratoid/rhabdoid tumor patients aged 0 to 19 years from 2004 to 2013. (C) Joinpoint analysis of male patients with metastatic medulloblastoma from 2004 to 2013. Abbreviations: APC, annual percentage change.
Table 3
Multivariable Logistic Regression for the Presence of Metastatic Disease at Diagnosis of Glioma From 2004 to 2013a
| Patients, No. | Multivariate Analysis | |||||
|---|---|---|---|---|---|---|
| Non-metastatic Disease | Metastatic Disease | |||||
| Variable | (n=39047) | (n=502) | OR (95% CI) | P Value | ||
| Age at diagnosis, y | ||||||
| 0 to 18 | 4604 | 101 | 1 [Reference] | NA | ||
| >18 | 34443 | 401 | 0.54 (0.40-0.74) | <.001 | ||
| Sex | ||||||
| Female | 17046 | 233 | 1 [Reference] | NA | ||
| Male | 22001 | 269 | NA | NA | ||
| Race | ||||||
| White | 33960 | 404 | 1 [Reference] | NA | ||
| Black | 2603 | 43 | NA | NA | ||
| Otherb | 2247 | 54 | 2.05 (1.54-2.74) | . | <.001 | |
| Unknown | 237 | 1 | NA | NA | ||
| Primary site | ||||||
| Cerebrum | 1856 | 27 | 1 [Reference] | NA | ||
| Cerebral meninges | 2 | 0 | NA | NA | ||
| Spinal meninges | 19 | 0 | NA | NA | ||
| Meninges, NOS | 2 | 0 | NA | NA | ||
| Frontal lobe | 10762 | 98 | NA | NA | ||
| Temporal lobe | 7900 | 57 | 0.50 (0.31-0.80) | .004 | ||
| Parietal lobe | 4740 | 51 | NA | . | NA | |
| Occipital lobe | 1193 | 13 | NA | NA | ||
| Ventricle, NOS | 535 | 21 | 2.54 (1.39-4.65) | .003 | ||
| Cerebellum, NOS | 1329 | 13 | NA | NA | ||
| Brain stem | 1866 | 32 | NA | . | NA | |
| Overlapping lesion of brain | 4811 | 71 | NA | NA | ||
| Brain, NOS | 2261 | 86 | 2.52 (1.63-3.92) | <.001 | ||
| Spinal cord | 1224 | 25 | NA | NA | ||
| Cauda equina | 26 | 0 | NA | NA | ||
| Olfactory nerve | 1 | 0 | NA | NA | ||
| Optic nerve | 503 | 7 | NA | NA | ||
| Cranial nerve | 2 | 0 | NA | NA | ||
| Overlapping lesion of brain & CNS | 11 | 0 | NA | NA | ||
| Nervous system, NOS | 4 | 1 | NA | NA | ||
| ICD-O-3 Histology Groups | ||||||
| Pilocytic astrocytoma, malignant | 2409 | 38 | 1 [Reference] | NA | ||
| Glioma, malignant | 2818 | 26 | NA | NA | ||
| Gliomatosis cerebri | 81 | 2 | NA | NA | ||
| Mixed glioma | 1445 | 7 | NA | NA | ||
| Ependymoma, NOS | 1466 | 29 | NA | NA | ||
| Ependymoma, anaplastic | 348 | 19 | 3.42 (1.92-6.09) | <.001 | ||
| Myxopapillary ependymoma, malignant | 19 | 2 | 7.39 (1.31-41.64) | .023 | ||
| Astrocytoma, NOS | 2676 | 30 | NA | NA | ||
| Astrocytoma, anaplastic | 2550 | 26 | NA | NA | ||
| Gemistocytic astrocytoma | 294 | 3 | NA | NA | ||
| Fibrillary astrocytoma | 642 | 9 | NA | NA | ||
| Pleomorphic xanthoastrocytoma | 232 | 3 | NA | NA | ||
| Glioblastoma multiforme | 21211 | 299 | 2.12 (1.37-3.30) | .001 | ||
| Oligodendroglioma/ Oligodendroblastoma | 2785 | 8 | NA | NA | ||
| Ganglioglioma, anaplastic | 71 | 1 | NA | NA | ||
| Insurance status | ||||||
| Uninsured | 1252 | 9 | 1 [Reference] | NA | ||
| Insured | 26476 | 333 | NA | NA | ||
| Unknown | 11319 | 160 | NA | NA | ||
Abbreviations: OR, odds ratio; NA, not applicable.
a Only significant results presented (P < .05). b American Indian/Alaska Native, Asian/Pacific Islander.
Survival
Cancer-specific survival rates (CSSRs) at 1, 3, and 5 years among patients with metastatic MB, GBM, or ATRT diagnosed from 2004 to 2013 according to treatment—surgery, radiotherapy, or chemotherapy—are presented in supplemental table 4. CSSRs at 1, 3, and 5 years of patients with metastatic MB or GBM receiving partial resection/partial lobectomy or gross total resection/total lobectomy were higher than those of patients with metastatic MB or GBM who did not receive surgery. For patients with metastatic MB, CSSRs at 1 year for patients who had received gross total resection/total lobectomy were higher than those of patients who had received partial resection/partial lobectomy, whereas CSSRs at 3 and 5 years for patients who had received gross total resection/total lobectomy were lower than those of patients receiving partial resection/partial lobectomy. For patients with metastatic GBM, CSSRs at 1 and 3 years for patients receiving gross total resection/total lobectomy were higher than that of patients receiving partial resection/partial lobectomy, whereas CSSRs at 5 years for patients receiving gross total resection/total lobectomy were marginally lower than that of patients receiving partial resection/partial lobectomy. In addition, for patients with metastatic MB or GBM, CSSRs at 1, 3, and 5 years for those receiving radiotherapy were significantly higher than those who did not receive radiotherapy, and similarly, CSSRs at 1, 3, and 5 years for patients receiving chemotherapy were markedly higher.
The multivariate Cox regression for CSD among patients with metastatic MB at diagnosis markedly showed that radiotherapy (vs no radiotherapy; HR, 0.27; 95% CI, 0.13 to 0.56; P<0.001), chemotherapy (vs no/unknown chemotherapy; HR, 0.21; 95% CI, 0.09 to 0.47; P<0.001), partial resection/partial lobectomy (vs no surgery; HR, 0.35; 95% CI, 0.14 to 0.84; P=0.019), and gross total resection/total lobectomy (vs no surgery; HR, 0.41; 95% CI, 0.18 to 0.96; P=0.04) were associated with a decreased risk of CSD, while black race (vs white; HR, 3.21; 95% CI, 1.20 to 8.62; P = .02) was associated with an increased risk of CSD (supplemental table 5). As shown in supplemental table 6, gross total resection/total lobectomy (vs partial resection/partial lobectomy) was not associated with a decreased or an increased risk of CSD in patients with metastatic MB. Multivariate Cox regression for CSD among patients with metastatic ATRT at diagnosis showed that radiotherapy (vs no radiotherapy; HR, 0.15; 95% CI, 0.04 to 0.62; P=0.009) and chemotherapy (vs no/unknown chemotherapy; HR, 0.16; 95% CI, 0.05 to 0.54; P=0.003) were significantly associated with a decreased risk of CSD, whereas gross total resection/total lobectomy (vs no surgery) and partial resection/partial lobectomy (vs no surgery) were not associated with a decreased or an increased risk of CSD (supplemental table 7). In the multivariate Cox proportional hazards model for CSD among patients with metastatic GBM at diagnosis, radiotherapy (vs no radiotherapy; HR, 0.60; 95% CI, 0.43 to 0.83; P=0.002), chemotherapy (vs no/unknown chemotherapy; HR, 0.51; 95% CI, 0.38 to 0.71; P<0.001), partial resection/partial lobectomy (vs no surgery; HR, 0.72; 95% CI, 0.54 to 0.96; P=0.026), and gross total resection/total lobectomy (vs no surgery; HR, 0.53; 95% CI, 0.35 to 0.80; P=0.002) were significantly associated with a decreased risk of CSD (supplemental table 8). As shown in supplemental table 9, gross total resection/total lobectomy (vs partial resection/partial lobectomy) was not associated with a decreased or an increased risk of CSD in patients with metastatic GBM at diagnosis. Nomograms of the multivariate Cox model for CSD among patients with metastatic MB or GBM showing the relative clinical effect of each variable to predict CSSRs at 1, 3 and 5 years are shown in Figure 3. In addition, among patients with metastatic PA at diagnosis, the variables radiotherapy (vs no radiotherapy), chemotherapy (vs no/unknown chemotherapy), partial resection/partial lobectomy (vs no surgery), and gross total resection/total lobectomy (vs no surgery) were not related to a decrease or an increased risk of CSD according to the multivariate Cox proportional hazards model for CSD (supplemental table 10).
Discussion
Population-based incidence and survival studies provide important information to researchers, clinicians, public health officials, and disease interest groups; they also influence the direction of future research [19]. In this population-based study, we described the incidence of identified metastatic disease among patients with newly diagnosed CNS tumors. Specifically, we used data from patients with relatively common and frequently occurring CNS embryonal tumors or gliomas with high metastatic rates, including medulloblastoma (MB), atypical teratoid/rhabdoid tumor (ATRT), glioblastoma multiforme (GBM), or pilocytic astrocytoma (PA), and subsequently characterized the survival of such patients. Because SEER data include approximately 30% of the United States population, the incidence rates and survival outcomes we showed are highly generalizable and likely more reflective of the population compared with previously published data focused primarily on patients diagnosed and treated at cancer research centers.
Figure 3
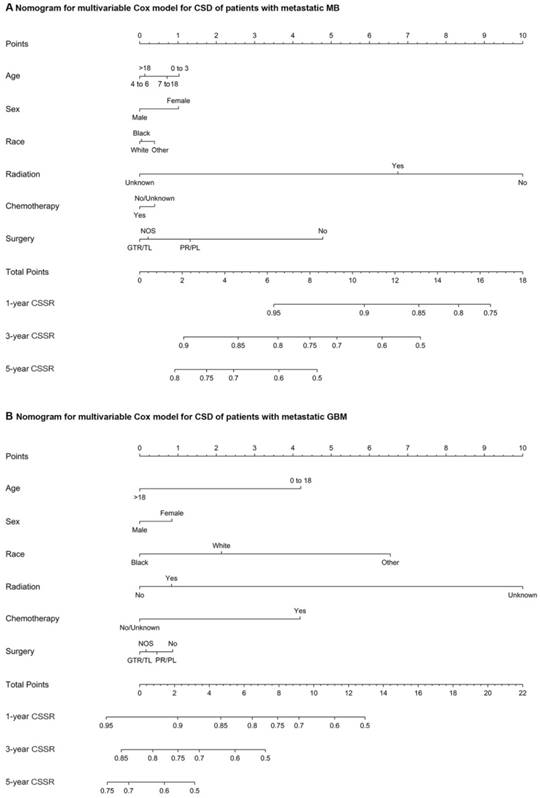
(A) Nomograms of the multivariate Cox model for CSD in patients with metastatic MB. (B) Nomograms of the multivariate Cox model for CSD in patients with metastatic GBM. Abbreviations: CSD, cancer-specific death; MB, medulloblastoma; Other, American Indian/Alaska Native, Asian/Pacific Islander; GTR/TL, gross total resection/total lobectomy; PR/PL, partial resection/partial lobectomy; NOS, not otherwise specified; CSSR, cancer-specific survival rate; and GBM, glioblastoma multiforme.
For most malignant astrocytes, the spread of disease to the subpial area and subarachnoid space is uncommon [20]. In contrast, PAs show a strong tendency to invade the subarachnoid space [20]. GBM tends to invade the white matter but is also seen in the gray matter and the perineuronal and submeningeal spaces [20]. Therefore, we could conclude that patients with PA or GBM (vs patients with most other glioma subtypes) have greater odds of having metastatic disease at diagnosis. Supporting this conclusion, our results show that the metastatic rates of PA and GBM, except for ependymoma, are the two highest of all glioma subtypes. On multivariate logistic regression among patients with glioma, patients with GBM (vs patients with PA) had significantly greater odds of presenting with metastatic disease at diagnosis; one explanation for which is that the dissemination of GBM through the CSF is more likely to occur than that of PA [20]. The result that the metastatic rate of ependymoma is the highest of all glioma subtypes is supported by previous studies, which have shown that because of its location in CSF pathways, ependymoma is prone to dissemination with an overall incidence of seeding ranging between 9% and 20% [21-24]. For MB, spreading to the white matter, gray matter, subarachnoid space, and CSF is quite common [20]. Extraneural metastatic rates for MB are between 5% and 9% in adults, with a slightly higher metastatic rate in children, and as such, it is higher than that of glioma [25]. For patients with ATRT, the incidence of leptomeningeal dissemination ranges from 15% up to 30% [3]. Hence, we concluded that patients with major CNS embryonal tumors (MB or ATRT) have greater odds of having metastatic disease at diagnosis compared to patients with major gliomas (GBM or PA). Our results of metastatic rates for patients with CNS tumors and the multivariate logistic regression among patients with GBM, MB, or ATRT support this conclusion.
We applied joinpoint regression analyses to identify 2007 as the single inflection point among male patients with metastatic MB and 2009 as the single inflection point among all patients with metastatic ATRT and metastatic ATRT patients aged 0 to 19 years, at which the slope of incidence rates statistically decreased. The declining trend in the incidence rates may be due in part to the increased use of combined anatomical and molecularly targeted imaging in the diagnosis and surveillance of CNS embryonal tumors, such as combining anatomic imaging together with planar SPECT imaging with Octreoscan, which has the potential to provide evidence of minimal disease activity and thus allows for retreatment before metastatic disease develops [26]. In addition, the increase in incidence from 2004-2009 and subsequent decrease for MB and ATRT is also likely artefactual due to reporting methods over this timeframe.
We found that among patients with metastatic MB, gross total resection/total lobectomy (vs partial resection/partial lobectomy) was not related to a decrease or an increased risk of CSD. Michael Taylor and colleagues previously reported that there was a survival benefit for gross total resection compared with subtotal resection with metastatic group 4 MB [27]. It is likely that in the SEER database, the number of patients with metastatic WNT, SHH, or group 3 MB was higher than that of patients with metastatic group 4 MB, and this led to the result in our study. The disparity of CSSRs at 1, 3, and 5 years between patients receiving gross total resection/total lobectomy and partial resection/partial lobectomy may explain why there was not a definitive relationship between the extent of resection and the risk of CSD in patients with metastatic MB in this study. Surgery-related multivariate Cox regression results and an explanation for the lack of association between the extent of resection and the risk of CSD by employing the disparity of CSSRs at 1, 3, and 5 years of patients with metastatic GBM were similar to that of patients with metastatic MB. For patients with metastatic ATRT, gross total resection/total lobectomy (vs no surgery) and partial resection/partial lobectomy (vs no surgery) were not related to a decreased or an increased risk of CSD. Further studies evaluating potential explanations for these findings with respect to the survival analyses of patients with metastatic ATRT are warranted. In patients with metastatic PA, we did not obtain meaningful results in the multivariate Cox regression because CSD occurred only in 5 patients. It remains unclear if the possible indolent nature of metastatic PA or its good response to surgery, radiotherapy, or chemotherapy results in the survival of most patients with metastatic PA, and as such, further investigation is warranted.
The findings of our study should be considered in the context of its limitations. First, most patients presenting with metastatic disease at diagnosis were likely symptomatic, while many patients without neurologic symptoms may not be captured in our analyses. Therefore, we likely underestimated the actual metastatic rate in patients with newly diagnosed CNS tumors. Second, the details of the chemotherapeutic agents used and data regarding radiation dosage and radiation field were not known. Finally, information relating to genetic classification, comorbidities, performance status, socioeconomic status, and lifestyle factors was not available; thus, these variables could not be adjusted for in our study.
Conclusion
Despite the potential limitations listed above, our study provides insight into the epidemiology of metastatic disease in patients with newly diagnosed CNS tumors in the US. We found four relatively common and frequently occurring CNS tumors with high metastatic rates: MB, ATRT, GBM, and PA. Our data suggest that the lack of association between the extent of resection and the risk of CSD among patients with metastatic MB or GBM may be explained, at least in part, by the differences of CSSRs at 1, 3, and 5 years between patients receiving gross total resection/total lobectomy and partial resection/partial lobectomy. Understanding differences in the therapeutic efficacy of surgery, radiotherapy, and chemotherapy among patients with metastatic MB, ATRT, GBM, or PA and addressing these differences in future studies is an important part of improving the treatment strategies for patients with these metastatic CNS tumors.
Supplementary Material
Supplementary tables.
Acknowledgements
We sincerely thank Shan Yan for valuable editorial assistance.
Funding
Shanghai Xin Hua Hospital (JZPI201701 to J.M.), Shanghai Shenkang Hospital Development Center (16CR2031B to J.M.), Shanghai Science and Technology Committee (17411951800 to J.M.).
Competing Interests
The authors have declared that no competing interest exists.
References
1. Ostrom QT, de Blank PM, Kruchko C. et al. Alex's Lemonade Stand Foundation Infant and Childhood Primary Brain and Central Nervous System Tumors Diagnosed in the United States in 2007-2011. Neuro-oncology. 2015;16(Suppl 10):x1-1x36
2. Evans AE, Jenkin RD, Sposto R, Ortega JA, Wilson CB, Wara W. et al. The treatment of medulloblastoma. Results of a prospective randomized trial of radiation therapy with and without CCNU, vincristine, and prednisone. J Neurosurg. 1990;72:572-82
3. Biswas A, Kashyap L, Kakkar A, Sarkar C, Julka PK. Atypical teratoid/rhabdoid tumors: challenges and search for solutions. Cancer Manag Res. 2016;8:115-125
4. Frühwald MC, Biegel JA, Bourdeaut F, Roberts CW, Chi SN. Atypical teratoid/rhabdoid tumors-current concepts, advances in biology, and potential future therapies. Neuro-oncology. 2016;18(6):764-778
5. Ostrom QT, Gittleman H, Xu J, Kromer C, Wolinsky Y, Kruchko C. et al. CBTRUS Statistical Report: Primary Brain and Other Central Nervous System Tumors Diagnosed in the United States in 2009-2013. Neuro Oncol. 2016;18:v1-1v75
6. Wen PY, Kesari S. Malignant gliomas in adults. The New England journal of medicine. 2008;359(5):492-507
7. Vertosick FT, Selker RG. Brain stem and spinal metastases of supratentorial glioblastoma multiforme: a clinical series. Neurosurgery. 1990;27(4):516-521 discussion 521-522
8. Sturm D, Pfister SM, DTW J. Pediatric Gliomas: Current Concepts on Diagnosis, Biology, and Clinical Management. Journal of clinical oncology: official journal of the American Society of Clinical Oncology. 2017;35(21):2370-2377
9. Ferris SP, Hofmann JW, Solomon DA, Perry A. Characterization of gliomas: from morphology to molecules. Virchows Archiv: an international journal of pathology. 2017;471(2):257-269
10. Chamdine O, Broniscer A, Wu S, Gajjar A, Qaddoumi I. Metastatic Low-Grade Gliomas in Children: 20 Years' Experience at St. Jude Children's Research Hospital. Pediatr Blood Cancer. 2016;63(1):62-70
11. Gajjar A, Bhargava R, Jenkins JJ, Heideman R, Sanford RA, Langston JW. et al. Low-grade astrocytoma with neuraxis dissemination at diagnosis. J Neurosurg. 1995;83:67-71
12. Hukin J, Siffert J, Cohen H, Velasquez L, Zagzag D, Allen J. Leptomeningeal dissemination at diagnosis of pediatric low-grade neuroepithelial tumors. Neuro Oncol. 2003;5:188-96
13. Zacharoulis S, Ji L, Pollack IF. et al. Metastatic ependymoma: a multi-institutional retrospective analysis of prognostic factors. Pediatr Blood Cancer. 2008;50(2):231-235
14. Darefsky AS, King JT, Dubrow R. Adult glioblastoma multiforme survival in the temozolomide era: a population-based analysis of Surveillance, Epidemiology, and End Results registries. Cancer. 2012;118:2163-72
15. Babu R, Bagley JH, Park JG, Friedman AH, Adamson C. Low-grade astrocytomas: the prognostic value of fibrillary, gemistocytic, and protoplasmic tumor histology. J Neurosurg. 2013;119:434-41
16. Aizer AA, Falit B, Mendu ML. et al. Cancer-specific outcomes among young adults without health insurance. J Clin Oncol. 2014;32(19):2025-2030
17. Howlader N, Ries LA, Mariotto AB, Reichman ME, Ruhl J, Cronin KA. Improved estimates of cancer-specific survival rates from population-based data. J Natl Cancer Inst. 2010;102(20):1584-1598
18. Kozak KR, Mahadevan A, Moody JS. Adult gliosarcoma: epidemiology, natural history, and factors associated with outcome. Neuro Oncol. 2009;11:183-91
19. Zhang AS, Ostrom QT, Kruchko C, Rogers L, Peereboom DM, Barnholtz-Sloan JS. Complete prevalence of malignant primary brain tumors registry data in the United States compared with other common cancers, 2010. Neuro Oncol. 2017;19(5):726-735
20. Subramanian A, Harris A, Piggott K, Shieff C, Bradford R. Metastasis to and from the central nervous system-the 'relatively protected site'. Lancet Oncol. 2002;3(8):498-507
21. Ernestus RI, Wilcke O. Spinal metastases of intracranial ependymomas. Four case reports and review of the literature. Neurosurg Rev. 1990;13(2):147-154
22. Foreman NK, Love S, Thorne R. Intracranial ependymomas: analysis of prognostic factors in a population-based series. Pediatr Neurosurg. 1996;24(3):119-125
23. Chamberlain MC. Ependymomas. Curr Neurol Neurosci Rep. 2003;3(3):193-199
24. Geyer JR, Sposto R, Jennings M. et al. Multiagent chemotherapy and deferred radiotherapy in infants with malignant brain tumors: a report from the Children's Cancer Group. J Clin Oncol. 2005;23(30):7621-7631
25. Houston SC, Crocker IR, Brat DJ, Olson JJ. Extraneural metastatic glioblastoma after interstitial brachytherapy. Int J Radiat Oncol Biol Phys. 2000;48(3):831-836
26. O'Dorisio MS, Khanna G, Bushnell D. Combining anatomic and molecularly targeted imaging in the diagnosis and surveillance of embryonal tumors of the nervous and endocrine systems in children. Cancer Metastasis Rev. 2008;27(4):665-677
27. Thompson EM, Hielscher T, Bouffet E. et al. Prognostic value of medulloblastoma extent of resection after accounting for molecular subgroup: a retrospective integrated clinical and molecular analysis. Lancet Oncol. 2016;17(4):484-495
Author contact
![]() Corresponding author: Jie Ma, Department of Pediatric Neurosurgery, Xinhua Hospital Affiliated to Shanghai Jiao Tong University School of Medicine, Shanghai 200092, China; majiecom.cn or majie3004com and Michael D. Taylor, The Hospital for Sick Children, 555 University Avenue, M5G1X8, Ontario Canada; mdtaylorca
Corresponding author: Jie Ma, Department of Pediatric Neurosurgery, Xinhua Hospital Affiliated to Shanghai Jiao Tong University School of Medicine, Shanghai 200092, China; majiecom.cn or majie3004com and Michael D. Taylor, The Hospital for Sick Children, 555 University Avenue, M5G1X8, Ontario Canada; mdtaylorca
Citation styles
APA
Lian, H., Daniels, C., Han, Y.P., Li, Q.F., Zhao, Y., Wang, B.C., Zhu, C.B., Mao, W.W., Taylor, M.D., Ma, J. (2019). Incidence of metastatic disease and survival among patients with newly diagnosed primary CNS tumors in the United States from 2004-2013. Journal of Cancer, 10(13), 3037-3045. https://doi.org/10.7150/jca.30624.
ACS
Lian, H.; Daniels, C.; Han, Y.P.; Li, Q.F.; Zhao, Y.; Wang, B.C.; Zhu, C.B.; Mao, W.W.; Taylor, M.D.; Ma, J. Incidence of metastatic disease and survival among patients with newly diagnosed primary CNS tumors in the United States from 2004-2013. J. Cancer 2019, 10 (13), 3037-3045. DOI: 10.7150/jca.30624.
NLM
Lian H, Daniels C, Han YP, Li QF, Zhao Y, Wang BC, Zhu CB, Mao WW, Taylor MD, Ma J. Incidence of metastatic disease and survival among patients with newly diagnosed primary CNS tumors in the United States from 2004-2013. J Cancer 2019; 10(13):3037-3045. doi:10.7150/jca.30624. https://www.jcancer.org/v10p3037.htm
CSE
Lian H, Daniels C, Han YP, Li QF, Zhao Y, Wang BC, Zhu CB, Mao WW, Taylor MD, Ma J. 2019. Incidence of metastatic disease and survival among patients with newly diagnosed primary CNS tumors in the United States from 2004-2013. J Cancer. 10(13):3037-3045.
This is an open access article distributed under the terms of the Creative Commons Attribution (CC BY-NC) license (https://creativecommons.org/licenses/by-nc/4.0/). See http://ivyspring.com/terms for full terms and conditions.