Journal of Cancer
ISSN: 1837-9664
3.2
Impact Factor
ISSN: 1837-9664

 Global reach, higher impact
J Cancer 2019; 10(14):3145-3153. doi:10.7150/jca.30371 This issue Cite
Research Paper
Comparison on Clinicopathological Features, Treatments and Prognosis between Proximal Gastric Cancer and Distal Gastric Cancer: A National Cancer Data Base Analysis
Xiang Wang1,2*, Fangfang Liu3*, Yumin Li2*, Song Tang1,2, Yawei Zhang4,5, Yingtai Chen1 ![]() , Sajid A. Khan4
, Sajid A. Khan4 ![]()
1. National Cancer Center/National Clinical Research Center for Cancer/Cancer Hospital, Chinese Academy of Medical Sciences and Peking Union Medical College, Beijing 100021, China
2. Lanzhou University Second Hospital, Lanzhou 730030, China
3. 302 Military Hospital of China, Beijing 100039, China
4. Department of Surgery, Yale School of Medicine, New Haven, CT 06520, United States
5. Department of Environmental Health Sciences, Yale School of Public Health, New Haven, CT 06520, United States
*These authors contributed equally.
Received 2018-10-2; Accepted 2019-4-11; Published 2019-6-2
Citation:
Wang X, Liu F, Li Y, Tang S, Zhang Y, Chen Y, Khan SA. Comparison on Clinicopathological Features, Treatments and Prognosis between Proximal Gastric Cancer and Distal Gastric Cancer: A National Cancer Data Base Analysis. J Cancer 2019; 10(14):3145-3153. doi:10.7150/jca.30371. https://www.jcancer.org/v10p3145.htm
Other stylesAbstract
Background: The aim of this study was to examine the differences in clinicopathological features, treatment strategies and prognosis between patients with proximal gastric cancer (PGC) and distal gastric cancer (DGC).
Methods: Patients with gastric adenocarcinoma were identified from the National Cancer Database during the years 2004-2015. Survival analysis was performed via Kaplan-Meier and Cox proportional hazards models.
Results: A total of 97,060 patients were identified with gastric adenocarcinoma. DGC was associated with older age, more advanced tumor stage, and poorly differentiated tumors compared with PGC (all p<0.01). In the multivariate analysis, patients with DGC had a worse prognosis compared with those with PGC. In early and locally advanced stage, the prognosis of DGC was better compared with PGC. In distant metastasis stage, the prognosis of DGC was worse compared with PGC. Compared with patients underwent gastrectomy who received adjuvant therapy (AT) in locally advanced stage, a survival benefit was seen for DGC patients who received neoadjuvant therapy (NAT) or NAT plus AT, whereas PGC patients with locally advanced disease did not share this result (p>0.05).
Conclusion: PGC and DGC differed in their clinicopathologic characteristics and prognosis and heterogeneity may be due to differences in tumor biology. Tumor location should be taken into consideration when stratifying patients for optimal therapeutic strategies.
Keywords: gastric cancer, clinicopathologic features, prognosis, distal gastric cancer, proximal gastric cancer
Introduction
Gastric cancer (GG) is the second leading cause of cancer-related mortality and the fourth most common cancer globally1. Since the 1970s, there has been a persistent trend in the increasing percentage of proximal gastric cancer (PGC) with an associated decreasing percentage of distal gastric cancer (DGC) in western countries2-6. Epidemiological studies proposed that PGC seems to have different etiology and biological behavior from DGC7.
Recent reports have demonstrated that PGC and DGC exhibit different clinicopathological and biological characteristics8, 9. For example, Fabio et al. 10 reported PGC were associated with more advanced tumor stage and older age; Kin et al. 8 found that PGC tended to have a poorly differentiated type than DGC. Moreover, data regarding prognosis in PGC versus DGC are conflicting. Some studies have reported a significantly shorter overall survival (OS) in PGC patients10-12, whereas others found no significant differences in prognosis of PGC and DGC9, 13. Katsuhiko et al14 even demonstrated a long-term survival in patients with PGC than in those with DGC.
As such, the aim of the present study is to investigate differences in clinicopathological characteristics, treatment strategies and prognosis of PGC in comparison with DGC, using the National Cancer Data Base (NCDB). We also sought prognostic factors in relation to the location of the primary lesion to aid in the selection of optimal adjuvant treatment for patients with GC.
Patients and Methods
Data source
The NCDB is a national hospital-based registry jointly sponsored by the American College of Surgeons and the American Cancer Society. It collects data from more than 1,500 Commission on Cancer-accredited facilities and captures approximately 70% of incident cancers in the United States annually. The study was reviewed by the Yale Institutional Review Board and was exempt from review as a secondary data analysis.
Study population
The study population consisted of 97,060 patients who were diagnosed with GC from the years 2004-2015. This data set was limited to patients with gastric adenocarcinoma according to International Classification of Diseases for Oncology codes C16.0 to C16.9.
Study variables
The main exposure variable was PGC/DGC. PGC was defined as tumors with the epicenter located in cardia (C16.0) or fundus (C16.1), whereas DGC was defined as lesions of the body (C16.2), antrum (C16.3) or pylorus (C16.4). Other baseline patient/tumor characteristic variables that were collected included the age group (<50, 50-64, 65-74, >=75 years), sex (male, female), race (white, black), Hispanic ethnicity (non-Hispanic, Hispanic, other), facility type(non-academic, academic), insurance (uninsured, private insurance, Medicaid, Medicare, other, unknown), median income ($) (<38,000, 38,000-47,999, 48,000-62,999, 63,000+, unknown), circle distance (miles) (less than 50, greater than 50, unknown), Carlson-Deyo score (0, 1, 2, 3), clinical and pathologic TNM categories (as defined by the American Joint Committee on Cancer staging manual), number of nodes examined (0-15 nodes, >15 nodes), number of nodes positive (0 nodes, 1-2 nodes, 3-6 nodes, 7-15 nodes, 16 or more nodes), scope of regional lymph node surgery (whether or not to underwent lymphadenectomy) (no, yes), and tumor grade (well, moderately, poorly, undifferentiated/anaplastic,). Characteristics of surgical treatment variables included type of gastrectomy (gastrectomy-partial, near-total/total gastrectomy, gastrectomy with esophagus, gastrectomy with other organs, gastrectomy (NOS), no surgery), and surgical margin (R0, R1, R2). Short-term outcome variables in secondary analyses included the following: surgical inpatient stay (days) (0-5, 6-7, 8-11, >=12, unknown), 30-day unplanned readmission (no unplanned readmission, unplanned readmission, unknown). OS served as the primary endpoint of the study, and follow-up time was calculated based on the month.
Statistical analyses
All analysis was done using SAS software v9.3 (SAS Institute, Inc., Cary, NC). Categorical variables were compared using Chi-square test while continuous variables were compared using student T-test. Kaplan-Meier and log-rand test was used to examine OS by GC subtype and treatment type. Cox-regression survival analysis was used to identify predictors of OS. The proportionality assumption of the cox-regression was checked by including a time-varying covariate, an interaction between the covariate and the event time. Hazard ratio (HR) and 95% confidence interval (CI) were used to measure the risk of death. A p-value less than 0.05 was considered statistically significant and all tests were two-sided.
Results
Patient characteristics
Patient characteristics at time of diagnosis were summarized in supplementary Table 1. Of the 97,060 GC patients, 60,513 (62.3%) were PGC and 36,547 (37.7%) were DGC. Patients diagnosed with GC had a mean age of 67.66 years with majority of them being male (68.95 %), white (80.31 %), and non-Hispanic (91.55 %). Compared to patients with DGC, patients with PGC were more likely to be younger (66.68 ± 12.45 years vs 69.28 ± 14.20, p < 0.01), male (77.46% vs.54.85%, p<0.01), and white (89.95% vs.64.34%, p<0.01). Patients with PGC were also more likely to have private insurance, higher income, traveled a longer distance to hospitals, and be treated in academic hospitals compared to patients with DGC. Patients with PGC had lower Carlson scores, clinical and pathological TNM categories and the number of lymph nodes being examined and positive compared to patients with DGC. In terms of surgical treatment, PGC patients were less likely to have surgical treatment (36.61% vs. 51.97%, p < 0.01) compared to DGC patients. Among surgically treated patients, a higher proportion of PGC patients received R0 resection, stayed longer in the hospital, and had no unplanned 30-day readmission compared to DGC patients.
Table 1
Characteristics of Gastric Adenocarcinoma by Tumor Location
| Characteristic | Total (97,060) | PGC group(n=60,513) | DGC group (n=36,547) | P value | ||||
|---|---|---|---|---|---|---|---|---|
| Number | % | Number | % | Number | % | |||
| Mean | SD | Mean | SD | Mean | SD | |||
| Age | 67.66 | 13.20 | 66.68 | 12.45 | 69.28 | 14.20 | <.0001 | |
| Age (y) | ||||||||
| <50 | 9037 | 9.31 | 5342 | 8.83 | 3695 | 10.11 | ||
| 50-64 | 28703 | 29.57 | 19910 | 32.90 | 8793 | 24.06 | ||
| 65-74 | 26594 | 27.40 | 17782 | 29.39 | 8812 | 24.11 | ||
| >=75 | 32726 | 33.72 | 17479 | 28.88 | 15247 | 41.72 | <0.0001 | |
| Gender | ||||||||
| Male | 66920 | 68.95 | 46873 | 77.46 | 20047 | 54.85 | ||
| Female | 30140 | 31.05 | 13640 | 22.54 | 16500 | 45.15 | <0.0001 | |
| Race | ||||||||
| White | 77946 | 80.31 | 54432 | 89.95 | 23514 | 64.34 | ||
| Black | 11431 | 11.78 | 3492 | 5.77 | 7939 | 21.72 | ||
| Other | 7683 | 7.92 | 2589 | 4.28 | 5094 | 13.94 | <0.0001 | |
| Hispanic ethnicity | ||||||||
| Non-Hispanic | 84059 | 86.61 | 54135 | 89.46 | 29924 | 81.88 | ||
| Hispanic | 7760 | 8.00 | 2949 | 4.87 | 4811 | 13.16 | ||
| Unknown | 5241 | 5.40 | 3429 | 5.67 | 1812 | 4.96 | <0.0001 | |
| Insurance | ||||||||
| Uninsured | 3404 | 3.51 | 1742 | 2.88 | 1662 | 4.55 | ||
| Private Insurance | 30982 | 31.92 | 21343 | 35.27 | 9639 | 26.37 | ||
| Medicaid | 6259 | 6.45 | 3145 | 5.20 | 3114 | 8.52 | ||
| Medicare | 52886 | 54.49 | 31902 | 52.72 | 20984 | 57.42 | ||
| Other | 1265.00 | 1.3 | 943 | 1.56 | 322 | 0.88 | ||
| Unknown | 2264 | 2.33 | 1438 | 2.38 | 826 | 2.26 | <0.0001 | |
| Median income ($) | ||||||||
| <38,000 | 17258 | 17.78 | 9019 | 14.90 | 8239 | 22.54 | ||
| 38,000-47,999 | 22216 | 22.89 | 14128 | 23.35 | 8088 | 22.13 | ||
| 48,000-62,999 | 25720 | 26.50 | 16627 | 27.48 | 9093 | 24.88 | ||
| 63,000+ | 30185 | 31.10 | 19750 | 32.64 | 10435 | 28.55 | ||
| Unknown | 1681 | 1.73 | 989 | 1.63 | 692 | 1.89 | <0.0001 | |
| Circle distance (miles) | ||||||||
| Less than 50 | 83870 | 86.41 | 50971 | 84.23 | 32899 | 90.02 | ||
| Greater than 50 | 11536 | 11.89 | 8577 | 14.17 | 2959 | 8.10 | ||
| Unknown | 1654 | 1.70 | 965 | 1.59 | 689 | 1.89 | <0.0001 | |
| Facility type | ||||||||
| Non-academic | 57028 | 58.76 | 35349 | 58.42 | 21679 | 59.32 | ||
| Academic | 37638 | 38.78 | 23913 | 39.52 | 13725 | 37.55 | ||
| Other | 2394 | 2.47 | 1251 | 2.07 | 1143 | 3.13 | <0.0001 | |
| Charlson score | ||||||||
| 0 | 66532 | 68.55 | 42416 | 70.09 | 24116 | 65.99 | ||
| 1 | 21697 | 22.35 | 13061 | 21.58 | 8636 | 23.63 | ||
| 2 | 6209 | 6.40 | 3545 | 5.86 | 2664 | 7.29 | ||
| 3 | 2622 | 2.70 | 1491 | 2.46 | 1131 | 3.09 | <0.0001 | |
| Clinical T | ||||||||
| T0 | 1092 | 1.13 | 659 | 1.09 | 433 | 1.18 | ||
| T1 | 14016 | 14.44 | 8884 | 14.68 | 5132 | 14.04 | ||
| T2 | 9735 | 10.03 | 6578 | 10.87 | 3157 | 8.64 | ||
| T3 | 21472 | 22.12 | 16812 | 27.78 | 4660 | 12.75 | ||
| T4 | 7858 | 8.10 | 3915 | 6.47 | 3943 | 10.79 | ||
| Unknown | 42887 | 44.19 | 23665 | 39.11 | 19577 | 53.57 | <0.0001 | |
| Clinical N | ||||||||
| c0 | 36270 | 37.37 | 21864 | 36.13 | 14406 | 39.42 | ||
| c1 | 22747 | 23.44 | 17175 | 28.38 | 5572 | 15.25 | ||
| c2 | 5048 | 5.20 | 3585 | 5.92 | 1463 | 4.00 | ||
| c3 | 2284 | 2.35 | 1490 | 2.46 | 794 | 2.17 | ||
| Unknown | 30711 | 31.64 | 16399 | 27.10 | 14312 | 39.16 | <0.0001 | |
| Clinical M | ||||||||
| c0 | 71684 | 73.86 | 43961 | 72.65 | 27723 | 75.86 | ||
| c1 | 25376 | 26.14 | 16552 | 27.35 | 8824 | 24.14 | <.0001 | |
| CTNM | ||||||||
| I | 15513 | 15.98 | 9807 | 16.21 | 5706.00 | 15.61 | ||
| II | 11262 | 11.60 | 7925 | 13.10 | 3337.00 | 9.13 | ||
| III | 12388 | 12.76 | 9790 | 16.18 | 2598.00 | 7.11 | ||
| IV | 26144 | 26.94 | 16826 | 27.81 | 9318.00 | 25.5 | <.0001 | |
| Unknown | 31753 | 32.71 | 16165 | 26.71 | 15588.00 | 42.65 | ||
| Pathologic T | ||||||||
| p0 | 2053 | 2.12 | 1650 | 2.73 | 403 | 1.10 | ||
| p1 | 10230 | 10.54 | 6049 | 10.00 | 4181 | 11.44 | ||
| p2 | 9365 | 9.65 | 4897 | 8.09 | 4468 | 12.23 | ||
| p3 | 13943 | 14.37 | 8458 | 13.98 | 5485 | 15.01 | ||
| p4 | 5102 | 5.26 | 1344 | 2.22 | 3758 | 10.28 | ||
| Unknown | 56367 | 58.07 | 38426 | 63.50 | 18492 | 50.60 | <0.0001 | |
| Pathologic N | ||||||||
| p0 | 18111 | 18.66 | 10693 | 17.67 | 7418 | 20.30 | ||
| p1 | 11336 | 11.68 | 6577 | 10.87 | 4759 | 13.02 | ||
| p2 | 5741 | 5.91 | 2756 | 4.55 | 2985 | 8.17 | ||
| p3 | 3918 | 4.04 | 1494 | 2.47 | 2424 | 6.63 | ||
| Unknown | 57954 | 59.71 | 38993 | 64.44 | 18961 | 51.88 | <0.0001 | |
| Pathologic M | ||||||||
| p0 | 89051 | 91.75 | 56140.00 | 92.77 | 32911 | 90.05 | ||
| p1 | 8009 | 8.25 | 4373.00 | 7.23 | 3636 | 9.95 | <.0001 | |
| PTNM | ||||||||
| I | 13959 | 14.38 | 8251.00 | 13.64 | 5708.00 | 15.62 | ||
| II | 12957 | 13.35 | 7762.00 | 12.83 | 5195.00 | 14.21 | ||
| III | 5306 | 5.47 | 1923.00 | 3.18 | 3383.00 | 9.26 | ||
| IV | 8009 | 8.25 | 4373.00 | 7.23 | 3636.00 | 9.95 | ||
| Unknown | 56829 | 58.55 | 38204.00 | 63.13 | 18625.00 | 50.96 | <.0001 | |
| Number of nodes examined | ||||||||
| 0-15 nodes | 75162 | 77.44 | 47814 | 79.01 | 27348 | 74.83 | ||
| >15 nodes | 17239 | 17.76 | 9392 | 15.52 | 7847 | 21.47 | ||
| Other | 4659 | 4.80 | 3307 | 5.46 | 1352 | 3.70 | <0.0001 | |
| Number of nodes positive | ||||||||
| 0 nodes | 18844 | 19.41 | 11108 | 18.36 | 7736 | 21.17 | ||
| 1-2 nodes | 8798 | 9.06 | 5284 | 8.73 | 3514 | 9.62 | ||
| 3-6 nodes | 6834 | 7.04 | 3585 | 5.92 | 3249 | 8.89 | ||
| 7-15 nodes | 5165 | 5.32 | 2236 | 3.70 | 2929 | 8.01 | ||
| 16 or more nodes | 1725 | 1.78 | 617 | 1.02 | 1108 | 3.03 | ||
| Other | 55694 | 57.38 | 37683 | 62.27 | 18011 | 49.28 | <0.0001 | |
| Scope of regional lymph node surgery | ||||||||
| No | 54512 | 56.16 | 36805 | 60.82 | 17707 | 48.45 | ||
| Yes | 41193 | 42.44 | 22759 | 37.61 | 18434 | 50.44 | ||
| Unknown | 1355 | 1.40 | 949 | 1.57 | 406 | 1.11 | <0.0001 | |
| Tumor grade | ||||||||
| Well | 4345 | 4.48 | 2907 | 4.80 | 1438 | 3.93 | ||
| Moderately | 26426 | 27.23 | 18040 | 29.81 | 8386 | 22.95 | ||
| Poorly | 49420 | 50.92 | 28402 | 46.94 | 21018 | 57.51 | ||
| Undifferentiated; anaplastic | 1245 | 1.28 | 705 | 1.17 | 540 | 1.48 | ||
| Unknown | 15624 | 16.1 | 10459 | 17.28 | 5165 | 14.13 | <0.0001 | |
| Stage | ||||||||
| Early stage | 6619 | 6.82 | 3481 | 5.75 | 3138 | 8.59 | ||
| LAGC | 28779 | 29.65 | 16479 | 27.23 | 12300 | 33.66 | ||
| Distant | 28142 | 28.99 | 17777 | 29.38 | 10365 | 28.36 | <.0001 | |
| Type of gastrectomy | ||||||||
| Gastrectomy-partial | 18382 | 18.94 | 18382 | 18.94 | 13526 | 37.01 | ||
| Near-total or total gastrectomy | 4098 | 4.22 | 4098 | 4.22 | 2007 | 5.49 | ||
| Gastrectomy with esophagus | 14288 | 14.72 | 14288 | 14.72 | 1496 | 4.09 | ||
| Gastrectomy with other organs | 3974 | 4.09 | 3974 | 4.09 | 1830 | 5.01 | ||
| Gastrectomy, NOS | 408 | 0.42 | 408 | 0.42 | 136 | 0.37 | ||
| No surgery | 55910 | 57.6 | 38358 | 63.39 | 17552 | 48.03 | <.0001 | |
| Surgical Margin | ||||||||
| R0 | 36951 | 38.07 | 20969 | 34.65 | 15982 | 43.73 | ||
| R1 | 3332 | 3.43 | 1715 | 2.83 | 1617 | 4.42 | ||
| R2 | 2732 | 2.81 | 1283 | 2.12 | 1449 | 3.96 | ||
| Unknown | 54045 | 55.68 | 36546 | 60.39 | 17499 | 47.88 | <.0001 | |
| Surgical Inpatient stay (days) | ||||||||
| 0-5 | 8368 | 8.62 | 4423 | 7.31 | 3945 | 10.79 | ||
| 6-7 | 7517 | 7.74 | 3031 | 5.01 | 4486 | 12.27 | ||
| 8-11 | 12534 | 12.91 | 7386 | 12.21 | 5148 | 14.09 | ||
| >=12 | 11637 | 11.99 | 7429 | 12.28 | 4208 | 11.51 | ||
| Unknown | 57004 | 58.73 | 38244 | 63.2 | 18760 | 51.33 | <.0001 | |
| 30-day unplanned readmission | ||||||||
| No unplanned readmission | 91354 | 94.12 | 57231 | 94.58 | 34123 | 93.37 | ||
| Unplanned readmission | 3199 | 3.3 | 1769 | 2.92 | 1430 | 3.91 | ||
| Unknown | 2507 | 2.58 | 1513 | 2.5 | 994 | 2.72 | <.0001 | |
Figure 1
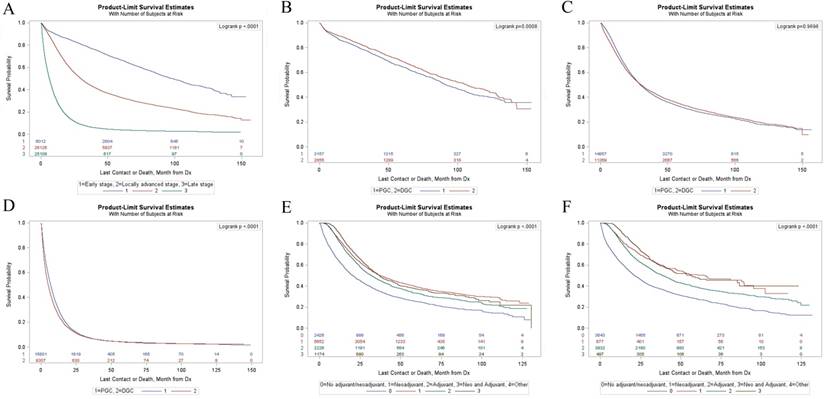
(A) Kaplan-Meier survival analyses of all patients with different stages. (B) Kaplan-Meier survival analyses of PGC group and DGC group in early stage. (C) Kaplan-Meier survival analyses of PGC group and DGC group in locally advanced stage. (D) Kaplan-Meier survival analyses of PGC group and DGC group in distant metastasis stage. (E) Kaplan-Meier survival analyses of LAPGC with gastrectomy stratified according to different adjuvant therapy. (F) Kaplan-Meier survival analyses of LADGC with gastrectomy stratified according to different adjuvant therapy.
Survival Outcomes
Kaplan-Meier survival estimates for GC in different stages were shown in Figure 1A. The median survival time of patients with GC were 98.53 months in early stage, 29.7 months in locally advanced stage and 6.21 months in distant metastasis stage (p<0.01) (Table S1). PGC patients in early stage had a significantly shorter survival compared with DGC patients (p<0.01) (Figure 1B) with a median survival time of 91.83 months and 106.55 months respectively (supplementary Table S2). There were no significant differences (p=0.97) in OS between the two groups in locally advanced stage (Figure 1C). For patients with distant metastases, the PGC group had a longer survival compared with the DGC group (p<0.01) (Figure 1D) with a median survival time of 13.85 months and 12.24 months respectively (supplementary Table S2).
Figure 1E and 1F showed the survival curves for PGC and DGC patients in locally advanced stage underwent gastrectomy according to different adjuvant therapy. Among locally advanced proximal gastric cancer (LAPGC) patients underwent gastrectomy, the median survival time were 20.63 months, 37.36 months, 32.13 months, and 37.16 months in gastrectomy alone group, neoadjuvant therapy (NAT) group, adjuvant therapy (AT) group, and NAT plus AT group, respectively (supplementary Table S3). Among locally advanced distal gastric cancer (LADGC) patients underwent gastrectomy, the median survival time were 21.36 months in gastrectomy alone group, 64.3 months in NAT group, 38.9 months in AT group, and 56.31 months in NAT plus AT group (supplementary Table S3).
Prognostic Factors
In multivariate analysis, DGC (HR, 1.07; 95% CI, 1.05-1.10; p<0.01), local advanced stage (HR, 2.32; 95%, CI 2.21-2.43; p<0.01), and distant metastatic stage (HR, 5.03;95% CI, 4.76-5.31; p<0.01) were significant predictors for poor survival in GC patients (Table 2). Compared to PGC, DGC was associated with improved survival in early stage (HR, 0.82; 95% CI, 0.74-0.91; p<0.01) and local advance stage (HR, 0.94; 95% CI,0.90-0.97; p<0.05), while DGC was associated with poor survival in distant metastatic stage (HR, 1.19; 95% CI,1.16-1.23; p<0.01) (Table 3).
Table 2
Multivariate analysis of GC after stratification by location and clinical stage.
| Adjusted | |||||||
|---|---|---|---|---|---|---|---|
| HR | 95%CI | P Value | |||||
| Prognostic Factors | Number | % | Lower | Upper | |||
| Location | |||||||
| PGC | 54434 | 62.06 | Ref | ||||
| DGC | 33279 | 37.94 | 1.07 | 1.05 | 1.10 | <0.01 | |
| Stage | 57246 | ||||||
| Early | 6012 | 10.50 | Ref | ||||
| Local advanced | 26126 | 45.64 | 2.32 | 2.21 | 2.43 | <0.01 | |
| Distant metastatic | 25108 | 43.86 | 5.03 | 4.76 | 5.31 | <0.01 | |
Adjust for age sex race Hispanic INSURANCE CDCC YEAR_OF_DIAGNOSIS income FLOC FTYPE distance grade RX_SUMM_SCOPE_REG_LN_SUR margin stay readm.
Abbreviations: GC, gastric cancer; PGC, proximal gastric cancer; DGC distal gastric cancer; HR, hazard ratio; CI, confidence interval.
Table 3
Multivariate analysis between PGC and DGC after stratification by clinical stage
| Adjusted | |||||||
|---|---|---|---|---|---|---|---|
| HR | 95%CI | P Value | |||||
| Prognostic Factors | Number | % | Lower | Upper | |||
| Early stage | |||||||
| PGC | 3157 | 52.51 | ref | ||||
| DGC | 2855 | 47.49 | 0.82 | 0.74 | 0.91 | <0.01 | |
| Local advanced | |||||||
| PGC | 14857 | 56.87 | ref | ||||
| DGC | 11269 | 43.13 | 0.94 | 0.90 | 0.97 | <0.01 | |
| Distant metastatic | |||||||
| PGC | 15801 | 62.93 | ref | ||||
| DGC | 9307 | 37.07 | 1.19 | 1.16 | 1.23 | <0.01 | |
Adjust for age sex race Hispanic INSURANCE CDCC YEAR_OF_DIAGNOSIS income FLOC FTYPE distance grade RX_SUMM_SCOPE_REG_LN_SUR margin stay readm
Abbreviations: PGC, proximal gastric cancer; DGC distal gastric cancer; HR, hazard ratio; CI, confidence interval.
In PGC patients with local advanced stage underwent gastrectomy (Table 4), NAT (HR,0.80; 95%, CI 0.75-0.85; p<0.01), AT (HR,0.79; 95%, CI 0.73-0.85; p <0.01), and NAT plus AT (HR, 0.79; 95%, CI 0.72-0.87; p<0.01) were all independent predictors of better OS, and no differences in survival between different adjuvant therapies were observed (p>0.05). In DGC patients with local advanced stage underwent gastrectomy (Table 4), subjects with NAT (HR, 0.62; 95%, CI 0.54-0.70; p<0.01), AT (HR, 0.72; 95%, CI 0.68-0.77; p<0.01), and NAT plus AT (HR, 0.61; 95%, CI 0.53-0.71; p<0.01) had lower HRs than those underwent gastrectomy alone, and no differences in survival between NAT and NAT plus AT, but better survival of NAT or NAT plus AT than AT were observed.
After stratification by detailed adjuvant therapy, preoperative chemotherapy only (CT) (HR, 0.79; 95%, CI 0.71-0.87; p<0.01), postoperative CT (HR, 0.84; 95%, CI 0.75-0.93; p<0.01), pre- and post-operative CT (HR, 0.70; 95%, CI 0.60-0.82; p<0.01), preoperative CT plus radiotherapy (RT) (HR, 0.80; 95%, CI 0.75-0.85; p<0.01), preoperative CT plus RT and postoperative CT (HR, 0.79; 95%, CI 0.69-0.91; p<0.01), postoperative CT plus RT (HR, 0.75; 95%, CI 0.70-0.82; p<0.01), and preoperative CT and postoperative CT plus RT (HR, 0.73; 95%, CI 0.57-0.94; p<0.01) were associated with improved survival in LAPGC patients underwent gastrectomy (Table 5). Preoperative CT (HR, 0.57; 95%, CI 0.50-0.66; p<0.01), postoperative CT (HR, 0.82; 95%, CI 0.75-0.90; p<0.01), pre- and post-operative CT (HR, 0.50; 95%, CI 0.41-0.61; p<0.01), postoperative CT plus RT (HR, 0.67; 95%, CI 0.62-0.72; p<0.01), and postoperative CT plus RT (HR, 0.67; 95%, CI 0.62-0.72; p<0.01) were associated with improved survival in LADGC patients underwent gastrectomy (Table 5). Prognosis for patients treated with pre- and post-operative CT was significant better than for patients treated with other therapies in LAPGC and LADGC patients underwent gastrectomy.
Table 4
Multivariate analysis of LAPGC and LADGC patients underwent gastrectomy after stratification by different adjuvant therapies.
| PGC | DGC | |||||||||||||
|---|---|---|---|---|---|---|---|---|---|---|---|---|---|---|
| HR | 95%CI | P value | HR | 95%CI | P Value | |||||||||
| Prognostic Factors | Number | % | Lower | Upper | Number | % | Lower | Upper | ||||||
| Therapy | 11478 | 8749 | ||||||||||||
| No NAT/AT | 2426 | 21.14 | Ref | 3643 | 41.64 | Ref | ||||||||
| NAT | 5652 | 49.24 | 0.80 | 0.75 | 0.85 | <0.01 | 677 | 7.74 | 0.61 | 0.54 | 0.70 | <0.01 | ||
| AT | 2226 | 19.39 | 0.79 | 0.73 | 0.85 | <0.01 | 3932 | 44.94 | 0.72 | 0.68 | 0.77 | <0.01 | ||
| NAT plus AT | 1174 | 10.23 | 0.79 | 0.72 | 0.87 | <0.01 | 497 | 5.68 | 0.61 | 0.53 | 0.71 | <0.01 | ||
| No NAT/AT | 1.25 | 1.17 | 1.33 | <0.01 | 1.62 | 1.43 | 1.84 | <0.01 | ||||||
| NAT | Ref | Ref | ||||||||||||
| AT | 0.99 | 0.92 | 1.05 | 0.67 | 1.62 | 1.43 | 1.84 | 0.02 | ||||||
| NAT plus AT | 0.10 | 0.91 | 1.08 | 0.82 | 0.99 | 0.83 | 1.19 | 0.92 | ||||||
| No NAT/AT | 1.27 | 1.18 | 1.36 | <0.01 | 1.39 | 1.31 | 1.48 | <0.01 | ||||||
| NAT | 1.01 | 0.95 | 1.08 | 0.67 | 0.86 | 0.76 | 0.97 | 0,02 | ||||||
| AT | Ref | Ref | ||||||||||||
| NAT plus AT | 1.00 | 0.91 | 1.10 | 0.93 | 0.85 | 0.73 | 0.98 | 0.03 | ||||||
| No NAT/AT | 1.26 | 1.15 | 1.39 | <0.01 | 1.64 | 1.41 | 1.9 | <0.01 | ||||||
| NAT | 1.01 | 0.93 | 1.1 | 0.82 | 1.01 | 0.84 | 1.21 | 0.92 | ||||||
| AT | 0.10 | 0.91 | 1.09 | 0.93 | 1.18 | 1.02 | 1.36 | 0.03 | ||||||
| NAT plus AT | ref | ref | ||||||||||||
Adjust for age sex race Hispanic INSURANCE CDCC YEAR_OF_DIAGNOSIS income FLOC FTYPE distance grade RX_SUMM_SCOPE_REG_LN_SUR margin stay readm.
Abbreviations: LAPGC, locally advanced proximal gastric cancer; LADGC, locally advanced distal gastric cancer; HR, hazard ratio; NAT, neoadjuvant therapy; AT, adjuvant therapy.
Table 5
Multivariate analysis of LAPGC and LADGC patients underwent gastrectomy after stratification by different detailed adjuvant therapies.
| PGC | DGC | |||||||||||||
|---|---|---|---|---|---|---|---|---|---|---|---|---|---|---|
| Number | % | HR | 95%CI | P value | Number | % | HR | 95%CI | P Value | |||||
| Prognostic Factors | Lower | Upper | Lower | Upper | ||||||||||
| Therapy | ||||||||||||||
| No CT/RT | 2426 | 21.22 | ref | 3643 | 41.64 | ref | ||||||||
| Pre-op CT only | 888 | 7.77 | 0.79 | 0.71 | 0.87 | <0.01 | 580 | 6.63 | 0.57 | 0.50 | 0.66 | <0.01 | ||
| Post-op CT only | 669 | 5.85 | 0.84 | 0.75 | 0.93 | <0.01 | 1103 | 12.61 | 0.82 | 0.75 | 0.90 | <0.01 | ||
| Pre and post-operative CT only | 355 | 3.10 | 0.70 | 0.60 | 0.82 | <0.01 | 312 | 3.57 | 0.50 | 0.41 | 0.61 | <0.01 | ||
| Pre-op RT only | 35 | 0.31 | 0.94 | 0.62 | 1.41 | 0.75 | 3 | 0.03 | 1.06 | 0.26 | 4.27 | 0.93 | ||
| Pre-op CT plus RT | 4729 | 41.36 | 0.80 | 0.75 | 0.85 | <0.01 | 94 | 1.07 | 0.85 | 0.65 | 1.11 | 0.23 | ||
| Pre-op RT and post-op CT | 68 | 0.59 | 0.88 | 0.65 | 1.19 | 0.41 | 6 | 0.07 | 0.38 | 0.09 | 1.51 | 0.17 | ||
| Pre-op RT plus CT and post-op CT | 438 | 3.83 | 0.79 | 0.69 | 0.91 | <0.01 | 20 | 0.23 | 0.57 | 0.29 | 1.15 | 0.12 | ||
| Post-op RT only | 78 | 0.68 | 1.07 | 0.83 | 1.38 | 0.61 | 115 | 1.31 | 1.05 | 0.85 | 1.31 | 0.65 | ||
| Pre-op CT and post-op RT | 153 | 1.34 | 0.82 | 0.66 | 1.01 | 0.06 | 71 | 0.81 | 0.79 | 0.57 | 1.10 | 0.16 | ||
| Post-op CT plus RT | 1479 | 12.93 | 0.75 | 0.70 | 0.82 | <0.01 | 2714 | 31.02 | 0.67 | 0.62 | 0.72 | <0.01 | ||
| Pre-op CT and post-op RT plus CT | 117 | 1.02 | 0.73 | 0.57 | 0.94 | 0.01 | 87 | 0.99 | 0.82 | 0.62 | 1.08 | 0.16 | ||
Abbreviations: LAPGC, locally advanced proximal gastric cancer; LADGC, locally advanced distal gastric cancer; HR, hazard ratio; CT, chemotherapy; RT, radiotherapy; Pre-op, preoperative; Post-op, postoperative.
Discussion
Our study demonstrated that PGC was more common in younger patients similar to reports by Jun et al15. In contrast, several single institutional studies have shown PGC patients were older than DGC patients4, 6, 9. Other single institutional studies, however, have reported no association between age and tumor location13, 16. Analysis of different institutional databases has resulted in varying reports regarding the association between age at diagnosis and tumor location, primarily due to the limited sample size and non-representative samples.
PGC has very often been found to be inversely related to socioeconomic status (SES)17, 18, whereas Linda et al. 19 shown that SES was not a statistically significant risk factor. Our study indicated that patients in PGC group had higher SES status reflected by higher income and private insurance. It could be due to a higher proportion of PGC patients in our study were white population. Whites were more likely to have high SES in America20, 21.
Studies investigated prognosis of PGC and DGC have reported conflicting results with a majority of studies reporting a poorer survival in PGC8, 10, 12, 15, one study reporting a worse prognosis in DGC patients14, and two studies observing no significant differences9, 13. The reported variations of prognosis between PGC and DGC might be related to differences in stage and differentiated histology in different studies8, 15. Furthermore, several studies examining proximal gastric cancers included esophageal cancer in their analyses further confounding differences. While our study supported a better survival of PGC compared to DGC in overall population, we found that PGC patients in early stage or locally advanced stage had a worse prognosis compared with DGC patients in similar stage, whereas PGC patients with distant metastasis had better prognosis than DGC with distant metastasis. Although the reason for the observed difference in survival between PGC and DGC by stage is currently unclear, we speculate that the differences in tumor biology and anatomy between PGC and DGC play a role. The intraabdominal part of the cardia and fundus are not fully covered by visceral peritoneum perhaps making early PGC more prone to infiltrate the serosa and more inclined to peritoneal metastasis compared with early DGC16. GC with distant metastases is uniformly incurable and treated primarily with CT. Therefore, a possible reason for this result is that the response to CT differs between PGC and DGC. Katsuhiko et al.14 reported that patients with PGC in distant metastasis stage had a significantly better response to CT than those with DGC.
The locally advanced stages are treated with multiple therapies22. Our study revealed a better prognosis for LAPGC and LADGC patients given additional therapy (NAT, AT, or NAT plus AT) as compared to gastrectomy alone. It is worth notice that NAT seems a useful treatment option for LADGC patients underwent gastrectomy with or without AT, whereas addition of NAT does not have any beneficial effect on survival in LAPGC patients underwent gastrectomy with AT. NAT is expected to improve the resection rate and long-term follow-up results by reducing the size of the primary lesion and controlling lymph node metastasis and micrometastasis23. Although PGC had a significantly better response to CT than DGC14, various factors, such as stomach anatomy, different lymphatic metastasis path, and technical difficulties during surgery, could be potential explanation for the weak effect of NAT on PGC patients. During the past several years, there has been increasing awareness of the documented benefits from NAT in patients with localized gastric cancer. However, few studies are available concerning the survival outcomes of specific adjuvant therapy between PGC and DGC.
Postoperative CT is delivered with an intention to reduce recurrence by controlling residual tumor cells following curative resection. Recent advances in postoperative CT have achieved considerable tumor regression in many cases of gastric cancer24. Our results support that postoperative CT was associated with improved survival in LAPGC and LADGC patients. Although the Medical Research Council Adjuvant Gastric Infusional Chemotherapy (MAGIC) trial has established Level 1 evidence for the perioperative CT25, the addition of preoperative chemotherapy did not show any benefit in the trial by the European Organization for Research and Treatment of Cancer26. In our study, preoperative CT with or without postoperative CT showed OS benefit for PGC and DGC patients with locally advanced stage underwent gastrectomy. We also observed a significant OS benefit in favor of additional CT plus RT (preoperative CT plus RT, preoperative CT plus RT and postoperative CT, postoperative CT plus RT, and preoperative CT and postoperative CT plus RT) in LAPGC patients underwent gastrectomy, whereas only postoperative CT plus RT showed OS benefit in LADGC patients. While the underlying reasons remain unclear, these results warrant further investigation and highlight the importance of potential differences in response to adjuvant therapy between LAPGC and LADGC patients.
This study has several limitations that are typical to any large, retrospective database study. These include unidentified confounding factors, missing data, and potential coding errors. Additionally, the only available survival information is overall survival, which hampered the study to investigate relapse or disease-specific survival. The NCDB also does not provide information about completeness of adjuvant therapy. Despite these limitations, the NCDB provides a large sample size, making this study the largest study to date investigating the differences between PGC and DGC. It collects data from more than 1,500 Commission on Cancer-accredited facilities in the United States.
In summary, the study revealed that DGC was associated with older age, poorly differentiated histology, and advanced pTNM stage. Although PGC was associated with better prognosis compared to DGC, this observed better prognosis was only pronounced in patients with distant metastasis. PGC patients in early stage or locally advanced stage had a worse prognosis compared with DGC patients. A survival benefit was seen for LADGC patients underwent gastrectomy who received NAT or NAT plus AT compared with those who received AT only, whereas LAPGC patients did not share this result. Prognosis of LAPGC and LADGC varied by different forms of neoadjuvant and/or adjuvant therapy, and pre- and post-operative CT might be a recommended adjuvant treatment strategy for LAPGC and LAPGC. Although these findings in our study warrant further investigation to understand the underlying mechanisms, primary tumor location should be carefully considered when deciding treatment strategies.
Abbreviations
PGC: Proximal gastric cancer; DCG: Distal gastric cancer; AT: Adjuvant therapy; NAT: Neoadjuvant therapy; GC: Gastric cancer; OS: Overall survival; NCDB: National Cancer Data Base; HR: Hazard ratio; CL: Confidence interval; LAPGC: Locally advanced proximal gastric cancer; LADGC: Locally advanced distal gastric cancer; CT: Chemotherapy; RT: radiotherapy.
Supplementary Material
Supplementary tables.
Acknowledgements
This work was supported by a grant from National Key R&D Program of China (Grant No.2017YFC0908300 and No. 2016YFC1302500).
Authors' contributions
Xiang Wang: Conceptualization, methodology, writing original draft, visualization, project administration, and writing-review and editing. Fangfang Liu: Conceptualization, methodology, software, validation, formal analysis, investigation, data, curation, and writing-review and editing. Yumin Li: Conceptualization, methodology, investigation, resources, supervision, and writing-review and editing. Song Tang: Writing-review and editing. Yawei Zhang: Writing-review and editing. Yingtai Chen: Conceptualization, methodology, investigation, resources, supervision, project administration, funding acquisition, and writing-review and editing. Sajid A. Khan: Conceptualization, methodology, investigation, resources, supervision, project administration, funding acquisition, and writing-review and editing.
Competing Interests
The authors have declared that no competing interest exists.
References
1. Ang TL, Fock KM. Clinical epidemiology of gastric cancer. Singapore Med J. 2014;55:621-628
2. Falk J, Carstens H, Lundell L, Albertsson M. Incidence of carcinoma of the oesophagus and gastric cardia. Changes over time and geographical differences. Acta Oncol. 2007;46:1070-1074
3. Huang Q, Shi J, Sun Q. et al. Clinicopathological characterisation of small (2 cm or less) proximal and distal gastric carcinomas in a Chinese population. Pathology. 2015;47:526-532
4. Botterweck AA, Schouten LJ, Volovics A, Dorant E, Pa VDB. Trends in incidence of adenocarcinoma of the oesophagus and gastric cardia in ten European countries. International Journal of Epidemiology. 2000;29:645-654
5. Parfitt JR, Miladinovic Z, Driman DK. Increasing incidence of adenocarcinoma of the gastroesophageal junction and distal stomach in Canada - an epidemiological study from 1964-2002. Can J Gastroenterol. 2006;20:271-276
6. Devesa SS, Blot WJ, Fraumeni JF Jr. Changing patterns in the incidence of esophageal and gastric carcinoma in the United States. Cancer. 1998;83:2049-2053
7. Devesa SS, Blot Wj, Fraumeni JF Jr, Fraumeni JF Jr. Changing patterns in the incidence of esophageal and gastric carcinoma in the United States. Cancer. 1998;83:2049-53
8. Kim MA, Lee HS, Yang HK, Kim WH. Clinicopathologic and protein expression differences between cardia carcinoma and noncardia carcinoma of the stomach. Cancer. 2005;103:1439-1446
9. Liu K, Zhang W, Chen X. et al. Comparison on Clinicopathological Features and Prognosis Between Esophagogastric Junctional Adenocarcinoma (Siewert II/III Types) and Distal Gastric Adenocarcinoma: Retrospective Cohort Study, a Single Institution, High Volume Experience in China. Medicine (Baltimore). 2015;94:e1386
10. Pacelli F, Papa V, Caprino P, Sgadari A, Bossola M, Doglietto GB. Proximal compared with distal gastric cancer: multivariate analysis of prognostic factors. Am Surg. 2001;67:697-703
11. Petrelli F, Ghidini M, Barni S. et al. Prognostic Role of Primary Tumor Location in Non-Metastatic Gastric Cancer: A Systematic Review and Meta-Analysis of 50 Studies. Ann Surg Oncol. 2017;24:2655-2668
12. Yu X, Hu F, Li C, Yao Q, Zhang H, Xue Y. Clinicopathologic characteristics and prognosis of proximal and distal gastric cancer. Onco Targets Ther. 2018;11:1037-1044
13. Costa LB, Toneto MG, Moreira LF. DO PROXIMAL AND DISTAL GASTRIC TUMOURS BEHAVE DIFFERENTLY? Arq Bras Cir Dig. 2016;29:232-235
14. Higuchi K, Koizumi W, Tanabe S, Saigenji K, Ajani JA. Chemotherapy is more active against proximal than distal gastric carcinoma. Oncology. 2004;66:269-274
15. Park JC, Lee YC, Kim JH. et al. Clinicopathological features and prognostic factors of proximal gastric carcinoma in a population with high Helicobacter pylori prevalence: a single-center, large-volume study in Korea. Ann Surg Oncol. 2010;17:829-837
16. Piso P, Werner U, Lang H, Mirena P, Klempnauer J. Proximal versus distal gastric carcinoma-what are the differences? Ann Surg Oncol. 2000;7:520-525
17. Jansson C, Johansson AL, Nyren O, Lagergren J. Socioeconomic factors and risk of esophageal adenocarcinoma: a nationwide Swedish case-control study. Cancer Epidemiol Biomarkers Prev. 2005;14:1754-1761
18. Brown LM, Silverman DT, Pottern LM. et al. Adenocarcinoma of the esophagus and esophagogastric junction in white men in the United States: alcohol, tobacco, and socioeconomic factors. Cancer Causes Control. 1994;5:333-340
19. van Loon AJ, Goldbohm RA, van den Brandt PA. Socioeconomic status and stomach cancer incidence in men: results from The Netherlands Cohort Study. J Epidemiol Community Health. 1998;52:166-171
20. Sun F, Sun H, Mo X. et al. Increased survival rates in gastric cancer, with a narrowing gender gap and widening socioeconomic status gap: A period analysis from 1984 to 2013. J Gastroenterol Hepatol. 2017
21. Krieger N, Chen JT, Waterman PD. et al. Race/ethnicity, gender, and monitoring socioeconomic gradients in health: a comparison of area-based socioeconomic measures-the public health disparities geocoding project. Am J Public Health. 2003;93:1655-71
22. Ajani JA, Bentrem DJ, Besh S. et al. Gastric cancer, version 2.2013: featured updates to the NCCN Guidelines. J Natl Compr Canc Netw. 2013;11:531-546
23. Kuwano H, Nishimura Y, Oyama T. et al. Guidelines for Diagnosis and Treatment of Carcinoma of the Esophagus April 2012 edited by the Japan Esophageal Society. Esophagus. 2015;12:1-30
24. Japanese gastric cancer treatment guidelines 2014 (ver. 4). Gastric Cancer. 2017;20:1-19
25. Cunningham D, Allum WH, Stenning SP. et al. Perioperative chemotherapy versus surgery alone for resectable gastroesophageal cancer. N Engl J Med. 2006;355:11-20
26. Schuhmacher C, Gretschel S, Lordick F. et al. Neoadjuvant chemotherapy compared with surgery alone for locally advanced cancer of the stomach and cardia: European Organisation for Research and Treatment of Cancer randomized trial 40954. J Clin Oncol. 2010;28:5210-5218
Author contact
![]() Corresponding authors: Dr Yingtai Chen; National Cancer Center/National Clinical Research Center for Cancer/Cancer Hospital, Chinese Academy of Medical Sciences and Peking Union Medical College, Beijing 100021, China; Tel: 86-10-87787120; E-mail: yingtai.chencom or Dr Sajid A. Khan; Department of Surgery, Yale School of Medicine, New Haven, CT 06520, United States; Tel: 1-203.337.8507; E-mail: sajid.khanedu
Corresponding authors: Dr Yingtai Chen; National Cancer Center/National Clinical Research Center for Cancer/Cancer Hospital, Chinese Academy of Medical Sciences and Peking Union Medical College, Beijing 100021, China; Tel: 86-10-87787120; E-mail: yingtai.chencom or Dr Sajid A. Khan; Department of Surgery, Yale School of Medicine, New Haven, CT 06520, United States; Tel: 1-203.337.8507; E-mail: sajid.khanedu
Citation styles
APA
Wang, X., Liu, F., Li, Y., Tang, S., Zhang, Y., Chen, Y., Khan, S.A. (2019). Comparison on Clinicopathological Features, Treatments and Prognosis between Proximal Gastric Cancer and Distal Gastric Cancer: A National Cancer Data Base Analysis. Journal of Cancer, 10(14), 3145-3153. https://doi.org/10.7150/jca.30371.
ACS
Wang, X.; Liu, F.; Li, Y.; Tang, S.; Zhang, Y.; Chen, Y.; Khan, S.A. Comparison on Clinicopathological Features, Treatments and Prognosis between Proximal Gastric Cancer and Distal Gastric Cancer: A National Cancer Data Base Analysis. J. Cancer 2019, 10 (14), 3145-3153. DOI: 10.7150/jca.30371.
NLM
Wang X, Liu F, Li Y, Tang S, Zhang Y, Chen Y, Khan SA. Comparison on Clinicopathological Features, Treatments and Prognosis between Proximal Gastric Cancer and Distal Gastric Cancer: A National Cancer Data Base Analysis. J Cancer 2019; 10(14):3145-3153. doi:10.7150/jca.30371. https://www.jcancer.org/v10p3145.htm
CSE
Wang X, Liu F, Li Y, Tang S, Zhang Y, Chen Y, Khan SA. 2019. Comparison on Clinicopathological Features, Treatments and Prognosis between Proximal Gastric Cancer and Distal Gastric Cancer: A National Cancer Data Base Analysis. J Cancer. 10(14):3145-3153.
This is an open access article distributed under the terms of the Creative Commons Attribution (CC BY-NC) license (https://creativecommons.org/licenses/by-nc/4.0/). See http://ivyspring.com/terms for full terms and conditions.