3.2
Impact Factor
ISSN: 1837-9664
J Cancer 2019; 10(14):3154-3171. doi:10.7150/jca.30306 This issue Cite
Research Paper
Identification of microRNA-92a and the related combination biomarkers as promising substrates in predicting risk, recurrence and poor survival of colorectal cancer
1. Department of Radiotherapy & Oncology, The Second Affiliated Hospital of Soochow University, Suzhou, China
2. Institute of Radiotherapy & Oncology, Soochow University, Suzhou, China
3. Department of Radiation Oncology, The Affiliated Suzhou Science & Technology Town Hospital of Nanjing Medical University, Suzhou Science & Technology Town Hospital, Suzhou, China
4. Department of Oncology, Nantong Rich Hospital, Nantong, China
*These authors contributed equally to this work.
Received 2018-9-30; Accepted 2019-4-28; Published 2019-6-2
Abstract
Background: Previous studies demonstrated that microRNA-92a (miR-92a) may serve as a novel promising biomarker in colorectal cancer (CRC) patients. However, a comprehensive analysis of the contribution of miR-92a in CRC is lacking. We aimed to systematically summarize the diagnostic and prognostic values of miR-92a in CRC.
Methods: The diagnostic and prognostic roles of individual miR-92a and the combination biomarkers based on miR-92a were evaluated through comprehensive meta-analyses. Meanwhile, the function and potential mechanisms of miR-92a were assessed by an integrative bioinformatics analysis.
Results: According to the results, we found that miR-92a yielded a pooled area under ROC curve (AUC) of 0.82 (sensitivity: 76%, specificity: 75%) in discriminating CRC from controls. Notably, the combination biomarkers based on miR-92a increased the diagnostic performance, yielding an AUC of 0.91, with a sensitivity of 83% and a specificity of 87%. For the prognostic meta-analysis, patients with higher expression of miR-92a had significant shorter overall survival (pooled HR: 2.30; 95% CI: 1.03-5.12). In addition, the regulated genes of miR-92a were retrieved and enriched through gene ontology and pathway analysis, indicating their correlations with the initiation and progression of CRC. Furthermore, protein-protein interaction network was set up with miR-92a targets and screened for hub nodes and significant modules, which were confirmed strongly involved in the occurrence and development of CRC again.
Conclusions: Current evidences suggest miR-92a is a promising biomarker for early detection and prognosis of CRC while miRNA combination biomarkers may be considered as the right way for clinical practice. However, more prospective studies are required to highlight the theoretical strengths.
Keywords: Colorectal cancer, Biomarker, Meta-analysis, System biological analysis
Background
Colorectal cancer (CRC) is one of the most commonly diagnosed malignancies and leading causes of cancer related deaths all over the world [1]. CRC with an early stage of development is more likely to be treated successfully with better prognosis than those locally advanced stages [2]. Currently, the gold standard method for early detection of CRC is mainly based on colonoscopy and biopsy; however, the wide application of this method has been limited because of its invasive nature and the high cost. Other strategies employed to early detect CRC including computed tomography imaging techniques, fecal occult-blood testing (FOBT) and some molecular markers such as carcinoembryonic antigen (CEA) have not been widely used due to their wide detectable range, low sensitivity and specificity [3, 4]. As a result, the majority of patients could only be diagnosed accurately in locally advanced stages of CRC when the survival outcomes are poor. Consequently, an urgent need exists to identify simple and more reliable biomarkers for the early diagnosis of CRC. In addition, new prognostic methods for CRC are also in urgent need to improve treatment strategies.
Promisingly, the discovery of microRNAs has opened new opportunities of a non-invasive test for the early detection and survival prediction of cancer. MicroRNAs (miRNAs), which are a class of small noncoding RNA molecules (18-25 nucleotides), have a great regulatory role over the expression of most human protein-coding genes at the post-transcriptional level [5]. During the past decades, accumulating evidences have demonstrated that miRNAs play vital roles in the regulation of developmental, physiological and oncogenic processes of various cancers including cell growth, differentiation, apoptosis, invasion, and metastasis [6]. A number of studies have shown that profiles of miRNA expression differ between tumor-associated samples and normal controls. Meanwhile, miRNAs exhibited an outstanding stability in body fluids and resistance against boiling, pH changes, extended storage time, and repeated freeze-thaw cycles [7]. Those studies have revealed that miRNAs may be sensitive and informative biomarkers for cancer diagnosis, prognosis and therapeutic efficacy [8].
Emerging as one of the most promising miRNA biomarkers, microRNA-92a (miR-92a) has been extensively explored by plenty studies in a variety of cancers. Previously, there have been an increasing number of studies regarding the correlation of miR-92a with colorectal tumorigenesis and the modulation of the clinical course of the disease [9]. Meanwhile, several groups of researches have studied the diagnostic power of miR-92a in CRC, suggesting it may be a promising biomarker for distinguishing CRC patients from healthy controls [10]. In addition, recent evidence has indicated that high miR-92a expression promotes CRC progression and predicts poor prognosis of CRC patients [11]. Therefore, miR-92a may be the promising substrate in not only early detection of CRC but also predicting patients' outcome. However, the clinical applicability of the identified miR-92a as biomarkers of CRC is still limited due to the inconsistent results among different studies. Moreover, the potential molecular mechanism of miR-92a in the initiation and progression of CRC is still not very clear for the current insufficient knowledge.
Therefore, in the present study, we first carried out a comprehensive meta-analysis to overcome the limitation of single study and to obtain a better understanding of the clinical feasibility of miR-92a as excellent biomarker in the diagnosis, recurrence and prognosis of CRC. In contrast to traditional biomarker studies with an isolated and static mode addicted to single molecule, we also investigated the role of combination biomarkers based on miR-92a in CRC. Moreover, we performed an integrative bioinformatics analysis to assess the biological roles of miR-92a at the systems biology level.
Materials and Methods
Publication search strategy
All relevant articles were searched via several electronic databases including PMC database, Embase, Cochrane Library, and Web of Science databases (up to August 03, 2018) by using the following search terms: (“microRNA-92” OR “miR-92” OR “miRNA-92”), (“rectal” OR “rectum” OR “colon” OR “colorectal” OR “CRC”) and (“cancer” OR “tumor” OR “neoplasm” OR “carcinoma”). Meanwhile, the references of included articles and relevant published reports were manually examined for all relevant studies.
Eligibility criteria
The studies qualified to be included had to meet the following criteria: (1) they studied the associations between miR-92a and CRC; (2) they reported diagnostic test and survival data; (3) they made a definitive diagnosis of CRC by using the gold standard; (4) they directly provided true positive (TP), false positive (FP), false negative (FN), and true negative (TN) for diagnostic meta-analysis or hazard ratio (HR) and their 95% confidence intervals (CIs) for prognostic meta-analysis or they provided adequate data which can be used to calculate these statistics.
The studies were excluded if (1) they were obviously not associated with our topic; (2) they were duplicate publications; (3) they published in the forms of reviews, case reports, letters, editorials, or expert opinions; (4) they were non-English articles; or (5) they provided insufficient data for further calculation.
Data extraction
Two reviewers (Peng and Shen), independently collected data from the included studies with standardized forms and any disagreement was resolved by consulting with a third investigator. The following data characteristics were extracted for each included studies: first author's name; publication year; country of publication; study population; sample sources; tumor stage; detection method; diagnostic data including sensitivity, specificity, true positive (TP), false positive (FP), false negative (FN), true negative (TN) and area under ROC curve (AUC); prognostic data including HR and their corresponding 95% CIs.
Quality assessment
The quality of the diagnostic study was assessed by following the quality assessment of diagnostic accuracy studies 2 (QUADAS-2) [12]. For prognostic studies, the quality was evaluated using the guidelines of the Newcastle-Ottawa Scale [13].
Statistical analysis for meta-analysis
For the diagnostic meta-analyses, the overall diagnostic power of miR-92a and miR-92a-related combination markers were assessed using the numbers of patients with TP, FP, FN, and TN test results retrieved directly from the included studies or through recalculation based on sensitivity and specificity along with other data collected from each eligible study. The bivariate meta-analysis model was used to evaluate the pooled parameters including sensitivity, specificity, positive likelihood ratio (PLR), negative likelihood ratio (NLR), and diagnostic odds ratio (DOR) [14]. Based on the sensitivity and specificity of each eligible study, the summary receiver operator characteristic (SROC) curve was set up and calculated the corresponding area under it to quantify the diagnostic power [15]. The Spearman correlation coefficient was applied to assess cutoff threshold effects between sensitivity and specificity.
For the prognostic meta-analyses, the pooled impact of miR-92a expression on the survival of CRC was evaluated using HRs with their corresponding 95% CIs directly exacted from each study or obtained from Kaplan-Meier survival curves with the method previously introduced by Tierney et al [16]. A random-effect model was applied to calculate the pooled HRs if significant heterogeneity exists; otherwise, a fixed effect model was adopted.
Heterogeneity of the pooled results was checked using Cochran's Q test (significant at P < 0.05) and Higgins's I2 statistic (ranging from 0% to 100%). A low p-value (≤0.05) and high I2 value (≥50%) suggest presence of heterogeneity [17]. The potential sources of heterogeneity were explored by performing subgroup, meta-regression, and sensitivity analyses [18]. Deeks' funnel plot was selected to estimate the potential publication bias of the included studies [19]. P<0.05 was considered statistically significant.
The statistical analyses were conducted with Meta-DiSc and STATA 12.0 statistical software.
Integrative functional analysis of miR-92a
An integrative functional analysis was carried out to investigate the role of miR-92a in the initiation and progression of CRC. The target genes of the miR-92a were integrated with the target information validated by biological experiments collected from miRTarBase, which is a comprehensively annotated, experimentally validated miRNA-target interactions database in the field of miRNA related research [20]. In this study, all the target genes of miR-92a were mapped to the online tool Database for Annotation, Visualization and Integrated Discovery (DAVID) and enriched to conduct the Gene ontology (GO) and Kyoto encyclopedia of genes and genomes (KEGG) pathway analyses [21-23]. P-value < 0.05 and gene count ≥ 2 were chosen as the cut-off.
PPI network analysis of miR-92a targets
To evaluate the interactions among the target genes of miR-92a, we retrieved the protein-protein interaction (PPI) information by uploading them to the Search Tool for the Retrieval of Interacting Genes (STRING) database [24]. The PPI network was set up based on the PPI data with the combined score > 0.4 and visualized with the powerful tool Cytoscape. Network analysis was performed to identify the key hub genes with three different methods including degree centrality, closeness centrality and between-ness centrality based on the plug-in CytoNCA in the set up network. In addition, module analysis was applied to screen the significant modules active in the network with the plug-in Molecular Complex Detection (MCODE) of Cytoscape. Finally, functional enrichment was carried out with the screened hub nodes and the genes involved in the identified modules. Value of P < 0.05 was considered to represent statistical significance.
Results
Study selection
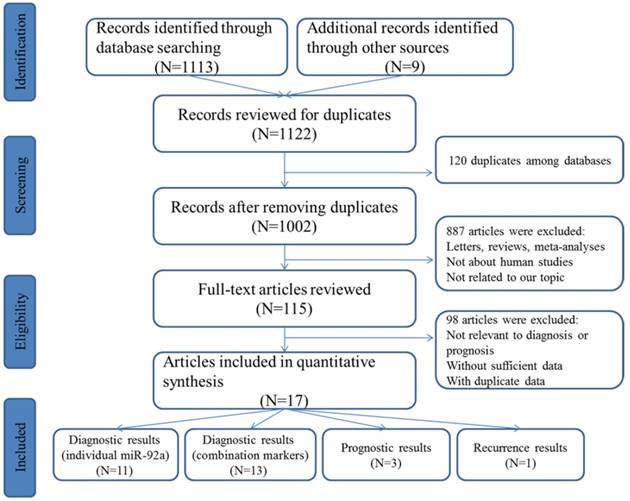
The initial search from the selected literature databases and other sources resulted in the inclusion of 1122 articles. As shown in the selection process for the literature (Figure 1), after careful exclusion of inappropriate ones in each step, 11 articles including 11 studies [25-35] for miR-92a alone and 10 articles including 12 studies [26, 27, 29, 30, 32, 34-38] for miR-92a-related combination markers that met the inclusion norm were finally enrolled for the evidence synthesis for the diagnostic meta-analysis while three publications involving three studies were included in the prognostic meta-analysis that evaluated the survival prediction role of miR-92a in CRC [11, 29, 39]. In addition, only one study assessed the roles of miR-92a and miR-92a-related combination markers in the recurrence prediction of CRC [40].
Demographic characteristics of included studies
Twelve studies with 955 patients and 721 healthy controls evaluated the diagnostic value of miR-92a alone for CRC. Among them, there were five studies assessing serum miR-92a, five studies investigating plasma miR-92a and one study involving stool miR-92a. The included studies were conducted in Europe (n=2), East Asian (n=8) and Africa (n=1). The included publications for assessing miR-92a-related combination markers involved 1404 patients and 1307 controls in detecting CRC. Sample sources were classified as plasma (n=4), serum (n=7) and feces (n=2). Most of the studies focused on Asian population while only study concentrated on Caucasian. And for the prognostic studies, they were all carried out in Asian, of which one evaluated serum miR-92a and two assessed tissue miR-92a. In the present study, quantitative real-time polymerase chain reaction (qRT-PCR) assay was used in all the studies for detecting the expression level of miR-92a and the related combination markers. Moreover, assessments of the quality of these studies revealed that overall they were of moderate to high quality. The main features of all the included studies are listed in Table 1, Table 2 and Table 3, respectively.
Flow chart of study selection process
The main features of the included studies on individual miR-92a in the diagnosis of CRC
| First author | Year | Country | Ethnicity | Case | Control | Sample source | Methods | AUC | Sensitivity | Specificity | QUADAS | ||||||
|---|---|---|---|---|---|---|---|---|---|---|---|---|---|---|---|---|---|
| M | F | N | Age | M | F | N | Age | ||||||||||
| Ng, EK | 2009 | China | Asian | NA | NA | 90 | 71.0 | NA | NA | 50 | 69.0 | Plasma | RT-PCR | 0.885 | 89% | 70% | 5 |
| Huang, ZH | 2010 | China | Asian | 51 | 49 | 100 | 61.0 | 31 | 28 | 59 | 58.0 | Plasma | RT-PCR | 0.838 | 84% | 71% | 3 |
| Wu, CW | 2012 | China | Asian | 49 | 39 | 88 | 67.2 | 44 | 57 | 101 | 60.5 | Feces | RT-PCR | 0.780 | 72% | 73% | 4 |
| Giraldez, MD | 2013 | Spain | Caucasian | NA | NA | 21 | 72.5 | 11 | 9 | 20 | 60.6 | Plasma | RT-PCR | 0.857 | 95% | 65% | 4 |
| Luo, XY | 2013 | Germany | Caucasian | 45 | 35 | 80 | 68.0 | 60 | 84 | 144 | 62.5 | Plasma | RT-PCR | 0.561 | 68% | 49% | 4 |
| Liu, GH | 2013 | China | Asian | 126 | 74 | 200 | 57.4 | 42 | 38 | 89 | 57.7 | Serum | RT-PCR | 0.786 | 65% | 82% | 5 |
| Du, ML | 2014 | China | Asian | 30 | 19 | 49 | 61.1 | 30 | 19 | 49 | 61.7 | Plasma | RT-PCR | 0.533 | 18% | 96% | 4 |
| Zheng, G | 2014 | China | Asian | 93 | 67 | 160 | 60.2 | 51 | 43 | 94 | 52.3 | Serum | RT-PCR | 0.871 | 80% | 80% | 3 |
| Elshafei, A | 2017 | Egypt | Africa | 46 | 18 | 64 | 51.4 | 17 | 10 | 27 | 46.4 | Serum | RT-PCR | 0.844 | 84% | 81% | 4 |
| Liu, HN | 2018 | China | Asian | 51 | 34 | 85 | 59.5 | 48 | 30 | 78 | 34.8 | Serum | RT-PCR | 0.817 | 79% | 72% | 5 |
| Fu, FF | 2018 | China | Asian | NA | NA | 18 | 60.0 | 5 | 5 | 10 | 60.0 | Serum | RT-PCR | 0.845 | 89% | 79% | 4 |
M male, F female, N number, NA not available, AUC area under the curve, QUADAS quality assessment of diagnostic accuracy studies
The main features of the included studies on miR-92a-related combination markers in the diagnosis of CRC
| First author | Year | Country | Ethnicity | Case | Control | miRNA combinations | Sample source | Methods | AUC | Sensitivity | Specificity | QUADAS | ||||||
|---|---|---|---|---|---|---|---|---|---|---|---|---|---|---|---|---|---|---|
| M | F | N | Age | M | F | N | Age | |||||||||||
| Huang, ZH | 2010 | China | Asian | 51 | 49 | 100 | 61.0 | 31 | 28 | 59 | 58.0 | miR-92a, miR-29a | Plasma | RT-PCR | 0.883 | 83% | 85% | 3 |
| Wang, QF | 2012 | China | Asian | NA | NA | 90 | NA | NA | NA | 58 | NA | miR-92a, miR-29a, miR-760 | Plasma | RT-PCR | 0.943 | 83% | 93% | 5 |
| Wu, CW | 2012 | China | Asian | 49 | 39 | 88 | 67.2 | 44 | 57 | 101 | 60.5 | miR-92a, miR-21 | Feces | RT-PCR | NA | 82% | 57% | 4 |
| Liu, GH | 2013 | China | Asian | 126 | 74 | 200 | 50.0 | 42 | 38 | 80 | 57.7 | miR-92a, miR-21 | Serum | RT-PCR | 0.847 | 68% | 91% | 5 |
| Luo, XY | 2013 | Germany | Caucasian | 45 | 35 | 80 | 68.0 | 60 | 84 | 144 | 62.5 | miR-92a, miR-18a, miR-20a, miR-21, miR-29a, miR-106b, miR-133a, miR-143, miR-145, miR-342-3p, miR-532-3p, miR-181b | Plasma | RT-PCR | 0.745 | 72% | 75% | 4 |
| Wang, J | 2014 | China | Asian | NA | NA | 30 | 55.0 | NA | NA | 30 | 57.0 | miR-92a, miR-21, let-7g, miR-31, miR-181b, miR-203 | Serum | RT-PCR | 0.900 | 83% | 97% | 5 |
| Wang, J | 2014 | China | Asian | NA | NA | 83 | 55.0 | NA | NA | 59 | 57.0 | miR-92a, miR-21, let-7g, miR-31, miR-181b, miR-203 | Serum | RT-PCR | 0.923 | 96% | 88% | 5 |
| Zheng, G | 2014 | China | Asian | 93 | 67 | 160 | 60.2 | 51 | 43 | 94 | 52.3 | miR-92a, miR-19a, miR-223, miR-422a | Serum | RT-PCR | 0.960 | 91% | 89% | 3 |
| Zheng, G | 2014 | China | Asian | 68 | 49 | 117 | 56.3 | 59 | 43 | 102 | 52.8 | miR-92a, miR-19a, miR-223, miR-422a | Serum | RT-PCR | 0.951 | 84% | 92% | 3 |
| Chang, PY | 2016 | China | Asian | 78 | 60 | 138 | NA | 199 | 110 | 309 | NA | miR-92a, miR-223, | Feces | RT-PCR | 0.810 | 72% | 80% | 4 |
| Chang, PY | 2016 | China | Asian | 116 | 99 | 215 | NA | 115 | 68 | 183 | NA | miR-92a, miR-223, | Plasma | RT-PCR | 0.780 | 76% | 71% | 4 |
| Liu, HN | 2018 | China | Asian | 51 | 34 | 85 | 59.5 | 48 | 30 | 78 | 34.8 | miR-92a, miR-21, miR-29a, miR-125b | Serum | RT-PCR | 0.952 | 85% | 99% | 5 |
| Fu, FF | 2018 | China | Asian | NA | NA | 18 | 60.0 | 5 | 5 | 10 | 60.0 | miR-92a, miR-17 | Serum | RT-PCR | 0.910 | 91% | 83% | 4 |
M male, F female, N number, NA not available, AUC area under the curve, QUADAS quality assessment of diagnostic accuracy studies
The main features of the included studies on miR-92a in the prognosis of CRC
| First author | Year | Country | Ethnicity | Male/female | N | Age | TNM stage | Sample source | Methods | Endpoints | Follow-up time (months) | Hazard ratio | Scores |
|---|---|---|---|---|---|---|---|---|---|---|---|---|---|
| Liu, GH | 2013 | China | Asian | 126/74 | 200 | 50 | I:18; II:96; III:64; IV:22 | Serum | RT-PCR | OS | 36 | 4.36(1.64-11.57) | 7 |
| Zhou, T | 2013 | China | Asian | 57/25 | 82 | NA | I/II:34; III/IV:48 | Tissue | RT-PCR | OS | 60 | 2.95(1.49-5.81) | 9 |
| Ke, TW | 2015 | China | Asian | 64/94 | 158 | 65 | I/II:84; III/IV:74 | Tissue | RT-PCR | OS | 57.6 | 1.26(1.02-1.55) | 8 |
N number, OS overall survival
Diagnostic value of miR-92a in CRC
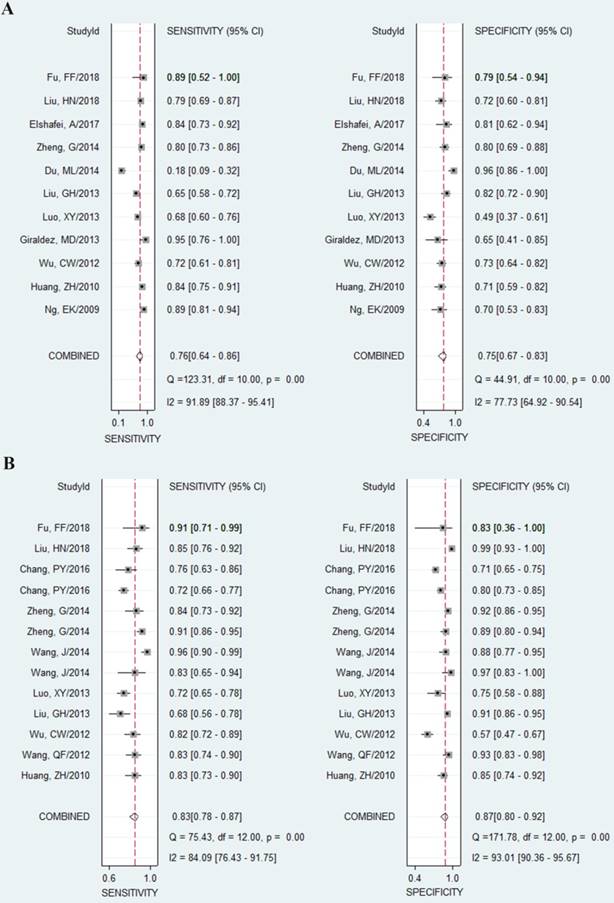
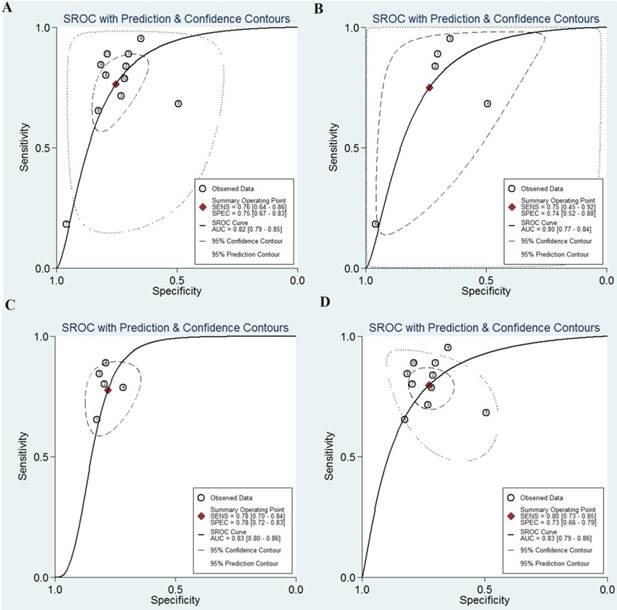
As shown in the Figure 2A, the pooled sensitivity and specificity were 0.76 (95%CI, 0.64-0.86) and 0.75 (0.67-0.83), respectively. The combined DOR was 10 (6-17), which means that patient who was identified positive for CRC with a high level of miR-92a had a 10-fold higher chance of suffering from CRC in fact than people with a negative CRC result. The pooled PLR and NLR, which are considered to be more comprehensive and steady diagnostic values of screening tests, were also calculated to predict the diagnostic power of miR-92a with the pooled results of 3.1 (2.4-4.1) and 0.31 (0.21-0.47), respectively. At last, the SROC curve (Figure 3A) was plotted and the area under the curve was 0.82 (0.79-0.85), suggesting miR-92a has a relatively high diagnostic performance in CRC.
However, significant heterogeneity was found as the Q value was 123.31 (P < 0.001) and I2 value was 91.89% (95% CI 88.37-95.41) for sensitivity while the Q value was 44.91(P < 0.001) and I2 value was 77.73% (95% CI 64.92-90.54) for specificity.
In order to exclude the heterogeneity caused by the threshold effect, we used the Spearman test to estimate the correlation coefficient and P value between the logit of sensitivity and logit of 1-specificity. According to the results, the Spearman correlation coefficient was -0.68 with the P value of 0.47 (P >0.05), revealing that there was no heterogeneity generating from threshold effect.
Then, subgroup analysis was carried out to explore the possible sources of heterogeneity from non-threshold effect (Table 4). Subgroup analysis based on different sample sources of miR-92a suggested that serum miR-92a indicated superior diagnostic properties (Figure 3C) than plasma (Figure 3B), with sensitivity of 0.78 versus 0.75, specificity of 0.78 versus 0.74, and AUC of 0.83 versus 0.80, suggesting that serum is a better matrix for miR-92a detection. Among the eleven studies, ten measured the miRNA assay in circulating samples. Therefore, subgroup analysis was also conducted by circulating samples. In total, the pooled sensitivity, specificity, and AUC of circulating miR-92a were 0.77 (0.63-0.87), 0.76 (0.66-0.84), and 0.83 (0.79-0.86). Since Asian populations were more often studied in the included studies, thus subgroup analysis was performed, showing the sensitivity of 0.73 (0.57-0.85), specificity of 0.78 (0.70-0.85), and AUC of 0.83 (0.76-0.86).
Forest plots of sensitivities and specificities from test accuracy studies in the diagnosis of CRC. A Forest plots of sensitivities and specificities for miR-92a alone; B forest plots of sensitivities and specificities for miR-92a-related combination markers
Meta-regression analysis was also applied to search the heterogeneity sources. We considered publication year, ethnicity, sample size and sample source may result in the heterogeneity. However, It was revealed from the results of meta-regression analysis that none of the covariates may have contributed to the heterogeneity.
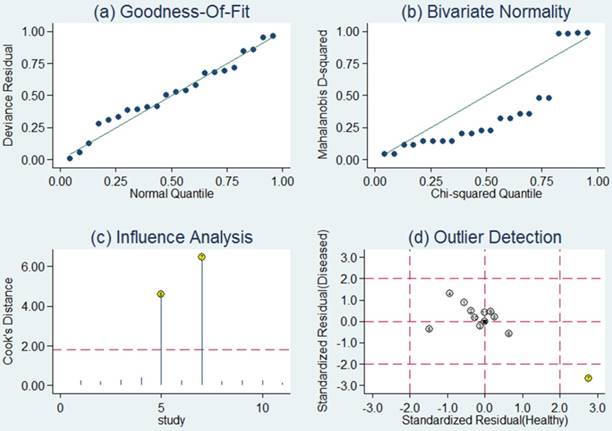
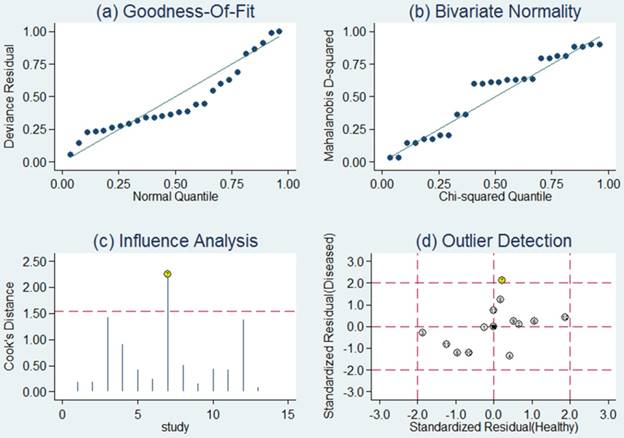
Sensitivity analysis was then carried out in order to assess the impact of individual studies with estimates differing from the summary estimates on the overall results. Goodness of fit and bivariate normality analyses (Figure 4a, b) implied that the bivariate random-effects model was robust for the meta-analysis. There was one deviated study that may overshadow the robustness of the meta-analysis based on the influence analysis and outlier detection (Figure 4c, d). After removing it, the I2 value for heterogeneity of sensitivity and specificity dropped from 91.89 to 78.85% and from 77.73 to 69.67%, respectively. Nevertheless, there were only minimal changes in the pooled estimates of sensitivity (0.76 vs. 0.80), specificity (0.75 vs. 0.73), PLR (3.1 vs. 2.9), NLR (0.31 vs. 0.28), DOR (10 vs. 11), and AUC (0.82 vs. 0.83) between the overall analysis with and without outliers, which meant there was high robustness in our meta-analysis.
Pooled results of diagnostic accuracy of miR-92a and combination biomarkers in colorectal cancer
| Analysis | Number of studies | Se(95%CI) | Sp(95%CI) | AUC(95%CI) | |
|---|---|---|---|---|---|
| Individual | Ethnicity | ||||
| Asian | 8 | 0.73 (0.57-0.85) | 0.78 (0.70-0.85) | 0.83 (0.76-0.86) | |
| Sample type | |||||
| Plasma | 5 | 0.75 (0.45-0.92) | 0.74 (0.52-0.88) | 0.80 (0.52-0.88) | |
| Serum | 5 | 0.78 (0.70-0.84) | 0.78 (0.72-0.83) | 0.83 (0.80-0.86) | |
| Circulating | 10 | 0.77 (0.63-0.87) | 0.76 (0.66-0.84) | 0.83 (0.79-0.86) | |
| Feces | 1 | 0.18 | 0.96 | 0.53 (0.43-0.63) | |
| Overall | 12 | 0.76 (0.64-0.86) | 0.75 (0.67-0.83) | 0.82 (0.79-0.85) | |
| Outliers excluded | 11 | 0.80 (0.73-0.85) | 0.73 (0.66-0.79) | 0.83 (0.79-0.86) | |
| Combination | Ethnicity | ||||
| Asian | 12 | 0.84 (0.78-0.88) | 0.88 (0.81- 0.93) | 0.92 (0.89-0.94) | |
| Sample type | |||||
| Plasma | 4 | 0.78 (0.71-0.83) | 0.81 (0.69- 0.89) | 0.85 (0.81-0.88) | |
| Serum | 7 | 0.87 (0.79-0.92) | 0.91 (0.89- 0.94) | 0.93 (0.91-0.95) | |
| Circulating | 11 | 0.84 (0.78-0.89) | 0.89 (0.84- 0.93) | 0.93 (0.90-0.95) | |
| miRNA number | |||||
| 2 | 6 | 0.77 (0.71-0.82) | 0.78 (0.67- 0.86) | 0.82 (0.79-0.85) | |
| >2 | 7 | 0.86 (0.80-0.91) | 0.92 (0.86- 0.95) | 0.95 (0.93-0.97) | |
| Overall | 13 | 0.83 (0.78-0.87) | 0.87 (0.80- 0.92) | 0.91 (0.88-0.93) | |
| Outliers excluded | 12 | 0.81 (0.76-0.85) | 0.87 (0.79- 0.92) | 0.89 (0.86-0.91) |
Note: AUC, area under the curve; Se, sensitivity; Sp, specificity; 95% CI, 95% confidence interval
The SROC curves of miR-92a in the diagnosis of CRC. A SROC curve overall including the outliers for miR-92a; B SROC curve for miR-92a in plasma samples; C SROC curve for miR-92a in serum samples; D SROC curve of outliers excluded for miR-92a. SROC summary receiver operator characteristic, CRC colorectal cancer
Sensitivity analysis results for miR-92a alone. a Goodness of fit; b bivariate normality; c influence analysis; d outlier detection
funnel plots for the assessment of potential bias in the meta-analysis for diagnosis. A Funnel plot of the studies on miR-92a alone; B funnel plot of the studies on miR-92a-related combination markers
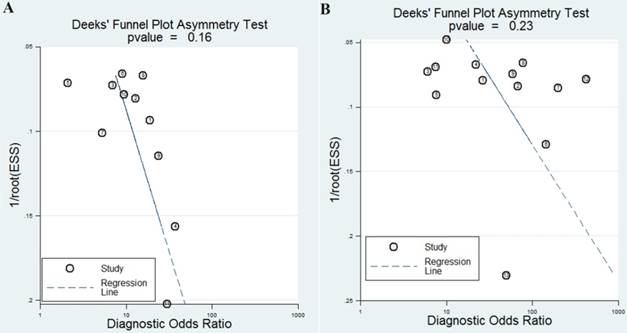
The publication bias is considered to be another influent factor to the diagnosis accuracy. In order to assess publication bias, Deeks' funnel plot was generated. The funnel plots showed no symmetry (Figure 5A) for all included studies with a P value of 0.16, indicating no publication bias exist among these included studies.
Diagnostic value of miR-92a-related combination markers in CRC
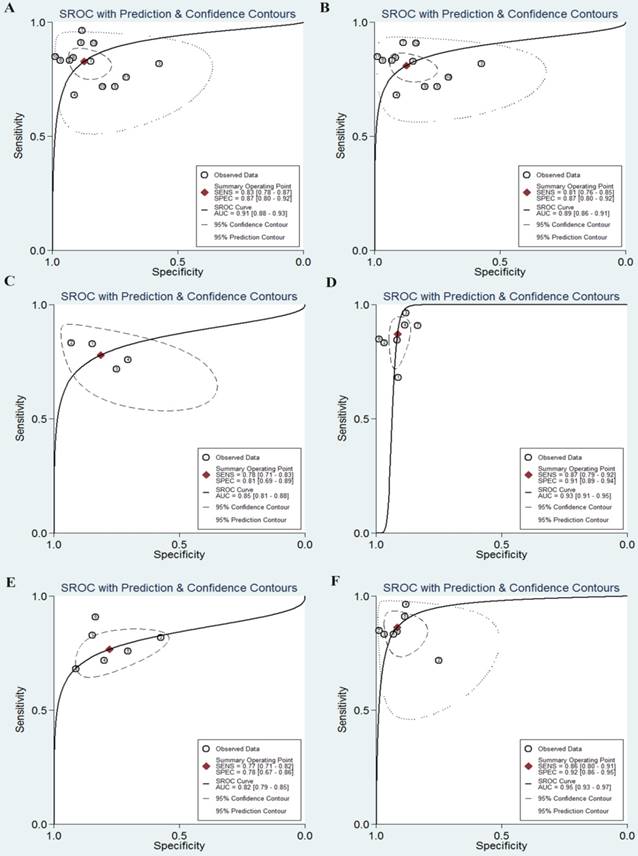
The pooled results indicated miR-92a-related combination markers sensitivity of 0.83 (95%CI, 0.78-0.87), specificity of 0.87 (0.80-0.92), DOR of 33 (17-66). The forest plots of sensitivity and specificity were plotted at Figure 2B. Meanwhile, the pooled data exhibited a PLR of 6.5 (4.1-10.5) and an NLR of 0.20 (0.15-0.27). The AUC under the SROC curve was 0.91 (0.88-0.93), indicating relatively high predictive power. Compared with miR-92a alone, miR-92a-related combination marker achieved a higher level of diagnostic power, with sensitivity of 0.83 vs. 0.76, specificity of 0.87 vs. 0.75, and AUC of 0.91 vs. 0.82.
Despite of the promising results, the conclusions were also overshadowed by obvious heterogeneity as the Q value was 75.43 (P < 0.01) and I2 was 84.09% (76.43-91.75) for sensitivity, while the Q value was 171.78 (P < 0.01) and I2 was 93.01% (90.36-95.67) for specificity.
Therefore, we also evaluated whether there was any threshold effect with statistical significance and the results revealed that this was not the case since the Spearman correlation coefficient was 0.36 with P value of 0.13.
Subsequently, we carried out subgroup analysis to explore the potential sources of heterogeneity (Table 4). Similarly, for the subgroups of sample sources, the serum-based miR-92a assays exhibit a better performance to plasma-based miR-92a assays, with the sensitivity of 0.87 versus 0.78, the specificity of 0.91 versus 0.81 and the AUC of 0.93 versus 0.85 (Figure 6). As a whole, the combination biomarkers based on miR-92a in circulating samples exhibited the diagnostic sensitivity of 0.84 (0.78-0.89), the specificity of 0.89 (0.84-0.93) and the AUC of 0.93 (0.90-0.95). Notably, we found that the number of the miRNA combinations may exert impacts on the results. It was revealed from the results that combination biomarkers with larger number of miRNA combinations (>2) may show a higher level of overall accuracy compared with biomarkers with two combinations (Figure 6). Among the thirteen studies, twelve studies detected the miR-92a expression in Asian populations. Hence, subgroup analysis was also conducted by Asian populations. The pooled sensitivity, specificity, and AUC were 0.84 (0.78-0.88), 0.88 (0.81-0.93), and 0.92 (0.89-0.94).
Next, we further attempted to explain the heterogeneity by exploring study characteristics, that is, publication year, ethnicity, sample size, sample source, number of combinations through meta-regression analyses, and found that the heterogeneity may be caused by sample source and number of combinations.
Then sensitivity analysis was also conducted to investigate the robustness of our study. Goodness of fit and bivariate normality analyses confirmed that the selected analysis model was robust for the calculation of the pooled estimates (Figure 7). Moreover, it revealed that single study did not drive our findings. With one outlier study excluded, the I2 of sensitivity decreased from 84.09 to 79.34 % and that of specificity increased from 93.01 to 93.11 %. However, no remarkable variations were observed in the pooled estimates (Table 4), which did not obviously affect the overall results, indicating that our meta-analysis was robust.
Finally, the funnel plot of the diagnostic meta-analysis of miR-92a-related combination marker was shown in Figure 5B. Funnel plot test indicated no significant publication bias in this study (P=0.23).
Recurrence prediction role of miR-92a and the related combination markers in CRC
Only one study evaluated the prediction role of miR-92a and the related combination markers in the recurrence of CRC. In the study, miR-92 could discriminate recurred patients from non-recurred stage III CRC patients with 66.7% sensitivity, 85.8% specificity and the AUC of 0.786. Prospectively, the related combination markers (miR-92, miR-17, miR-21 and miR-29a) enhanced the diagnostic power for stage III patients, yielding an AUC of 0.881, with a sensitivity of 83.3% and a specificity of 85.7% (p < 0.05).
Prognostic role of miR-92a in CRC
A total of three studies with 440 patients assessed the impact of miR-92a expression on the survival outcome of CRC. The pooled HR was 2.30 (95% CI, 1.03-5.12, P = 0.042) for the included studies, revealing that higher miR-92a expression level predict poorer OS for patients with CRC.
Since the studies enrolled in the analysis were limited, further analysis could not be carried out including subgroup, meta-regression, and sensitivity analyses. Meanwhile, due to the limited number of the included studies, it is difficult to ascertain whether publication bias exists or not in the prognostic meta-analysis.
Integrative functional analysis results of miR-92a
The above results indicated that miR-92a may be an excellent biomarker in the diagnosis and prognosis of CRC. Then, an integrative functional analysis was performed to explain why miR-92a could possess such qualities as a promising biomarker for CRC. Supposing that the genes regulated by miR-92a may also take part in the CRC occurrence and development since miR-92a could predict the initiation and progression of CRC, functional enrichment analysis including GO and KEGG pathway analysis were carried out based on the target genes of miR-92a.
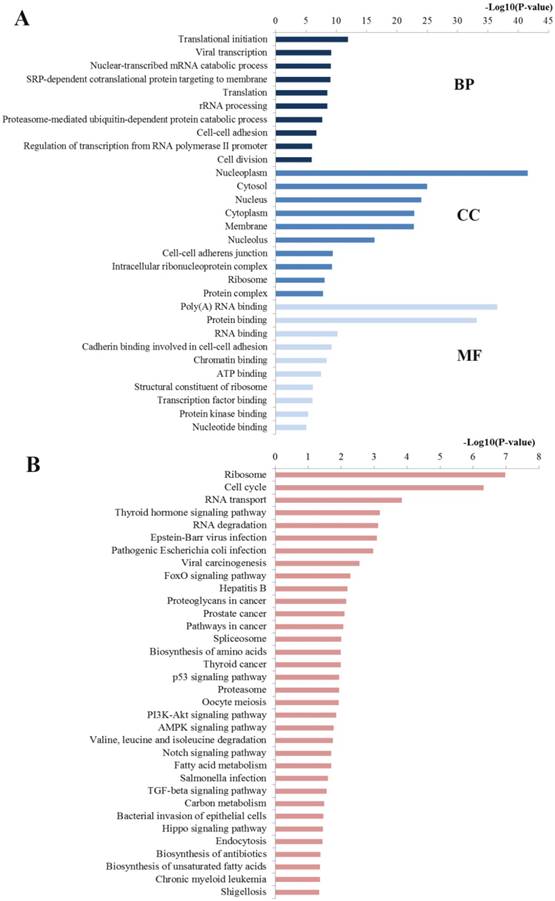
The GO analysis was enriched into three different levels including biological processes (BP), cell component (CC) and molecular function (MF). In this study, we mainly concentrated on the top ten significantly enriched terms for in-depth analyses (Figure 8A). At the BP level, most enriched GO terms were mainly linked with the transcription, translation, nuclear-transcribed mRNA catabolic process and rRNA processing, which are highly associated with the establishment and development of CRC. At the CC level, the miR-92a targets were most enriched with the hallmarks of a cell including nucleoplasm, cytosol, nucleus and nucleus, which have been identified as critical areas with a major impact on the tumorigenesis. At the MF level, most significant terms were closely relevant to the binding function including poly(A) RNA binding, protein binding, RNA binding and chromatin binding, which also influence the carcinogenesis through disturbing the binding function of important molecules.
Pathway enrichment analysis may further reveal the biological function and the potential mechanisms of the miR-92a. A total of 34 pathways were significantly enriched and plotted at Figure 8B. The top enriched KEGG terms indicated several pathways related to the occurrence and development of CRC namely ribosome, cell cycle, RNA transport, RNA degradation, FoxO signaling pathway, proteoglycans in cancer, pathways in cancer, spliceosome, biosynthesis of amino acids, p53 signaling pathway, proteasome, PI3K-Akt signaling pathway, etc.
The SROC curves of miR-92a-related combination biomarkers in the diagnosis of CRC. A SROC curve overall including the outliers for miRNA combination biomarkers; B SROC curve of outliers excluded for miRNA combination biomarkers; C SROC curve for miRNA combination biomarkers in plasma samples; D SROC curve for miRNA combination biomarkers in serum samples; E SROC curve for miRNA combination biomarkers (combinations=2); F SROC curve for miRNA combination biomarkers (combinations>2). SROC summary receiver operator characteristic, CRC colorectal cancer
Sensitivity analysis results for miR-92a-related combination markers. a Goodness of fit; b bivariate normality; c influence analysis; d outlier detection
The functional enrichment analysis agreed well with our identification of miR-92a as biomarker of CRC and revealed the potential mechanisms involved in the initiation and progression of CRC.
PPI network construction and analysis of miR-92a targets
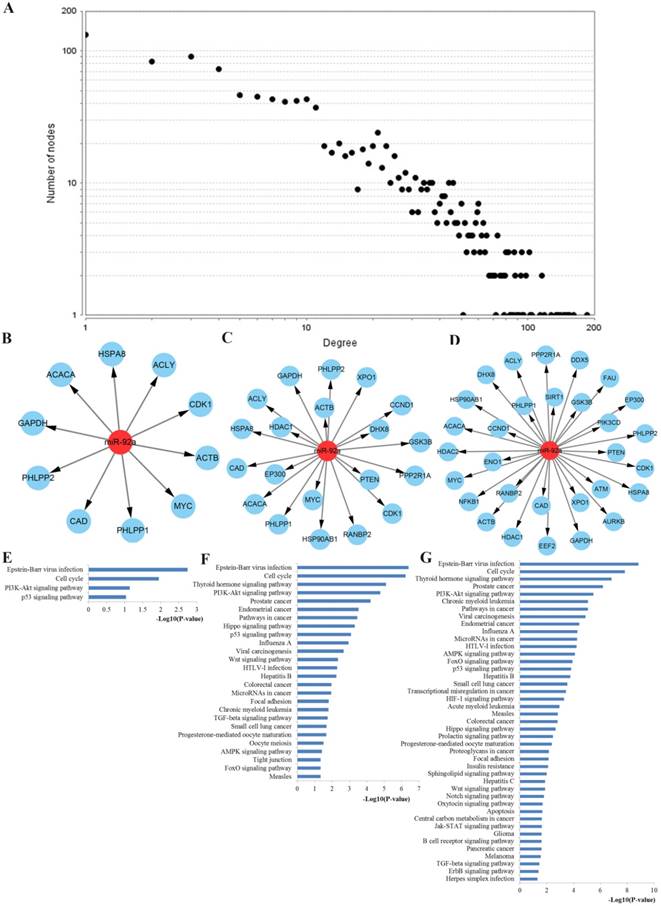
To better understand the internal contact and interactions among the target genes of miR-92a, the PPI network was constructed based on the gene-gene interaction data screened from the STRING database. By uploading 1750 target genes of miR-92a to STRING, a PPI network was identified and visualized with the Cytoscape platform software consisting of 1237 nodes with statistical significance. Network parameters such as degree centrality, closeness centrality and between-ness centrality reflect the ability of network nodes to influence others and the nodes possessing higher power are especially indispensable for the stabilization of the network. In the present study, we first respectively screened the network nodes by using the three methods and then identified the top 10, top 20 and top 30 key hub nodes of the PPI network for miR-92a by intersecting them. The network analysis results were plotted at Figure 9.
Functional enrichment was performed to explore the function of these key hub nodes. As a result, the top 10 hub nodes were associated with cell cycle, PI3K-Akt signaling pathway and p53 signaling pathway. The top 20 hub nodes were highly involved in cell cycle, PI3K-Akt signaling pathway, pathways in cancer, p53 signaling pathway, Wnt signaling pathway, colorectal cancer, microRNAs in cancer and TGF-beta signaling pathway. The top 30 hub nodes were mainly related to cell cycle, PI3K-Akt signaling pathway, pathways in cancer, microRNAs in cancer, AMPK signaling pathway, FoxO signaling pathway and p53 signaling pathway.
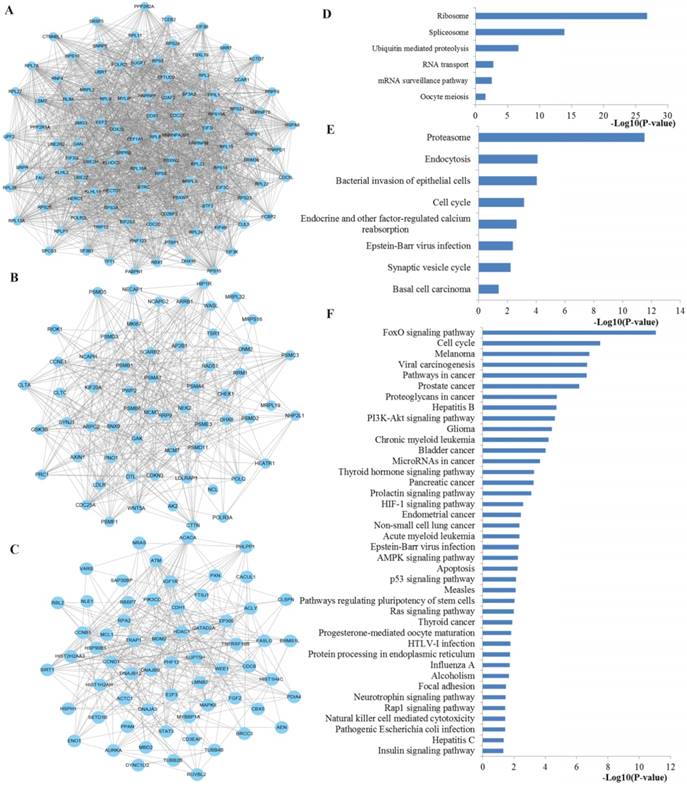
Next, the top three significant network modules were identified from the above PPI network with the MCODE package (Figure 10). According to KEGG pathway enrichment analysis, the genes involved in the significant modules of the PPI network were mainly related to ribosome, spliceosome, RNA transport, mRNA surveillance pathway, proteasome, cell cycle, FoxO signaling pathway, pathways in cancer, proteoglycans in cancer, PI3K-Akt signaling pathway, microRNAs in cancer, HIF-1 signaling pathway, AMPK signaling pathway, p53 signaling pathway and Ras signaling pathway.
Discussion
Over the decades, accumulating researches have revealed the possibility of miRNAs as non-invasive biomarkers for CRC screening, treatment and survival outcome prediction, but the prediction performance has been inconsistent among these studies and the specific miRNAs were not confirmed. As one of the most studied miRNAs, miR-92a has gained a greater focus of attention as it can not only play important roles in early detection of CRC but also predict patients' outcome. However, most of these studies included only small study populations and their conclusions remain inconclusive caused by sample sizes, cancer statuses, sample sources, measuring methods, and other uncontrolled factors. The inconsistent findings promoted us to carry out this comprehensive and up-to-date study to draw a complete overview of all reported clinical studies investigating the value of miR-92a expression on the diagnosis and prognosis of CRC patients. Meanwhile, the current study was the first systematic evaluation of the literatures exploring the roles of combination biomarkers based on miR-92a in CRC. Finally, an integrated bioinformatics analysis at the systems biology level was performed to evaluate the function of miR-92a and to explain the reason why it could possess such perfect biomarker characteristics of CRC.
Functional enrichment results of miR-92a target genes. A Top 10 GO items for target genes of miR-92a target genes; B Significantly enriched pathways for target genes of miR-92a. GO gene ontology, BP biological processes, CC cell component, MF molecular function
PPI network construction results. A Degree distributions of nodes for network set up with miR-92a targets; B-D top 10, 20 and 30 hub genes of network for miR-92a targets, respectively; E-G pathway enrichment results for the top 10, 20 and 30 hub genes of miR-92a targets network, respectively; PPI protein-protein interaction
As a result, miR-92a discriminated CRC patients from healthy controls and achieved a summary 76% (95%CI: 64%-86%) sensitivity and 75% (67%-83%) specificity with an AUC of 0.82 (0.79-0.85), indicating its moderate diagnosis power of CRC as noninvasive detection. Compared with the star biomarker carcinoembryonic antigen (CEA), which has been the first tumor marker proposed for CRC with the overall sensitivity ranging from 43% to 69%, miR-92a has a prominent advantage over it for early detecting CRC. It must be noted that the sample sources may influence the diagnostic performance based on the subgroup analysis. It was indicated that serum-based miR-92a assays achieved significantly higher overall diagnostic accuracy than plasma-based miR-92a assays, which was consistent with previous meta-analyses that indicated serum miRNAs had stronger performance for distinguishing CRC patients from healthy controls than that in plasma.
The top three significant modules from the PPI network. A-C The top three significant modules in the PPI network for miR-92a targets; D-F pathways enriched by all the nodes involved in the identified three modules, respectively. PPI protein-protein interaction.
Nowadays, extensive efforts have been spent in searching cancer biomarkers for diagnosis, prognosis as well as treatment response. Nevertheless, most attention on cancer biomarkers has been addicted to single or limited molecules. As is well known, cancer is a highly complex and heterogeneous disease, the evolutionary processes of carcinogenesis and progression contribute not by the malfunction of single molecules but their synergistic behavior in the network. According to our previous study, combination biomarkers were considered to outperform individual molecules in disease characterization [41, 42]. Therefore, a systematic evaluation of the published studies was performed to explore the values of combination biomarkers based on miR-92a in CRC. As a result, it is indicated that miR-92a-related combination biomarker exhibit a strong performance to distinguish CRC patients from healthy people with the sensitivity of 83%, specificity of 87% and AUC of 0.91. It is worth noting that miR-92a-related combination markers had superior diagnostic properties than miR-92a alone no matter in Asian population-based studies or in circulation sample-based studies or in all enrolled studies. Subgroup analysis was also performed, indicating that two more combination biomarkers, and serum-based miR-92a assays exhibited higher diagnostic power than two combination markers, and plasma-based miR-92a assays, respectively. In brief, combination biomarkers based on miR-92a tend to be given more reliable diagnostic results, hence it is meaningful to test miRNA combination biomarkers to improve the credibility of results in clinical examination.
As is known to all, the main cause of treatment failure for CRC is local recurrence. As a result, there is a great need to identify sensitive and specific biomarkers for early prediction of local recurrence. It is worth noting that miR-92a has been a good candidate as an accurate novel biomarker for predicting the recurrence of CRC. More importantly, combination biomarkers based on miR-92a further improve the prediction accuracy of local recurrence.
The results of the prognostic meta-analysis indicated that the elevated level of miR-92a is indeed a poor prognostic biomarker for CRC in OS. Compared with patients with low miR-92a expression level, patients with an increased level of miR-92a expression had a 2.30-fold higher risk of poor OS. However, the number of studies and sample sizes enrolled in the prognostic analysis were limited, thus the conclusion need further validation.
The impacts of miR-92a expression on CRC diagnosis and prognosis may be partly caused by the biological functions of the miR-92a. Thus, an integrated bioinformatics analysis was conducted to investigate the function of miR-92a at the systems biology level. The GO enriched results revealed that the target genes of miR-92a were highly related to some important biological processes at the BP level, cell hallmarks at CC level and the binding functions such as protein binding, RNA binding and chromatin binding at MF level. In addition, pathway enrichment analysis indicated that miR-92a targets were significantly involved in several signaling pathways which had close connections with the initiation and progression of CRC according to text mining in PubMed. For example, the cell cycle pathway has been critically reviewed by a large amount of studies for its pathogenesis in malignant progression of a variety of human cancers including CRC because of its multifunctional roles in cell growth, inflammation, differentiation, apoptosis, and metastasis [43]. Accumulating new evidence has identified ribosome signaling, RNA transport signaling, RNA degradation signaling, spliceosome signaling and proteasome signaling as important molecular determinants influencing cellular oncogenesis, genomic stability, DNA damage repair, and apoptosis. FoxO signaling generally plays tumor suppression roles through promoting cell cycle arrest, apoptosis, stress resistance, and DNA repair in cancer cells, and the abnormal activation of it may result in the physiological alterations towards carcinogenesis [44]. Emerging evidence supports the critical roles of proteoglycans in cancer signaling pathway as capable cellular effectors important for homeostasis and contributing to cancer pathogenesis [45]. Studies have convinced PI3K-Akt signaling pathway as the most frequently mutated network in CRC and aberrant activation of this pathway is highly related to tumorigenesis, cancer progression, and treatment resistance [46]. AMPK signaling pathway, is a master regulator of energy homeostasis associated with the regulation of a number of physiological processes that acts to limit the growth of cancer cells [47]. The inhibition of AMPK signaling may contribute to cancer cell growth and tumorigenesis. Recent new evidence gathered so far has indicated that Notch signaling pathway is dysregulated in CRC, impacts normal cellular division and leads to cancer and has been correlated with progression, tumor grade and metastasis [48]. It is well established that TGF-beta signaling pathway plays crucial and complex roles in various biological processes, such as cell growth, differentiation, apoptosis, migration, as well as cancer initiation and progression [49]. Pathways in cancer signaling are an important cancer related pathway which contains the above well-studied signaling pathways, playing synergistic effect in the initiation and progression of CRC or other cancers. The functional bioinformatics analysis not only confirmed our study was convincible but elucidated the potential mechanism of miR-92a in the establishment and development of CRC so that it could be a promising biomarker for CRC.
There were close connections among the targets of miR-92a. As a result, a PPI network analysis was performed to further investigate the correlations among the target genes of miR-92a. Through PPI network construction, key hub genes were identified. In the present study, it was indicated from the functional enrichment results that the screened hub nodes regulated by miR-92a played important roles in a series of CRC associated signaling pathways. Most of these pathways have been proved related to the occurrence and development of CRC by literature exploration above. Despite all this, it must be noted that p53 signaling represents one of the most important and extensively studied tumor suppressors by provoking transient or permanent growth arrest, by enabling DNA repair, or by advancing cellular death programs. The aberrant activation of this pathway has been tightly involved in the initiation and progression of almost all types of cancer including CRC [50]. What's more, Wnt signaling, a hallmark of many cancers, has most prominently been described in CRC for the role in carcinogenesis [51]. The colorectal cancer signaling and microRNAs in cancer signaling reflect the direct relationships among key miR-92a target genes and establishment and progression of CRC. Moreover, the top three significant modules of the PPI network were identified and enriched into several pathways. We also searched the PubMed literatures for the associations of these pathways and CRC tumorigenesis and the results indicated that most of the enriched pathways were involved in CRC occurrence and development according to PubMed literature reports. In addition to the pathways mentioned above, other parts have to describe were the HIF-1 signaling pathway and Ras signaling pathway. In recent years, accumulating new evidence supports the concept that HIF-1 signaling acts as a networking hub coordinating activities of multiple signaling molecules influencing tumorigenesis [52]. Besides, a multitude of studies have contributed to a deeper understanding the role of Ras signaling in colorectal carcinogenesis [53]. These results might also provide a possible explanation to the biomarker roles of miR-92a in CRC.
To some extent, heterogeneity may undermine the reliability of the promising results, which was found in all parameters of diagnosis, including sensitivity, specificity, PLR, NLR, and DOR for diagnostic met-analyses for miR-92a alone and combination biomarkers based on miR-92a. Several common approaches were applied to explore potential heterogeneity including Spearman test, subgroup, meta-regression, and sensitivity analyses. According to the Spearman's correlation coefficient, no heterogeneity from the threshold effect was identified. Subgroup analysis revealed that sample sources may exert impacts on the diagnostic accuracy of miR-92a and the related combination biomarkers. Notably, we found that the number of the miRNA combinations may influence the results, which may be the potential source of heterogeneity.
Consistent with recent accumulating studies that suggested miR-92a as potential predictors for the diagnosis and prognosis of CRC, our comprehensive analysis results also indicated that miR-92a could be a perfect biomarker for CRC. Nevertheless, several points must be concerned before its application to clinical practice. First and foremost, more efforts should be spent in reaching a consensus about standard cut-off value, consistent detection and normalization methods. Next, it was revealed from our results that both serum miR-92a and the related combination biomarkers exhibited superior diagnostic properties than plasma ones, suggesting that serum is a better matrix for further detection. Moreover, it is worth noting that individual miR-92a was promising but not powerful enough to ensure early detection, while combination markers based on miR-92a substantially increased the diagnostic performance. The combination of miR-92a and other miRNAs may be an alternative method to improve the accuracy of diagnosis and to promote them into clinical practice. As combination biomarkers with larger number of miRNA combinations (>2) may exhibit higher diagnostic accuracy than miRNA biomarkers with two combinations. Thus, an open question remains which and how many miRNAs should be combined with miR-92a to increase the diagnostic power.
There are several vital strengths from results of our study. First, we proved that miR-92a may be an excellent biomarker in the diagnosis and prognosis of CRC through a comprehensive analytic approach. Second, we discussed the diagnostic performance of combination biomarkers based on miR-92a for the first time. It was proved that the combination of miR-92a with other miRNAs could improve the diagnostic power, which may provide new ideas for clinical practice. In addition, superior to previous clinical studies that only described the diagnostic value of miR-92a but failed to elucidate the reason why it possess such characteristics, we not only performed quantitative analysis of the biomarker values in CRC but conducted an integrated bioinformatics analysis to investigate the function of miR-92a at the systems biology level.
Apart from the inspiring outcomes, there are inevitable limitations in interpreting our results. To begin with, the majority of the diagnostic tests included healthy participants as controls but they were not blind in design, which may limit the diagnostic power. Next, there was a lack of detailed information about some study characteristics with restrictions on dealing with all the data with a consistent manner. Moreover, the numbers of studies were inconsistent among different races. Accordingly, subgroup analysis could not be performed for all races, which may cause potential heterogeneity from ethnicity. In addition, although we demonstrated combination biomarkers based on miR-92a were more powerful than miR-92a alone in detecting CRC, which miRNA should be combined with miR-92a for enhancing the diagnostic performance has not been decided yet. Lastly, only few articles included the study for the prognostic meta-analysis and provided relevant data. So it is necessary to strengthen the conclusions by further validations in large prospective studies.
Conclusion
Taken together, our study comprehensively investigated the biomarker roles of miR-92a and the related combination biomarkers in CRC. It is revealed that miR-92a may be a promising biomarker in the diagnosis and prognosis of CRC, while combination biomarkers based on miR-92a provide a new alternative for clinical application with advantages over single miR-92a. Moreover, integrated bioinformatics analysis revealed the function of miR-92a in the initiation and progression of CRC. Nonetheless, more prospective well-designed studies are required to develop better diagnostic and prognostic models with higher discriminative capacity.
Acknowledgements
The authors gratefully thank the academic editor and the anonymous reviewers for their insightful comments and suggestions to improve this manuscript. Importantly, the first author QP thank his wife YS for her contributions in the manuscript and in his life.
Authors' contributions
QP and YS conducted the statistical analysis, performed the functional enrichment analysis, and drafted the manuscript. KL took part in the statistical analysis of meta-analysis. LZ and YS finished part of functional enrichment analysis, and drafted the manuscript. YZ drafted and revised the manuscript. All authors read and approved the final manuscript.
Funding
This work was supported by Jiangsu Commission of Health medical research project (H2018115), Jiangsu Medical Innovation Team (CXDT-37), Suzhou Science and Technology Development Program (SZS201509) and the Second Affiliated Hospital of Soochow University Preponderant Clinic Discipline Group Project funding (XKQ2015005).
Competing Interests
The authors have declared that no competing interest exists.
References
1. Siegel RL, Miller KD, Jemal A. Cancer statistics, 2018. CA Cancer J Clin. 2018;68:7-30
2. Siegel RL, Miller KD, Fedewa SA, Ahnen DJ, Meester RGS, Barzi A. et al. Colorectal cancer statistics, 2017. CA Cancer J Clin. 2017;67:177-93
3. Schreuders EH, Ruco A, Rabeneck L, Schoen RE, Sung JJ, Young GP. et al. Colorectal cancer screening: a global overview of existing programmes. Gut. 2015;64:1637-49
4. Robertson DJ, Imperiale TF. Stool Testing for Colorectal Cancer Screening. Gastroenterology. 2015;149:1286-93
5. Bartel DP. MicroRNAs: genomics, biogenesis, mechanism, and function. Cell. 2004;116:281-97
6. Rupaimoole R, Slack FJ. MicroRNA therapeutics: towards a new era for the management of cancer and other diseases. Nat Rev Drug Discov. 2017;16:203-22
7. Jung M, Schaefer A, Steiner I, Kempkensteffen C, Stephan C, Erbersdobler A. et al. Robust microRNA stability in degraded RNA preparations from human tissue and cell samples. Clin Chem. 2010;56:998-1006
8. Hayes J, Peruzzi PP, Lawler S. MicroRNAs in cancer: biomarkers, functions and therapy. Trends Mol Med. 2014;20:460-9
9. Chen E, Li Q, Wang H, Yang F, Min L, Yang J. MiR-92a promotes tumorigenesis of colorectal cancer, a transcriptomic and functional based study. Biomed Pharmacother. 2018;106:1370-7
10. Yang X, Zeng Z, Hou Y, Yuan T, Gao C, Jia W. et al. MicroRNA-92a as a potential biomarker in diagnosis of colorectal cancer: a systematic review and meta-analysis. PloS one. 2014;9:e88745
11. Zhou T, Zhang G, Liu Z, Xia S, Tian H. Overexpression of miR-92a correlates with tumor metastasis and poor prognosis in patients with colorectal cancer. Int J Colorectal Dis. 2013;28:19-24
12. Whiting PF, Rutjes AW, Westwood ME, Mallett S, Deeks JJ, Reitsma JB. et al. QUADAS-2: a revised tool for the quality assessment of diagnostic accuracy studies. Ann Intern Med. 2011;155:529-36
13. Stang A. Critical evaluation of the Newcastle-Ottawa scale for the assessment of the quality of nonrandomized studies in meta-analyses. Eur J Epidemiol. 2010;25:603-5
14. Reitsma JB, Glas AS, Rutjes AW, Scholten RJ, Bossuyt PM, Zwinderman AH. Bivariate analysis of sensitivity and specificity produces informative summary measures in diagnostic reviews. J Clin Epidemiol. 2005;58:982-90
15. Jones CM, Athanasiou T. Summary receiver operating characteristic curve analysis techniques in the evaluation of diagnostic tests. Ann Thorac Surg. 2005;79:16-20
16. Tierney JF, Stewart LA, Ghersi D, Burdett S, Sydes MR. Practical methods for incorporating summary time-to-event data into meta-analysis. Trials. 2007;8:16
17. Higgins JP, Thompson SG. Quantifying heterogeneity in a meta-analysis. Stat Med. 2002;21:1539-58
18. Kriston L. Dealing with clinical heterogeneity in meta-analysis. Assumptions, methods, interpretation. Int J Methods Psychiatr Res. 2013;22:1-15
19. Lin L, Chu H. Quantifying publication bias in meta-analysis. Biometrics. 2018;74(3):785-794
20. Chou CH, Shrestha S, Yang CD, Chang NW, Lin YL, Liao KW. et al. miRTarBase update 2018: a resource for experimentally validated microRNA-target interactions. Nucleic Acids Res. 2018;46:D296-D302
21. Dennis G Jr, Sherman BT, Hosack DA, Yang J, Gao W, Lane HC. et al. DAVID: Database for Annotation, Visualization, and Integrated Discovery. Genome Biol. 2003;4:P3
22. Gene Ontology C. The Gene Ontology (GO) project in 2006. Nucleic Acids Res. 2006;34:D322-6
23. Kanehisa M, Goto S. KEGG: kyoto encyclopedia of genes and genomes. Nucleic Acids Res. 2000;28:27-30
24. Szklarczyk D, Franceschini A, Wyder S, Forslund K, Heller D, Huerta-Cepas J. et al. STRING v10: protein-protein interaction networks, integrated over the tree of life. Nucleic Acids Res. 2015;43:D447-52
25. Ng EK, Chong WW, Jin H, Lam EK, Shin VY, Yu J. et al. Differential expression of microRNAs in plasma of patients with colorectal cancer: a potential marker for colorectal cancer screening. Gut. 2009;58:1375-81
26. Huang Z, Huang D, Ni S, Peng Z, Sheng W, Du X. Plasma microRNAs are promising novel biomarkers for early detection of colorectal cancer. Int J Cancer. 2010;127:118-26
27. Wu CW, Ng SS, Dong YJ, Ng SC, Leung WW, Lee CW. et al. Detection of miR-92a and miR-21 in stool samples as potential screening biomarkers for colorectal cancer and polyps. Gut. 2012;61:739-45
28. Giraldez MD, Lozano JJ, Ramirez G, Hijona E, Bujanda L, Castells A. et al. Circulating microRNAs as biomarkers of colorectal cancer: results from a genome-wide profiling and validation study. Clin Gastroenterol Hepatol. 2013;11:681-8 e3
29. Liu GH, Zhou ZG, Chen R, Wang MJ, Zhou B, Li Y. et al. Serum miR-21 and miR-92a as biomarkers in the diagnosis and prognosis of colorectal cancer. Tumour Biol. 2013;34:2175-81
30. Luo X, Stock C, Burwinkel B, Brenner H. Identification and evaluation of plasma microRNAs for early detection of colorectal cancer. PloS one. 2013;8:e62880
31. Du M, Liu S, Gu D, Wang Q, Zhu L, Kang M. et al. Clinical potential role of circulating microRNAs in early diagnosis of colorectal cancer patients. Carcinogenesis. 2014;35:2723-30
32. Zheng G, Du L, Yang X, Zhang X, Wang L, Yang Y. et al. Serum microRNA panel as biomarkers for early diagnosis of colorectal adenocarcinoma. Br J Cancer. 2014;111:1985-92
33. Elshafei A, Shaker O, Abd El-Motaal O, Salman T. The expression profiling of serum miR-92a, miR-375, and miR-760 in colorectal cancer: An Egyptian study. Tumour Biol. 2017;39:1010428317705765
34. Liu HN, Liu TT, Wu H, Chen YJ, Tseng YJ, Yao C. et al. Serum microRNA signatures and metabolomics have high diagnostic value in colorectal cancer using two novel methods. Cancer Sci. 2018;109:1185-94
35. Fu F, Jiang W, Zhou L, Chen Z. Circulating Exosomal miR-17-5p and miR-92a-3p Predict Pathologic Stage and Grade of Colorectal Cancer. Transl Oncol. 2018;11:221-32
36. Wang Q, Huang Z, Ni S, Xiao X, Xu Q, Wang L. et al. Plasma miR-601 and miR-760 are novel biomarkers for the early detection of colorectal cancer. PloS one. 2012;7:e44398
37. Wang J, Huang SK, Zhao M, Yang M, Zhong JL, Gu YY. et al. Identification of a circulating microRNA signature for colorectal cancer detection. PloS one. 2014;9:e87451
38. Chang PY, Chen CC, Chang YS, Tsai WS, You JF, Lin GP. et al. MicroRNA-223 and microRNA-92a in stool and plasma samples act as complementary biomarkers to increase colorectal cancer detection. Oncotarget. 2016;7:10663-75
39. Ke TW, Wei PL, Yeh KT, Chen WT, Cheng YW. MiR-92a Promotes Cell Metastasis of Colorectal Cancer Through PTEN-Mediated PI3K/AKT Pathway. Ann Surg Oncol. 2015;22:2649-55
40. Conev NV, Donev IS, Konsoulova-Kirova AA, Chervenkov TG, Kashlov JK, Ivanov KD. Serum expression levels of miR-17, miR-21, and miR-92 as potential biomarkers for recurrence after adjuvant chemotherapy in colon cancer patients. Biosci Trends. 2015;9:393-401
41. Peng Q, Shen Y, Lin K, Zou L, Shen Y, Zhu Y. Comprehensive and integrative analysis identifies microRNA-106 as a novel non-invasive biomarker for detection of gastric cancer. J Transl Med. 2018;16:127
42. Peng Q, Zhang X, Min M, Zou L, Shen P, Zhu Y. The clinical role of microRNA-21 as a promising biomarker in the diagnosis and prognosis of colorectal cancer: a systematic review and meta-analysis. Oncotarget. 2017;8:44893-909
43. Otto T, Sicinski P. Cell cycle proteins as promising targets in cancer therapy. Nat Rev Can. 2017;17:93-115
44. Yadav RK, Chauhan AS, Zhuang L, Gan B. FoxO transcription factors in cancer metabolism. Semin Cancer Biol. 2018;50:65-76
45. Theocharis AD, Karamanos NK. Proteoglycans remodeling in cancer: Underlying molecular mechanisms. Matrix Biol. 2019;75-76:220-259
46. Mayer IA, Arteaga CL. The PI3K/AKT Pathway as a Target for Cancer Treatment. Annu Rev Med. 2016;67:11-28
47. Wu F, Liu F, Dong L, Yang H, He X, Li L. et al. miR-1273g silences MAGEA3/6 to inhibit human colorectal cancer cell growth via activation of AMPK signaling. Cancer Lett. 2018;435:1-9
48. Vinson KE, George DC, Fender AW, Bertrand FE, Sigounas G. The Notch pathway in colorectal cancer. Int J Cancer. 2016;138:1835-42
49. Zhao M, Mishra L, Deng CX. The role of TGF-beta/SMAD4 signaling in cancer. Int J Biol Sci. 2018;14:111-23
50. Mello SS, Attardi LD. Deciphering p53 signaling in tumor suppression. Curr Opin Cell Biol. 2018;51:65-72
51. Zhan T, Rindtorff N, Boutros M. Wnt signaling in cancer. Oncogene. 2017;36:1461-73
52. Soni S, Padwad YS. HIF-1 in cancer therapy: two decade long story of a transcription factor. Acta Oncol. 2017;56:503-15
53. Erickson KE, Rukhlenko OS, Posner RG, Hlavacek WS, Kholodenko BN. New insights into RAS biology reinvigorate interest in mathematical modeling of RAS signaling. Semin Cancer Biol. 2019;54:162-173
Author contact
![]() Corresponding author: Yaqun Zhu, Dept. of Radiotherapy & Oncology, The Second Affiliated Hospital of Soochow University, San Xiang Road No. 1055, Suzhou, Jiangsu 215004, China. Tel +86-512-67784826; Fax +86-512-68284303; Email szzhuyaquncom
Corresponding author: Yaqun Zhu, Dept. of Radiotherapy & Oncology, The Second Affiliated Hospital of Soochow University, San Xiang Road No. 1055, Suzhou, Jiangsu 215004, China. Tel +86-512-67784826; Fax +86-512-68284303; Email szzhuyaquncom

 Global reach, higher impact