Journal of Cancer
ISSN: 1837-9664
3.2
Impact Factor
ISSN: 1837-9664

 Global reach, higher impact
J Cancer 2019; 10(17):3883-3892. doi:10.7150/jca.31286 This issue Cite
Research Paper
Novel preoperative nutritional assessment tool and prognostic model for ESCC patients
Jinming Xu1, Jinlin Cao1, Ying Wang2, Xin Yao3, Yiqing Wang1, Zhehao He1, Wang Lv1, Jian Hu1 ![]()
1. Department of Thoracic Surgery, the First Affiliated Hospital, Zhejiang University School of Medicine, Hangzhou 310003, China.
2. Operating Room, the First Affiliated Hospital, Zhejiang University School of Medicine, Hangzhou 310003, China.
3. Department of Gastroenterology, the First Affiliated Hospital, Zhejiang University School of Medicine, Hangzhou 310003, China.
Received 2018-11-6; Accepted 2019-5-8; Published 2019-6-10
Citation:
Xu J, Cao J, Wang Y, Yao X, Wang Y, He Z, Lv W, Hu J. Novel preoperative nutritional assessment tool and prognostic model for ESCC patients. J Cancer 2019; 10(17):3883-3892. doi:10.7150/jca.31286. https://www.jcancer.org/v10p3883.htm
Other stylesAbstract
Background: Esophageal squamous cell carcinoma (ESCC) is one of the most aggressive tumor types worldwide, and malnutrition prevails in these patients. However, there is no preoperative nutritional assessment tool specifically designed for patients with ESCC.
Methods: Patients who received esophagectomy from 2004 to 2016 were consecutively included. The preoperative nutritional risk factors for ESCC were screened by univariate and multivariate Cox regression analysis to construct a new nutritional scoring tool. A prognostic model of ESCC based on the new scoring tool was further proposed.
Results: A total of 510 ESCC patients were enrolled. A novel BLUT (BMI-lymphocyte-uric acid-triglyceride) scoring tool based on BMI, lymphocyte count, uric acid level, and triglyceride level was proposed, which could effectively predict the prognosis of ESCC patients (log rank P<0.001), and it was better than the traditional nutritional assessment tools. The C-index and 95% confidence interval (CI) of the nomogram based on the BLUT scoring tool was 0.735(0.698-0.772). It had good prognostic efficacy and was significantly better than the model based on T stage and N stage (P=0.038). The calibration curve of internal and external validation suggested a good fitting effect with the real situation in judging the 1-year, 3-year, and 5-year survival status.
Conclusions: The BULT scoring tool could distinguish the heterogeneity of preoperative nutritional status and the BLUT-based nomogram had good prognostic performance for ESCC patients.
Keywords: esophageal squamous cell carcinoma, nutritional assessment tool, prognostic model
1. Introduction
Esophageal cancer is one of the most aggressive cancer types in China (1) and across the world (2), and esophageal squamous cell carcinoma (ESCC) is the most common pathological subtype. As the development of preoperative new adjuvant therapy, postoperative adjuvant therapy and enhanced recovery after surgery (ERAS), the surgery-based comprehensive treatment model has improved the prognosis of esophageal cancer in the past decades (3, 4). However, the 5-year survival rate was still not satisfied, which only ranged from 15% to 25% (5). It has been reported that weight loss, malnutrition and cachexia prevailed in most patients with esophageal cancer (6). Malnutrition could impact the short-term and long-term clinical outcomes of esophageal cancer patients, such as surgical complications and poor survival (7). Thus, nutritional management plays an important role in the treatment process (8).
Nutritional screening and assessment are indispensable to guide rational nutritional treatment. Nutrition risk screening (NRS 2002) was the first international evidence-based nutritional screening tool (9). Since the 1970s, many nutritional assessment tools emerged, such as the patient generated-subjective global assessment (PG-SGA) tool (10), mini nutritional assessment (MNA) tool (11) and malnutrition universal screening tool (MUST) (12). However, these tools were limited to their inevitable subjective assessments. By contrast, nutritional assessment tools based on objective indexes could reflect the nutritional status more accurately, such as the prognostic nutritional index (PNI) (13), controlling nutritional status (CONUT) (14), and geriatric nutritional risk index (GNRI) (15) and so on.
So far, there is no preoperative nutritional assessment tool specifically designed for ESCC patients. Therefore, we designed a retrospective study to propose a novel nutritional scoring tool and a prognostic nomogram for ESCC patients.
2. Materials and methods
2.1. Study population
Patients who received esophagectomy from Jan. 1st, 2004 to Dec. 31, 2016 in the Department of Thoracic Surgery, the First Affiliated Hospital, Zhejiang University School of Medicine were consecutively included. The clinical and pathological information of these patients were collected. The inclusion and exclusion criteria were as follow: (1) more than 18 years old; (2) pathologically diagnosed as ESCC; (3) had no history of other malignancies; (4) had complete preoperative laboratory test information and height and weight information. The pathological staging of the tumor was conducted according to the American Joint Commission on Cancer/Union for International Cancer Control (AJCC/UICC 8th version) tumor-node-metastasis (TNM) staging manuals (16). All patients were enrolled with written informed consent under institutional review board-approved protocols of the First Affiliated Hospital, Zhejiang University School of Medicine. This study was performed in accordance with the principles of Declaration of Helsinki.
The follow-up information was collected from the outpatient clinical system, as well as the regular telephone follow-up. The last follow-up time was January 2018. The follow-up time ranged from 1.9 months to 134.0 months, and the mean follow-up time was 35.1 months.
2.2. Statistically analysis
The cohort was randomly divided into the training set and validation set in ratio 4:1 by SPSS software and the initial seed was 20180101. The cut-off values of continuous variables were determined by the X-tile software (http://www.tissuearray.org/rimmlab) and by the minimal P value approach (17). Univariate and multivariate Cox regression analyses were conducted to screen potential risk indexes for ESCC, and the results were shown in the form of hazard ratios (HRs) and their 95% confidence intervals (CIs). The survival difference was assessed by the log rank tests and Kaplan-Meier curves. A new nutritional scoring tool was proposed, and the indexes were selected for both statistical and clinical consideration (18). A nutritional tool-based nomogram was further constructed. Harrell's concordance index (C-index), which ranged from 0.5 (denotes random splitting) to 1.0 (perfect prediction), was adopted to assess the discrimination efficacy (19). Besides, bootstrap technique with 1000 repetitions was used for internal and external validation and to calculate the 95% CIs (18, 20). Akaike information criterion (AIC) was used to assess the predictive efficacy, and smaller AIC values represent more accurate prognostic stratification (21). The detail definition of PNI, GNRI and CONUT assessment tools was shown in the Supplementary Methods.
All analyses were conducted using the SPSS 22.0 software (IBM SPSS Inc. United States), and R software version 3.2.2 (The R Foundation for Statistical Computing) with the rms, survival and hmisc statistical packages. Statistical significance was set at P < 0.05 (All P values presented were 2-sided).
3. Results
3.1. Characteristics of included patients
A total of 510 ESCC patients were enrolled in this study and there were 408 cases of training set and 102 cases of validation set. The baseline characteristics of included cases were shown in Table 1. The training set was selected to construct a new scoring tool, and the validation set was selected to test the prognostic model. Continuous variables were converted to categorical variables by X-tile software, as shown in Supplementary Figure 1.
3.2. Indexes selection by univariate and multivariate Cox regression analyses
Univariate Cox regression analysis was performed in the training set population, and the results suggested that gender (P=0.008), smoking (P=0.038), surgical approach (P=0.042), T stage (P<0.001), N stage (P<0.001), white blood cell (P=0.022), lymphocyte (P=0.036), triglyceride (P=0.004), uric acid (P=0.016) and BMI (P=0.016) were significantly associated with the prognosis of ESCC patients, as shown in Table 2. All these statistically significant indexes were further included in the multivariate Cox regression analysis. It suggested that gender (P=0.003), T stage (P=0.005), N stage (P<0.001), white blood cell (P=0.015), lymphocyte (P=0.030) and uric acid (P=0.007) were independent prognostic factors for ESCC patients.
Table 1
Baseline characteristics of included ESCC patients.
| Variable | Total cohort(n=510) | Training set(n=408) | Validation set(n=102) | |||
|---|---|---|---|---|---|---|
| number(percentage) | number(percentage) | number(percentage) | ||||
| Gender | ||||||
| Male | 444 | 87.06% | 355 | 87.01% | 89 | 87.25% |
| Female | 66 | 12.94% | 53 | 12.99% | 13 | 12.75% |
| Age(years) | ||||||
| ≤59 | 157 | 30.78% | 143 | 35.05% | 14 | 13.73% |
| 60-69 | 248 | 48.63% | 192 | 47.06% | 56 | 54.90% |
| ≥70 | 105 | 20.59% | 82 | 20.10% | 23 | 22.55% |
| Alcohol | ||||||
| No | 178 | 34.90% | 146 | 35.78% | 32 | 31.37% |
| Yes | 332 | 65.10% | 262 | 64.22% | 70 | 68.63% |
| Smoking | ||||||
| No | 164 | 32.16% | 130 | 31.86% | 34 | 33.33% |
| Yes | 346 | 67.84% | 278 | 68.14% | 68 | 66.67% |
| Education | ||||||
| Primary school and below | 309 | 60.59% | 242 | 59.31% | 67 | 65.69% |
| Middle school and above | 201 | 39.41% | 166 | 40.69% | 35 | 34.31% |
| Hypertension | ||||||
| No | 337 | 66.08% | 309 | 75.74% | 28 | 27.45% |
| Yes | 133 | 26.08% | 99 | 24.26% | 34 | 33.33% |
| Surgical approach | ||||||
| Sweet | 236 | 46.27% | 198 | 48.53% | 38 | 37.25% |
| Ivor-Lewis | 205 | 40.20% | 153 | 37.50% | 52 | 50.98% |
| Mckeown | 69 | 13.53% | 57 | 13.97% | 12 | 11.76% |
| Margin | ||||||
| Negative | 487 | 95.49% | 389 | 95.34% | 98 | 96.08% |
| Positive | 23 | 4.51% | 19 | 4.66% | 4 | 3.92% |
| Tumor location | ||||||
| Upper | 45 | 8.82% | 38 | 9.31% | 7 | 6.86% |
| Middle | 355 | 69.61% | 277 | 67.89% | 78 | 76.47% |
| Lower | 110 | 21.57% | 93 | 22.79% | 17 | 16.67% |
| Differentiation | ||||||
| Well | 49 | 9.61% | 37 | 9.07% | 12 | 11.76% |
| Moderate | 288 | 56.47% | 235 | 57.60% | 53 | 51.96% |
| Poor | 173 | 33.92% | 136 | 33.33% | 37 | 36.27% |
| T stage | ||||||
| T1a | 37 | 7.25% | 31 | 30.39% | 6 | 5.88% |
| T1b | 66 | 12.94% | 52 | 12.75% | 14 | 13.73% |
| T2 | 111 | 21.76% | 90 | 22.06% | 21 | 20.59% |
| T3 | 255 | 50.00% | 206 | 50.49% | 49 | 48.04% |
| T4a | 40 | 7.84% | 28 | 6.86% | 12 | 11.76% |
| T4b | 1 | 0.20% | 1 | 0.25% | 0 | 0.00% |
| N stage | ||||||
| N0 | 284 | 55.69% | 221 | 54.17% | 63 | 61.76% |
| N1 | 144 | 28.24% | 120 | 29.41% | 24 | 23.53% |
| N2 | 52 | 10.20% | 42 | 10.29% | 10 | 9.80% |
| N3 | 30 | 5.88% | 25 | 6.13% | 5 | 4.90% |
| AJCC-TNM stage | ||||||
| IA | 11 | 2.16% | 8 | 1.96% | 3 | 2.94% |
| IB | 82 | 16.08% | 67 | 16.42% | 15 | 14.71% |
| IIA | 100 | 19.61% | 78 | 19.12% | 22 | 21.57% |
| IIB | 96 | 18.82% | 76 | 18.63% | 20 | 19.61% |
| IIIA | 30 | 5.88% | 24 | 5.88% | 6 | 5.88% |
| IIIB | 149 | 29.22% | 121 | 29.66% | 28 | 27.45% |
| IVA | 42 | 8.24% | 34 | 8.33% | 8 | 7.84% |
| IVB | 0 | 0.00% | 0 | 0.00% | 0 | 0.00% |
| Postoperative treatment | ||||||
| None | 315 | 61.76% | 249 | 61.03% | 66 | 64.71% |
| Radiation | 36 | 7.06% | 33 | 8.09% | 3 | 2.94% |
| Chemotherapy | 54 | 10.59% | 45 | 11.03% | 9 | 8.82% |
| Oral chemotherapy | 28 | 5.49% | 22 | 5.39% | 6 | 5.88% |
| Chemoradiotherapy | 51 | 10.00% | 40 | 9.80% | 11 | 10.78% |
| Traditional Chinese medicine | 26 | 5.10% | 19 | 4.66% | 7 | 6.86% |
| Hospital day | 24.17±14.62 | 24.02±12.87 | 24.75±20.23 | |||
| Postoperative hospital day | 16.48±14.90 | 16.29±13.23 | 17.24±20.32 | |||
| Hemoglobin (HB)(g/L) | 138.91±15.28 | 139.11±15.10 | 138.12±16.03 | |||
| White blood cell (WBC)(109/L) | 6.02±1.81 | 6.08±1.89 | 5.74±1.43 | |||
| Lymphocyte (LY)(109/L) | 1.62±0.54 | 1.63±0.54 | 1.59±0.51 | |||
| Total protein (TP)(g/L) | 69.60±6.01 | 69.61±5.87 | 69.58±6.56 | |||
| Albumin (ALB)(g/L) | 43.81±4.47 | 43.92±4.44 | 43.36±4.58 | |||
| Triglyceride (TG)(mmol/L) | 1.28±0.65 | 1.30±0.67 | 1.21±0.55 | |||
| Cholesterol (CH)(mmol/L) | 4.59±0.95 | 4.60±0.91 | 4.55±1.11 | |||
| Fasting glucose(mmol/L) | 5.04±0.90 | 5.03±0.92 | 5.09±0.79 | |||
| Uric acid (UA)(umol/L) | 328.51±85.28 | 330.35±88.28 | 321.16±71.96 | |||
| Height(cm) | 166.77±6.35 | 166.65±6.31 | 167.24±6.50 | |||
| Weight(kg) | 61.06±9.13 | 60.61±9.14 | 62.84±8.94 | |||
| BMI(kg/m2) | 21.91±2.73 | 21.78±2.72 | 22.44±2.71 | |||
| Maximum diameter of tumor (cm) | 3.72±1.79 | 3.67±1.76 | 3.93±1.89 | |||
S.D.: standard deviation.
Table 2
Univariate and multivariate Cox regression analysis of the training set ESCC population.
| Variable | Total | Event | Percentage | HR1(95% CI) | P value1 | HR2(95% CI) | P value2 |
|---|---|---|---|---|---|---|---|
| Gender | |||||||
| Male | 355 | 168 | 47.32% | 1 | 1 | ||
| Female | 53 | 11 | 20.75% | 0.439(0.238-0.807) | 0.008 | 0.357(0.179-0.712) | 0.003 |
| Age(years) | 0.408 | ||||||
| ≤59 | 134 | 67 | 50.00% | 1 | |||
| 60-69 | 192 | 80 | 41.67% | 0.833(0.602-1.153) | 0.271 | ||
| ≥70 | 82 | 32 | 39.02% | 0.780(0.512-1.189) | 0.249 | ||
| Alcohol | |||||||
| No | 146 | 58 | 39.73% | 1 | |||
| Yes | 262 | 121 | 46.18% | 1.163(0.850-1.590) | 0.346 | ||
| Smoking | |||||||
| No | 130 | 44 | 33.85% | 1 | 1 | ||
| Yes | 278 | 135 | 48.56% | 1.435(1.021-2.016) | 0.038 | 1.093(0.742-1.611) | 0.653 |
| Education | |||||||
| Primary school and below | 242 | 97 | 40.08% | 1 | |||
| Middle school and above | 166 | 82 | 49.40% | 1.232(0.918-1.654) | 0.164 | ||
| Hypertension | |||||||
| No | 309 | 135 | 43.69% | 1 | |||
| Yes | 99 | 44 | 44.44% | 1.017(0.724-1.430) | 0.921 | ||
| Surgical approach | 0.042 | 0.569 | |||||
| Sweet | 198 | 99 | 50.00% | 1 | 1 | ||
| Ivor-Lewis | 153 | 66 | 43.14% | 0.353(0.632-1.178) | 0.353 | 0.880(0.630-1.230) | 0.456 |
| Mckeown | 57 | 14 | 24.56% | 0.491(0.281-0.860) | 0.013 | 1.182(0.661-2.114) | 0.573 |
| Margin | |||||||
| Negative | 389 | 166 | 42.67% | 1 | |||
| Positive | 19 | 13 | 68.42% | 1.603(0.912-2.820) | 0.101 | ||
| Tumor location | 0.485 | ||||||
| Upper | 38 | 15 | 39.47% | 1 | |||
| Middle | 277 | 129 | 46.57% | 1.180(0.691-2.014) | 0.554 | ||
| Lower | 93 | 35 | 37.63% | 0.953(0.521-1.746) | 0.877 | ||
| Differentiation | 0.097 | ||||||
| Well | 37 | 11 | 29.73% | 1 | |||
| Moderate | 235 | 96 | 40.85% | 1.374(0.736-2.564) | 0.318 | ||
| Poor | 136 | 72 | 52.94% | 1.781(0.944-3.359) | 0.075 | ||
| T stage | <0.001 | 0.005 | |||||
| T1 | 83 | 16 | 19.28% | 1 | 1 | ||
| T2 | 90 | 28 | 31.11% | 2.027(1.097-3.748) | 0.024 | 1.495(0.799-2.798) | 0.209 |
| T3 | 206 | 114 | 55.34% | 3.622(2.146-6.155) | <0.001 | 2.197(1.250-3.861) | 0.006 |
| T4 | 29 | 21 | 72.41% | 7.509(3.906-14.434) | <0.001 | 3.344(1.612-6.936) | 0.001 |
| N stage | <0.001 | <0.001 | |||||
| N0 | 221 | 64 | 28.96% | 1 | 1 | ||
| N1 | 120 | 60 | 50.00% | 2.220(1.559-3.162) | <0.001 | 1.851(1.274-2.688) | 0.001 |
| N2 | 42 | 32 | 76.19% | 4.674(3.045-7.174) | <0.001 | 3.208(1.999-5.149) | <0.001 |
| N3 | 25 | 23 | 92.00% | 7.514(4.623-12.212) | <0.001 | 4.958(2.930-8.389) | <0.001 |
| Postoperative treatment | |||||||
| No | 249 | 114 | 45.78% | 1 | |||
| Yes | 159 | 65 | 40.88% | 0.981(0.722-1.322) | 0.903 | ||
| Hemoglobin (g/L) | |||||||
| 77-147 | 277 | 129 | 46.57% | 1 | |||
| 148-173 | 131 | 50 | 38.17% | 0.822(0.593-1.139) | 0.239 | ||
| White blood cell (109/L) | |||||||
| 2.6-5.5 | 182 | 67 | 36.81% | 1 | 1 | ||
| 5.6-18.1 | 226 | 112 | 49.56% | 1.424(1.052-1.928) | 0.022 | 1.524(1.084-2.142) | 0.015 |
| Lymphocyte (109/L) | |||||||
| 0.5-1.2 | 101 | 53 | 52.48% | 1 | 1 | ||
| 1.3-4.0 | 307 | 126 | 41.04% | 0.709(0.514-0.978) | 0.036 | 0.676(0.475-0.962) | 0.030 |
| Total protein (g/L) | |||||||
| 54.7-66.0 | 124 | 60 | 48.39% | 1 | |||
| 66.1-92.1 | 284 | 119 | 41.90% | 0.846(0.620-1.154) | 0.291 | ||
| Albumin (g/L) | |||||||
| 30-49.5 | 362 | 167 | 46.13% | 1 | |||
| 49.6-56.4 | 46 | 12 | 26.09% | 0.656(0.365-1.178) | 0.158 | ||
| Triglyceride (mmol/L) | |||||||
| 0.43-1.33 | 262 | 130 | 49.62% | 1 | 1 | ||
| 1.34-6.05 | 146 | 49 | 33.56% | 0.618(0.445-0.859) | 0.004 | 0.826(0.581-1.173) | 0.286 |
| Cholesterol (mmol/L) | |||||||
| 1.68-3.63 | 172 | 82 | 47.67% | 1 | |||
| 3.64-8.58 | 236 | 97 | 41.10% | 0.842(0.628-1.130) | 0.253 | ||
| Fasting glucose (mmol/L) | |||||||
| 2.89-4.38 | 75 | 29 | 38.67% | 1 | |||
| 4.39-12.96 | 333 | 150 | 45.05% | 1.482(0.995-2.208) | 0.053 | ||
| Uric acid (umol/L) | |||||||
| 117-333 | 228 | 111 | 48.68% | 1 | 1 | ||
| 334-684 | 180 | 68 | 37.78% | 0.691(0.510-0.934) | 0.016 | 0.643(0.466-0.888) | 0.007 |
| BMI(kg/m2) | |||||||
| 15.79-20.70 | 143 | 71 | 49.65% | 1 | 1 | ||
| 20.76-32.60 | 265 | 108 | 40.75% | 0.691(0.512-0.933) | 0.016 | 0.908(0.661-1.247) | 0.552 |
HR1 and P1: univariate Cox regression results.
HR2 and P2: multivariate Cox regression results.
For both statistical and clinical consideration, the indexes which were selected in the scoring tool had to meet the following criteria: (1) it should be statistically significant at least in the univariate Cox regression analysis; (2) it could reflect the patients' nutritional or metabolic status. Finally, BMI, lymphocyte count, uric acid level, and triglyceride level were selected to construct a new BLUT (BMI-lymphocyte-uric acid-triglyceride) nutritional assessment tool.
3.3. Definition and simplification of BLUT nutritional assessment tool
The weight of each index was assessed by the Cox regression model, which was based on the visualization of a nomogram, as shown in Figure 1A and Table 3. Indexes were given different risk scores and divided into the positive risk and negative risk categories. According to the weight scores of the four indexes, each patient was given a total score and a Kaplan-Meier curve was conducted, as shown in Supplementary Figure 2. The log rank test suggested the BLUT tool had significant prognostic performance in ESCC patients (P=0.049). However, this tool was complicated in this form and lacked of clinical practicability.
Thus, a simplified definition of BLUT tool was proposed based on the number of indexes in positive risk category, as shown in Table 4. If there was no index in the positive risk category, it was defined as normal. If there was 1 index, or there were 2 indexes or ≥3 indexes in the positive risk category, it was defined as low, moderate and high malnutrition risk, respectively. The Kaplan-Meier curve of the simplified tool was shown in Figure 1B, with a log rank P value <0.001. Subgroup analysis was further conducted in those patients with positive lymph nodes and BLUT showed significant prognostic value for those receiving post-surgery treatment, as shown in the Supplementary Table 1 and Supplementary Figure 3.
Table 3
Index categories and scores weighted by the nomogram model.
| Variable | Category | Scores | Risk |
|---|---|---|---|
| BMI(kg/m2) | low(≤20.7) | 7.23 | Positive |
| high(>20.7) | 0 | Negative | |
| Lymphocyte (LY)(109/L) | low (≤1.2) | 7.45 | Positive |
| high (>1.2) | 0 | Negative | |
| Uric acid (UA)(umol/L) | low (≤333) | 6.24 | Positive |
| high (>333) | 0 | Negative | |
| Triglyceride (TG)(mmol/L) | low(≤1.33) | 10 | Positive |
| high(>1.33) | 0 | Negative |
3.4. Comparison of PNI, GNRI, CONUT and BLUT assessment tools
The prognostic efficacy of PNI, GNRI, CONUT and BLUT assessment tools in ESCC patients was compared, as shown in Figure 2 and Table 5. The cut-off value of PNI was defined by the X-tile analysis, as shown in the Supplementary Figure 4. The log rank P values of PNI, CONUT and GNRI were 0.153, 0.098 and 0.174, respectively, indicating limited prognostic performance. The univariate analysis indicated that BLUT was significantly associated with the prognosis of ESCC (P<0.001). In addition, the multivariate Cox regression analysis also suggested that BLUT was an independent prognostic factor for ESCC patients (P=0.003), as shown in Table 6. Compared with PNI, CONUT and GNRI, the BLUT assessment tool had more rational population distribution in different malnutrition risk categories, and also suggested better predictive accuracy.
Figure 1
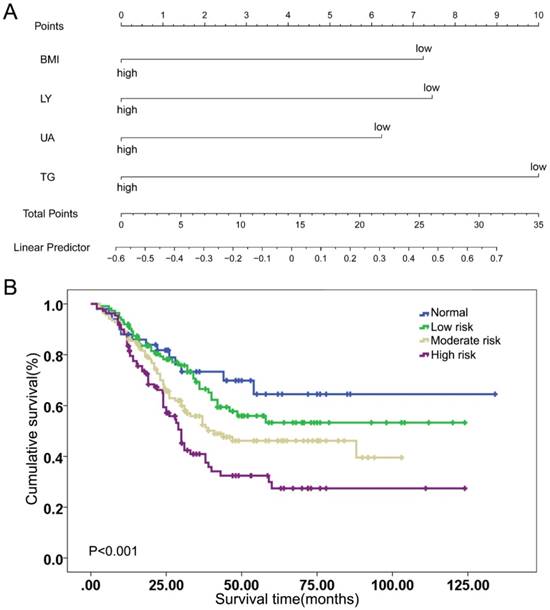
Indexes weight and simplification of BLUT nutritional assessment tool. (A) BMI, LY, UA and TG weight scores according to visualization of nomogram model, (B) Kaplan-Meier curve of simplified BLUT scoring tool (log rank P<0.001).
Figure 2
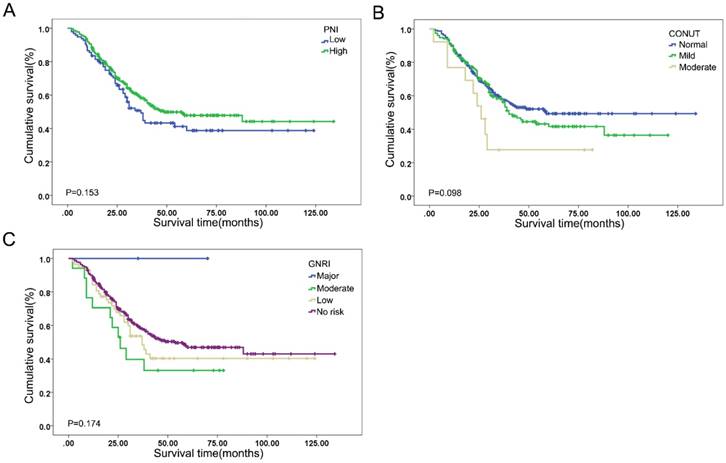
Kaplan-Meier curves of (A) PNI (log rank P=0.153), (B) CONUT (log rank P=0.098), and (C) GNRI (log rank P=0.174).
Table 4
Simplified definition of BLUT scoring tool.
| BLUT category | Score interval | Status of BMI, LY, UA and TG |
|---|---|---|
| Normal | 0.00 | No index in the positive risk category |
| Low malnutrition risk | 6.24-10.00 | Any 1 index in the positive risk category |
| Moderate malnutrition risk | 13.47-17.45 | Any 2 indexes in the positive risk category |
| High malnutrition risk | 20.92-30.92 | Equal to or more than 3 indexes in the positive risk category |
Table 5
Univariate Cox regression analysis of PNI, CONUT, GNRI and BLUT assessment tools in ESCC patients.
| Assessment tool | Total | Event | Percentage | HR (95%CI) | P value1 | P-value2 |
|---|---|---|---|---|---|---|
| PNI | 0.153 | |||||
| low | 97 | 51 | 52.58% | 1 | ||
| high | 311 | 128 | 41.16% | 0.791(0.571-1.094) | 0.156 | |
| CONUT | 0.108 | 0.098 | ||||
| normal | 241 | 98 | 40.66% | 1 | ||
| mild malnutrition | 154 | 72 | 46.75% | 1.142(0.842-1.548) | 0.393 | |
| moderate malnutrition | 13 | 9 | 69.23% | 2.049(1.034-4.059) | 0.040 | |
| severe malnutrition | 0 | 0 | 0 | NA | NA | |
| GNRI | 0.321 | 0.174 | ||||
| no risk | 332 | 138 | 41.57% | 1 | ||
| low risk | 57 | 30 | 52.63% | 1.237(0.833-1.837) | 0.291 | |
| moderate risk | 17 | 11 | 64.71% | 1.679(0.909-3.104) | 0.098 | |
| major risk | 2 | 0 | 0.00% | NA | NA | |
| BLUT | <0.001 | <0.001 | ||||
| Normal | 50 | 14 | 28.00% | 1 | ||
| Low malnutrition risk | 112 | 40 | 35.71% | 1.302(0.708-2.394) | 0.395 | |
| Moderate malnutrition risk | 137 | 63 | 45.99% | 1.849(1.036-3.300) | 0.038 | |
| High malnutrition risk | 109 | 62 | 56.88% | 2.699(1.510-4.826) | 0.001 |
P value1: univariate Cox regression analysis.
P value2: log rank test.
Table 6
Multivariate Cox regression analysis of BLUT assessment tool in ESCC patients.
| Variable | HR (95%CI) | P value |
|---|---|---|
| Gender | ||
| Male | 1 | |
| Female | 0.348(0.188-0.644) | <0.001 |
| T stage | 0.007 | |
| T1 | 1 | |
| T2 | 1.430(0.764-2.678) | 0.264 |
| T3 | 2.208(1.265-3.853) | 0.005 |
| T4 | 3.022(1.444-6.324) | 0.003 |
| N stage | <0.001 | |
| N0 | 1 | |
| N1 | 1.724(1.188-2.502) | 0.004 |
| N2 | 3.270(2.020-5.293) | <0.001 |
| N3 | 5.108(3.076-8.482) | <0.001 |
| BLUT category | 0.003 | |
| Normal | 1 | |
| Low malnutrition risk | 1.211(0.655-2.240) | 0.541 |
| Moderate malnutrition risk | 1.614(0.894-2.916) | 0.112 |
| High malnutrition risk | 2.307(1.279-4.161) | 0.006 |
3.5. A clinical nomogram based on preoperative nutritional assessment
In order to further analyze the prognostic value of the BLUT tool and to build a precise nutritional assessment-based model, a clinical nomogram based on gender, T stage, N stage and the BLUT tool was proposed, as shown in Figure 3A. The nomogram suggested good prognostic performance in both training set (log rank P<0.001) and validation set (log rank P=0.024), as shown in Figure 3B and 3C. The C-index and 95% CI of the nomogram was 0.735(0.698-0.772), and the AIC value was 1864.76. It had good prognostic efficacy and was significantly better than the model based on T stage and N stage (P=0.038), as shown in Table 7. Compared with other nutritional assessment based model, BLUT based nomogram had the highest C-index and the smallest AIC value, which further indicated that BLUT tool based model had more accurate discriminatory utility. The calibration curve of internal validation suggested that the BLUT based model had a high degree of similarity with the real situation in judging the 1-year, 3-year, and 5-year survival status, as shown in Supplementary Figure 5A, 5B and 5C. The external validation results also suggested good fitting effect (Supplementary Figure 5D, 5E and 5F), indicating that the BLUT score based ESCC prognosis model could be applied to other population cohorts.
Table 7
Comparison of different models based on different nutritional assessment tools.
| Model | C-index | AIC value |
|---|---|---|
| T stage+N stage | 0.714(0.676-0.752) | 1887.49 |
| T stage+N stage+PNI | 0.719(0.681-0.757) | 1886.48 |
| T stage+N stage+GNRI | 0.721(0.683-0.759) | 1889.00 |
| T stage+N stage+CONUT | 0.718(0.680-0.756) | 1885.56 |
| T stage+N stage+BLUT | 0.728(0.691-0.765) | 1878.35 |
| T stage+N stage+PNI+Gender | 0.726(0.688-0.764) | 1875.03 |
| T stage+N stage+GNRI+Gender | 0.730(0.693-0.767) | 1878.10 |
| T stage+N stage+CONUT+Gender | 0.726(0.689-0.763) | 1874.77 |
| T stage+N stage+BLUT+Gender | 0.735(0.698-0.772) | 1864.76 |
4. Discussion
The study proposed a new BLUT nutritional assessment tool by rigorous index selection and tool simplification, and also compared the prognostic performance between BLUT tool and traditional nutritional assessment tools, including PNI, CONUT and GNRI. In addition, a BLUT-based clinical nomogram was further proposed, which was significantly better than the T stage and N stage based model.
The prognostic value of PNI (log rank P=0.153), CONUT (log rank P=0.098) and GNRI (log rank P=0.174) in ESCC patients was limited. In contrast, BLUT assessment tool was an independent prognostic factor for ESCC patients, which had more rational population distribution in different malnutrition risk categories and better predictive accuracy. Besides, the simplification process enabled BLUT as a simple, convenient and efficient nutritional assessment tool, which could be easily applied in clinical practice. Clinicians could quickly distinguish the preoperative malnutrition risk of ESCC patients by counting the number of indexes in positive risk intervals. On the other hand, a nutritional tool based clinical nomogram could help clinicians precisely predict the prognosis of ESCC patients. The complementarity of the two aspects can help to make quick and accurate clinical decisions.
Figure 3
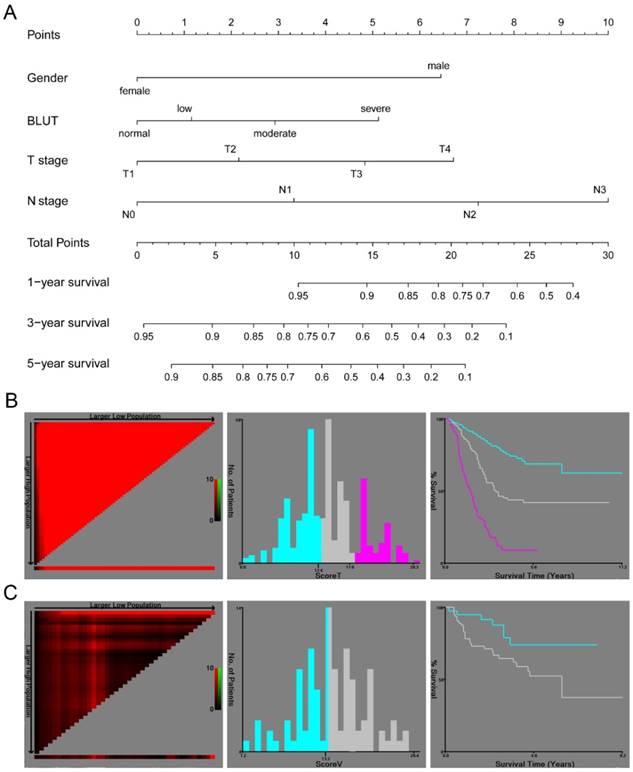
A clinical nomogram based on BLUT nutritional assessment tool. (A) Nomogram based on gender, BLUT, T stage and N stage, (B) Kaplan-Meier curve of the nomogram model by X-tile software in training set population (log rank P<0.001), (C) Kaplan-Meier curve of the nomogram model by X-tile software in validation set population (log rank P=0.024).
PNI tool was firstly proposed by Onodera et al. (13) in 1984, which was based on 189 digestive tract cancer patients with malnutrition and received parenteral nutrition treatment. Although several studies have proved that PNI could predict the prognosis of ESCC patients who received surgery (22-24), it should be noted that the cut-off value of PNI was controversial (24) and its independent prognostic role in ESCC patients was not determined (22). CONUT was proposed by Ignacio et al. (14), which included 53 patients from various clinical departments in the hospital. Toyokawa et al. (25) conducted a retrospective study based on 185 resectable thoracic ESCC patients and proved its independent prognostic value. However, the sample size of high-CONUT group and low-CONUT group was 17 and 168, respectively. Yoshida et al. (26, 27) suggested CONUT could be used to predict postoperative morbidity and long term survival of ESCC patients. The imbalanced population distribution in each category also emerged, with only 22 of total 373 cases in the moderate and severe risk category. GNRI was proposed by Yamada et al. (28), and the target population was 422 patients receiving continuous hemodialysis. This tool was popularized to 181 elderly hospitalized elderly people (age>65 years old) by Bouillanne et al. (15). It has been reported by Bo et al. (29) that GNRI was an independent prognostic factor for overall survival in elderly ESCC patients with radiotherapy. However, there is no study focusing on the prognostic value of GNRI in preoperative ESCC patients without age restriction. PNI, CONUT and GNRI had a common index of albumin level, while most of the preoperative ESCC patients included in the current study had a normal range of albumin level. 97.6% of the training set population had a normal range (35-55g/L), as shown in Supplementary Figure 6. The prognostic value of the albumin based scoring tool might be limited under this circumstance. Furthermore, in the univariate Cox analysis, the HRs and 95% Cis for Mckeown approach and Ivor-Lewis approach were 0.491(0.281-0.860) and 0.353(0.632-1.178) compared with Sweet approach, while there were no statistically significant results for these surgical approaches in the multivariate analysis. Many previous studies tried to find the optimal surgical approach for esophageal cancer, however, there was no definite conclusion for this question (30).
The current BLUT assessment tool adopted BMI, lymphocyte, uric acid and triglyceride as indexes, taking both general condition of the patients and laboratory tests into account. It has been reported that higher BMI was a protective factor for esophageal cancer (31, 32). Lymphocyte is one of the most commonly used nutritional markers (13, 14) and its metabolism and behavior could be impacted by nutritional status (33, 34). Besides, lymphopenia is an independent prognostic factor for ESCC patients (35). The association between uric acid and tumor was controversial. Kuhn et al. (36) reported there was a negative association between uric acid and cancer mortality. There were few studies on the relationship between preoperative triglyceride level and prognosis of ESCC, but it was proved as a protective factor in breast cancer patients (37). More well-designed prospective studies with large sample size were warranted in the future to further prove the prognostic role of uric acid and triglyceride in ESCC patients with surgery.
This single-center retrospective study also had some limitations. The BLUT tool was only applicable to ESCC patients who received cancer-directed surgery. The applicability was not yet clear for advanced stage patients who cannot undergo surgery, and for patients who received neoadjuvant therapy before surgery and the laboratory tests were severely impacted. In addition, more researches are required to further confirm whether the scoring system is suitable for continuous monitoring of nutritional status after surgery.
5. Conclusion
The BULT scoring tool could distinguish the heterogeneity of preoperative nutritional status for ESCC patients, especially for those with normal albumin level. Besides, the BLUT-based nomogram had good prognostic efficacy.
Supplementary Material
Supplementary methods, figures and table.
Acknowledgements
This work was funded by National Key R&D Program of China (2017YFC0113500), Traditional Chinese Medicine (Integrated Chinese and Western Medicine) Key Discipline of Zhejiang Province (2017-XK-A33), Major Science and Technology Projects of Zhejiang Province (2014C03032), General Research Program in Medicine and Health of Zhejiang Province (2019328069) and Traditional Chinese Medicine Research Fund Program of Zhejiang Province (2017ZA084).
Competing Interests
The authors have declared that no competing interest exists.
References
1. Chen W, Zheng R, Baade PD, Zhang S, Zeng H, Bray F. et al. Cancer statistics in China, 2015. CA: a cancer journal for clinicians. 2016;66(2):115-32
2. Allemani C, Matsuda T, Di Carlo V, Harewood R, Matz M, Niksic M. et al. Global surveillance of trends in cancer survival 2000-14 (CONCORD-3): analysis of individual records for 37 513 025 patients diagnosed with one of 18 cancers from 322 population-based registries in 71 countries. Lancet. 2018;391(10125):1023-75
3. Law S, Kwong DL, Kwok KF, Wong KH, Chu KM, Sham JS. et al. Improvement in treatment results and long-term survival of patients with esophageal cancer: impact of chemoradiation and change in treatment strategy. Annals of surgery. 2003;238(3):339-47 discussion 47-8
4. Allum WH, Blazeby JM, Griffin SM, Cunningham D, Jankowski JA, Wong R. et al. Guidelines for the management of oesophageal and gastric cancer. Gut. 2011;60(11):1449-72
5. Pennathur A, Gibson MK, Jobe BA, Luketich JD. Oesophageal carcinoma. Lancet. 2013;381(9864):400-12
6. Anandavadivelan P, Lagergren P. Cachexia in patients with oesophageal cancer. Nature reviews Clinical oncology. 2016;13(3):185-98
7. Markides GA, Alkhaffaf B, Vickers J. Nutritional access routes following oesophagectomy-a systematic review. European journal of clinical nutrition. 2011;65(5):565-73
8. Arends J, Bachmann P, Baracos V, Barthelemy N, Bertz H, Bozzetti F. et al. ESPEN guidelines on nutrition in cancer patients. Clinical nutrition (Edinburgh, Scotland). 2017;36(1):11-48
9. Kondrup J, Rasmussen HH, Hamberg O, Stanga Z. Nutritional risk screening (NRS 2002): a new method based on an analysis of controlled clinical trials. Clinical nutrition (Edinburgh, Scotland). 2003;22(3):321-36
10. Detsky AS, McLaughlin JR, Baker JP, Johnston N, Whittaker S, Mendelson RA. et al. What is subjective global assessment of nutritional status? JPEN Journal of parenteral and enteral nutrition. 1987;11(1):8-13
11. Guigoz Y, Vellas B, Garry PJ. Assessing the nutritional status of the elderly: The Mini Nutritional Assessment as part of the geriatric evaluation. Nutrition reviews. 1996;54(1 Pt 2):S59-65
12. Stratton RJ, Hackston A, Longmore D, Dixon R, Price S, Stroud M. et al. Malnutrition in hospital outpatients and inpatients: prevalence, concurrent validity and ease of use of the 'malnutrition universal screening tool' ('MUST') for adults. The British journal of nutrition. 2004;92(5):799-808
13. Onodera T, Goseki N, Kosaki G. Prognostic nutritional index in gastrointestinal surgery of malnourished cancer patients. Nihon Geka Gakkai zasshi. 1984;85(9):1001-5
14. Ignacio de Ulibarri J, Gonzalez-Madrono A, de Villar NG, Gonzalez P, Gonzalez B, Mancha A. et al. CONUT: a tool for controlling nutritional status. First validation in a hospital population. Nutricion hospitalaria. 2005;20(1):38-45
15. Bouillanne O, Morineau G, Dupont C, Coulombel I, Vincent JP, Nicolis I. et al. Geriatric Nutritional Risk Index: a new index for evaluating at-risk elderly medical patients. American Journal of Clinical Nutrition. 2005;82(4):777
16. Rice TW, Kelsen D, Blackstone EH, Ishwaran H, Patil DT, Bass AJ. et al. Esophagus and Esophagogastric Junction. AJCC Cancer Staging Manual. 8th ed. New York: Springer. 2017:185-202
17. Camp RL, Dolled-Filhart M, Rimm DL. X-tile: a new bio-informatics tool for biomarker assessment and outcome-based cut-point optimization. Clinical cancer research: an official journal of the American Association for Cancer Research. 2004;10(21):7252-9
18. Iasonos A, Schrag D, Raj GV, Panageas KS. How to build and interpret a nomogram for cancer prognosis. Journal of clinical oncology: official journal of the American Society of Clinical Oncology. 2008;26(8):1364-70
19. Harrell FE Jr, Lee KL, Mark DB. Multivariable prognostic models: issues in developing models, evaluating assumptions and adequacy, and measuring and reducing errors. Statistics in medicine. 1996;15(4):361-87
20. Balachandran VP, Gonen M, Smith JJ, DeMatteo RP. Nomograms in oncology: more than meets the eye. The Lancet Oncology. 2015;16(4):e173-80
21. Chaurasia A, Harel O. Using AIC in Multiple Linear Regression framework with Multiply Imputed Data. Health services & outcomes research methodology. 2012;12(2-3):219-33
22. Sun P, Zhang F, Chen C, An X, Li YH, Wang FH. et al. Comparison of the prognostic values of various nutritional parameters in patients with esophageal squamous cell carcinoma from Southern China. Journal of thoracic disease. 2013;5(4):484-91
23. Nozoe T, Kimura Y, Ishida M, Saeki H, Korenaga D, Sugimachi K. Correlation of pre-operative nutritional condition with post-operative complications in surgical treatment for oesophageal carcinoma. European journal of surgical oncology: the journal of the European Society of Surgical Oncology and the British Association of Surgical Oncology. 2002;28(4):396-400
24. Feng JF, Chen QX. Significance of the prognostic nutritional index in patients with esophageal squamous cell carcinoma. Therapeutics and clinical risk management. 2014;10:1-7
25. Toyokawa T, Kubo N, Tamura T, Sakurai K, Amano R, Tanaka H. et al. The pretreatment Controlling Nutritional Status (CONUT) score is an independent prognostic factor in patients with resectable thoracic esophageal squamous cell carcinoma: results from a retrospective study. BMC cancer. 2016;16:722
26. Yoshida N, Baba Y, Shigaki H, Harada K, Iwatsuki M, Kurashige J. et al. Preoperative Nutritional Assessment by Controlling Nutritional Status (CONUT) is Useful to estimate Postoperative Morbidity After Esophagectomy for Esophageal Cancer. World journal of surgery. 2016;40(8):1910-7
27. Yoshida N, Harada K, Baba Y, Kosumi K, Iwatsuki M, Kinoshita K. et al. Preoperative controlling nutritional status (CONUT) is useful to estimate the prognosis after esophagectomy for esophageal cancer. Langenbeck's archives of surgery. 2017;402(2):333-41
28. Yamada K, Furuya R, Takita T, Maruyama Y, Yamaguchi Y, Ohkawa S. et al. Simplified nutritional screening tools for patients on maintenance hemodialysis. The American journal of clinical nutrition. 2008;87(1):106-13
29. Bo Y, Wang K, Liu Y, You J, Cui H, Zhu Y. et al. The Geriatric Nutritional Risk Index Predicts Survival in Elderly Esophageal Squamous Cell Carcinoma Patients with Radiotherapy. PloS one. 2016;11(5):e0155903
30. Lagergren J, Smyth E, Cunningham D, Lagergren P. Oesophageal cancer. Lancet (London, England). 2017;390(10110):2383-96
31. Watanabe M, Ishimoto T, Baba Y, Nagai Y, Yoshida N, Yamanaka T. et al. Prognostic impact of body mass index in patients with squamous cell carcinoma of the esophagus. Annals of surgical oncology. 2013;20(12):3984-91
32. Brown JC, Meyerhardt JA. Obesity and Energy Balance in GI Cancer. Journal of clinical oncology: official journal of the American Society of Clinical Oncology. 2016;34(35):4217-24
33. Cohen S, Danzaki K, MacIver NJ. Nutritional effects on T-cell immunometabolism. European journal of immunology. 2017;47(2):225-35
34. Wolfson M, Strong CJ, Minturn D, Gray DK, Kopple JD. Nutritional status and lymphocyte function in maintenance hemodialysis patients. The American journal of clinical nutrition. 1984;39(4):547-55
35. Feng JF, Liu JS, Huang Y. Lymphopenia predicts poor prognosis in patients with esophageal squamous cell carcinoma. Medicine. 2014;93(27):e257
36. Kuhn T, Sookthai D, Graf ME, Schubel R, Freisling H, Johnson T. et al. Albumin, bilirubin, uric acid and cancer risk: results from a prospective population-based study. British journal of cancer. 2017;117(10):1572-9
37. Li X, Tang H, Wang J, Xie X, Liu P, Kong Y. et al. The effect of preoperative serum triglycerides and high-density lipoprotein-cholesterol levels on the prognosis of breast cancer. Breast (Edinburgh, Scotland). 2017;32:1-6
Author contact
![]() Corresponding author: Prof. Jian Hu, MD, PhD. Department of Thoracic Surgery, The first Affiliated Hospital, Zhejiang University School of Medicine, Hangzhou 310003, China. E-mail: dr_hujianedu.cn
Corresponding author: Prof. Jian Hu, MD, PhD. Department of Thoracic Surgery, The first Affiliated Hospital, Zhejiang University School of Medicine, Hangzhou 310003, China. E-mail: dr_hujianedu.cn
Citation styles
APA
Xu, J., Cao, J., Wang, Y., Yao, X., Wang, Y., He, Z., Lv, W., Hu, J. (2019). Novel preoperative nutritional assessment tool and prognostic model for ESCC patients. Journal of Cancer, 10(17), 3883-3892. https://doi.org/10.7150/jca.31286.
ACS
Xu, J.; Cao, J.; Wang, Y.; Yao, X.; Wang, Y.; He, Z.; Lv, W.; Hu, J. Novel preoperative nutritional assessment tool and prognostic model for ESCC patients. J. Cancer 2019, 10 (17), 3883-3892. DOI: 10.7150/jca.31286.
NLM
Xu J, Cao J, Wang Y, Yao X, Wang Y, He Z, Lv W, Hu J. Novel preoperative nutritional assessment tool and prognostic model for ESCC patients. J Cancer 2019; 10(17):3883-3892. doi:10.7150/jca.31286. https://www.jcancer.org/v10p3883.htm
CSE
Xu J, Cao J, Wang Y, Yao X, Wang Y, He Z, Lv W, Hu J. 2019. Novel preoperative nutritional assessment tool and prognostic model for ESCC patients. J Cancer. 10(17):3883-3892.
This is an open access article distributed under the terms of the Creative Commons Attribution (CC BY-NC) license (https://creativecommons.org/licenses/by-nc/4.0/). See http://ivyspring.com/terms for full terms and conditions.