Impact Factor ISSN: 1837-9664

 Global reach, higher impact
J Cancer 2019; 10(18):4286-4292. doi:10.7150/jca.31766 This issue Cite
Research Paper
High Expression Levels of ACTN1 and ACTN3 Indicate Unfavorable Prognosis in Acute Myeloid Leukemia
Xinrui Yang1, Yifan Pang2, Jilei Zhang1, Jinlong Shi3, Xinpei Zhang1, Gaoqi Zhang1, Siyuan Yang1, Jing Wang1, Kai Hu1, Jijun Wang1, Hongmei Jing1, Xiaoyan Ke1 ![]() , Lin Fu1
, Lin Fu1 ![]()
1. Department of Hematology and Lymphoma Research Center, Peking University, Third Hospital, Beijing, 100191, China.
2. Department of Medicine, William Beaumont Hospital, Royal Oak, MI 48073, USA.
3. Department of Biomedical Engineering, Chinese PLA General Hospital, Beijing, 100853, China.
Received 2018-11-24; Accepted 2019-5-14; Published 2019-7-10
Abstract
Background: Actinins are major cytoskeletal proteins that mediate sarcomere function, and they also have important non-muscle functions such as regulating cytokinesis, cell adhesion and migration. There are four isoforms of actinins in mammals (ACTN1-4). Recently, the relationship between actinins and cancer has been discovered in many types of malignancy, yet their prognostic significance in acute myeloid leukemia (AML) remains unclear.
Methods: We collected data of 155 de novo AML patients from The Cancer Genome Atlas (TCGA) database; 85 patients received chemotherapy only and 70 patients underwent allogeneic hematopoietic stem cell transplantation (allo-HSCT). We divided each treatment groups into sub-groups based on the median expression levels of ACTN1-4.
Results: Survival analysis showed that in the chemotherapy-only group, high ACTN1 and ACTN3 expression were associated with shorter event-free survival (EFS) and overall survival (OS) (p<0.01). Multivariate analysis suggested that high expression of ACTN1 and ACTN3 (p<0.05) were independent poor prognostic factors. In the allo-HSCT group, ACTN1-4 expression had no impact on survival.
Conclusions: Our study suggested that high expression levels of ACTN1 and ACTN3 adversely affected the survival of AML patients, but their harmful impact could be overcome by allo-HSCT.
Keywords: acute myeloid leukemia, ACTN1, ACTN3, prognosis
Background
Acute myeloid leukemia (AML) is a highly heterogeneous and aggressive malignancy of the undifferentiated or partially-differentiated bone marrow myeloid stem cells and progenitor cells1. In the past decade, next generation sequencing (NGS) technique has been widely used and became a powerful tool in AML research, greatly improving our understanding of the genetic basis of the disease. Many prognostic biomarkers were found with the help of NGS. For example, NPM1 mutation and biallelic CEBPA mutations are favorable factors, associating with longer event-free survival (EFS) and overall survival (OS). On the other hand, the present of FLT3-ITD and MLL-PTD, mutations in DNMT3A, RUNX1, TET2, and KRAS are predictors for poor outcomes in AML patients2-4. In addition, aberrant epigenetic modification, i.e., dysregulated expression levels of certain genes, may also influence the prognosis.
Actinins are a group of cytoskeletal molecules that belongs to the actin filament cross-linking proteins5. There are four actinin isoforms in mammals, namely ACTN1-4. ACTN1 and ACTN4 are universally expressed in most tissues and cell types. ACTN2 are mainly expressed in the myocardium, skeletal muscle and brain. ACTN3 mostly appear in the skeletal muscle. In muscle cells, actinins link the adjacent sarcomeres together through thin filaments, to coordinate muscle contraction. In non-muscle cells, actinins also exhibit a myriad of functions6. Actinins participate in cytokinesis by balancing the contraction of myosin II, forming a contractile ring with the latter to eventually divide the mother cell in two. Actinins can format and disassemble cell-matrix adhesion through the activation of phosphoinositide 3- kinase (PI3K), or build different cell-cell adhesions by working with integrins and intercellular adhesion molecules (ICAMs). They are also indispensable for endocytosis and exocytosis, which are essential biological processes for neurons and synapses. ACTN4 has recently been found to be a transcriptional regulator.
Since ACTN4's prognostic value in breast cancer was established, many works have been done to investigate the role of actinins in cancer prognostication and tumorigenesis7. Increased expression of ACTN4 has been associated with poor prognosis in ovarian cancer, colorectal cancer and acute lymphoblastic leukemia8-10. ACTN1 is crucial for glioma cell motility, and it also plays an important role in lung adenocarcinoma11, 12. There are also studies pointing out the interactions between ACTN2 and ACTN3 with the parafibromin tumor suppressor protein, one of the proteins that is involved in the hypermethylation and suppression of many oncogenes13.
However, the impacts of ACTN1-4 on the clinical and biological features of AML, as well as their prognostic value, remain unclear. Herein, we analyzed the relationship between the expression levels of ACTN1-4 and the outcomes of AML patients, hoping to guide future research in these areas.
Methods
Patients
We screened for de novo AML patients with ACTN1-4 expression data at diagnosis from The Cancer Genome Atlas (TCGA) database. A total of 155 patients had available data for analysis. Among them, 85 patients received only chemotherapy (chemotherapy-only group) and 70 patients underwent allogeneic hematopoietic stem cell transplantation (allo-HSCT, allo-HSCT group). Baseline demographic, laboratory and genetic data were downloaded from the TCGA public website. Gene expression profiling was performed on the Affymetrix U133 plus 2 platform. The Clinical endpoints were event-free survival (EFS) and overall survival (OS). EFS is the time from diagnosis to removal from the study due to death, relapse, failure to achieve complete remission (CR), or censored at the last follow-up. OS is the time from diagnosis to death from any cause or censored at the last follow-up. Written informed consent was obtained from all patients, and the database was approved by the Human Research Ethics Committee of Washington University.
Statistical analysis
The clinical and biological characteristics of patients were summarized by descriptive statistics. Numerical data was compared using the Mann-Whitney U test and categorical data was compared using the Chi-square test. Survival was depicted by the Kaplan-Meier method and compared by the log-rank test. Cox proportional hazard models were constructed for multivariate analysis in search of independent factors that influenced survival. Hazard ratios were presented with 95% confidence intervals. A two-sided P-value < 0.05 was considered statistically significant for all statistical analyses. All statistical analyses were performed by SPSS Version 20.0 software.
Results
Comparison of EFS and OS between different expression levels of ACTN1-4
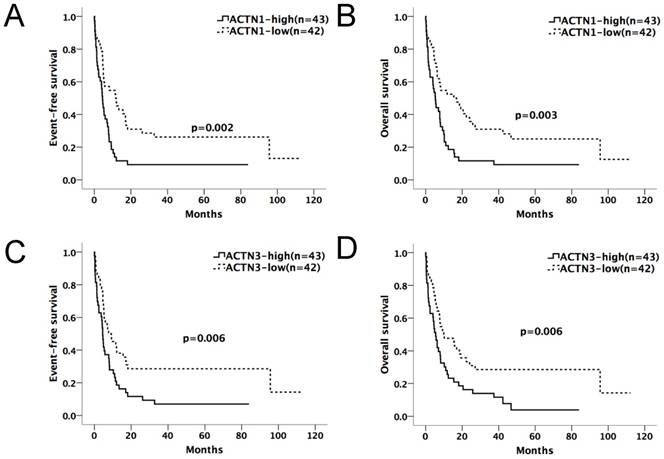
We divided the chemotherapy-only group (n=85) and allo-HSCT group (n=70) patients into high and low-expression subgroups by their median ACTN1-4 expression levels at diagnosis. ACTN1-4 expression levels ≥ median was defined as high expression of the respective gene; others were defined as low expression. Kaplan-Meier method and the log-rank test were used for the analysis of EFS and OS between the high and low expression groups of each ACTN (Table 1A and 1B). In the chemotherapy-only group, patients with high expression levels of ACTN1 and ACTN3 had significantly shorter EFS (p=0.002, 0.006, respectively) and OS (p=0.003, 0.006, respectively), as shown in Figure 1A-D. ACTN2 was also influential (p=0.025 for EFS, p=0.039 for OS). However, ACTN4 had no effect on EFS and OS. There was no statistical significance in survival between each ACTN high and low-expression subgroups in the allo-HSCT group.
Comparison of EFS and OS between high and low expression levels of ACTN1-4 (Chemotherapy-only, n=85)
| Variables | EFS | OS | |||
|---|---|---|---|---|---|
| χ2 | P-value | χ2 | P-value | ||
| ACTN1 (high vs. low) | 9.331 | 0.002 | 8.756 | 0.003 | |
| ACTN2 (high vs. low) | 5.051 | 0.025 | 4.251 | 0.039 | |
| ACTN3 (high vs. low) | 7.542 | 0.006 | 7.571 | 0.006 | |
| ACTN4 (high vs. low) | 0.149 | 0.700 | 0.049 | 0.825 | |
Abbreviations: EFS, event-free survival; OS, overall survival.
Comparison of EFS and OS between high and low expression levels of ACTN1-4 (HSCT, n=70)
| Variables | EFS | OS | |||
|---|---|---|---|---|---|
| χ2 | P-value | χ2 | P-value | ||
| ACTN1 (high vs. low) | 0.521 | 0.470 | 0.284 | 0.594 | |
| ACTN2 (high vs. low) | 0.042 | 0.838 | 0.164 | 0.685 | |
| ACTN3 (high vs. low) | 0.012 | 0.915 | 0.845 | 0.385 | |
| ACTN4 (high vs. low) | 0.106 | 0.744 | 0.096 | 0.757 | |
Abbreviations: EFS, event-free survival; OS, overall survival.
Expression levels of ACTN1/ACTN3 and patients' outcome in the chemotherapy-only group (n=85). Patients with high expression levels of ACTN1 and ACTN3 had significantly shorter EFS (p=0.002, 0.006, respectively, Figures 1A and 1C) and OS (p=0.003, 0.006, respectively, Figures 1B and 1D).
Association of clinical and biological characteristics with ACTN1 or ACTN3 expression levels
As demonstrated above, ACTN1 and ACTN3 had more significant impact on EFS and OS than ACTN2 and ACTN4, hence we analyzed the association between the clinical, biological features and the expression levels of ACTN1 (high vs. low) and ACTN3 (high vs. low) in the entire cohort (n=155, Table 2). High ACTN1 expression was associate with more patients over age 60 (p=0.037), lower WBC counts (p=0.010), fewer patients with FAB-M4 (p=0.032), more patients with complex karyotype (p=0.022) or poor-risk cytogenetics (p=0.001). Patient with higher ACTN1 also had higher frequencies in TP53 (p=0.005) and WT1 (p=0.018). High ACTN3 expression was associate with more patients > 60 years old, lower WBC counts, fewer patients with FAB-M4 subtype and more with FAB-M0 (p=0.002, p=0.002, p=0.018, and p=0.001, respectively). Similar to ACTN1, patients with high ACTN3 expression also tended to have complex karyotype and poor-risk cytogenetics (both p=0.000). Fewer FLT3 mutations (p=0.002), more frequent IDH1/2 mutations (p=0.049) and TP53 mutations (p=0.005) were found in high ACTN3 expression patients.
Clinical and molecular characteristics of patients with high or low ACTN1 and ACTN3 expression levels
| Characteristics | ACTN1 | ACTN3 | |||||
|---|---|---|---|---|---|---|---|
| High (n=78) | Low (n=77) | P | High (n=78) | Low (n=77) | P | ||
| Age/years, median (range) | 61 (18-81) | 57 (22-88) | 0.126* | 62.5 (21-88) | 56 (18-82) | 0.007* | |
| Age group/n (%) | 0.037§ | 0.002§ | |||||
| < 60 years | 32 (41.0) | 45 (58.4) | 29 (37.2) | 48 (62.3) | |||
| ≥ 60 years | 46 (59.0) | 32 (41.6) | 49 (62.8) | 29 (37.7) | |||
| Gender/n (%) | 0.335§ | 0.108§ | |||||
| Male | 46 (59.0) | 39 (50.6) | 48 (61.5) | 37 (48.1) | |||
| Female | 32 (41.0) | 38 (49.4) | 30 (38.5) | 40 (51.9) | |||
| Race/n (%) | 0.588§ | 0.275§ | |||||
| Caucasian | 59 (75.6) | 55 (71.4) | 54 (69.2) | 60 (77.9) | |||
| Others | 19 (24.4) | 22 (28.6) | 24 (30.8) | 17 (22.1) | |||
| WBC/×109/L, median (range) | 12.7 (0.6-171.9) | 33.2 (1.0-297.4) | 0.010* | 11.1 (0.6-297.4) | 33.2 (1.2-223.8) | 0.002* | |
| BM blast/%, median (range) | 70.0 (30-100) | 73 (33-99) | 0.427* | 69 (30-99) | 72 (32-100) | 0.893* | |
| PB blast/%, median (range) | 32 (0-97) | 48 (0-98) | 0.076* | 32 (0-98) | 47 (0-97) | 0.349* | |
| FAB subtypes/n (%) | |||||||
| M0 | 6 (7.7) | 10 (13.0) | 0.304§ | 14 (17.9) | 2 (2.6) | 0.001§ | |
| M1 | 24 (30.8) | 19 (24.7) | 0.473§ | 21 (26.9) | 22 (28.6) | 1.000§ | |
| M2 | 23 (29.5) | 16 (20.8) | 0.266§ | 18 (23.1) | 21 (27.3) | 0.711§ | |
| M4 | 11 (14.1) | 22 (28.6) | 0.032§ | 10 (12.8) | 23 (29.9) | 0.018§ | |
| M5 | 10 (12.8) | 7 (9.1) | 0.608§ | 9 (11.5) | 8 (10.4) | 0.803§ | |
| M6 | 1 (1.3) | 1 (1.3) | 1.000§ | 2 (2.6) | 0 (0.0) | 0.245§ | |
| M7 | 2 (2.6) | 1 (1.3) | 1.000§ | 2 (2.6) | 1 (1.3) | 0.620§ | |
| No date | 1 (1.3) | 1 (1.3) | 2 (2.6) | 0 (0.0) | |||
| Karyotype/n (%) | |||||||
| Normal | 36 (46.2) | 37 (48.1) | 0.871§ | 31 (39.7) | 42 (54.5) | 0.108§ | |
| Complex | 17 (21.8) | 6 (7.8) | 0.022§ | 20 (25.6) | 3 (3.9) | 0.000§ | |
| 8 Trisomy | 5 (6.4) | 2 (2.6) | 0.442§ | 6 (7.7) | 1 (1.3) | 0.062§ | |
| inv(16)/CBFβ-MYH11 | 1 (1.3) | 10 (13.0) | 0.004§ | 0 (0.0) | 11 (14.3) | 0.001§ | |
| 11q23/MLL | 5 (6.4) | 1 (1.3) | 0.210§ | 1 (1.3) | 5 (6.5) | 0.210§ | |
| -7/7q- | 5 (6.4) | 1 (1.3) | 0.210§ | 6 (7.7) | 0 (0.0) | 0.013§ | |
| t(9;22)/BCR-ABL1 | 2 (2.6) | 1 (1.3) | 1.000§ | 2 (2.6) | 1 (1.3) | 0.618§ | |
| t(8;21)/RUNX1-RUNX1T1 | 1 (1.3) | 6 (7.8) | 0.062§ | 1 (1.3) | 6 (7.8) | 0.117§ | |
| Others | 5 (6.4) | 11 (14.3) | 0.118§ | 8 (10.3) | 8 (10.4) | 1.000§ | |
| No date | 1 (1.3) | 2 (2.6) | 3 (3.8) | 0 (0.0) | |||
| Risk/n (%) | |||||||
| Good | 2 (2.6) | 16 (20.8) | 0.000§ | 1 (1.3) | 17 (22.1) | 0.000§ | |
| Intermediate | 45 (57.7) | 48 (62.3) | 0.509§ | 43 (55.1) | 50 (64.9) | 0.406§ | |
| Poor | 30 (38.5) | 11 (14.3) | 0.001§ | 31 (39.7) | 10 (13.0) | 0.000§ | |
| No date | 1 (1.3) | 2 (2.6) | 3 (3.8) | 0 (0.0) | |||
| MLL-PTD | 0.167§ | 0.495§ | |||||
| Presence | 7 (9.0) | 2 (2.6) | 6 (7.7) | 3 (3.9) | |||
| Absence | 71 (91.0) | 75 (97.4) | 72 (92.3) | 74 (96.1) | |||
| FLT3/n (%) | 0.474§ | 0.002§ | |||||
| FLT3-ITD | 17 (21.8) | 14 (18.2) | 10 (12.8) | 21 (27.3) | |||
| FLT3-TKD | 7 (9.0) | 5 (6.5) | 3 (3.8) | 9 (11.7) | |||
| Wild type | 54 (69.2) | 58 (75.3) | 65 (83.3) | 47 (61.0) | |||
| NPM1/n (%) | 0.599§ | 0.599§ | |||||
| Mutation | 21 (26.9) | 24 (31.2) | 21 (26.9) | 24 (31.2) | |||
| Wild type | 57 (73.1) | 53 (68.8) | 57 (73.1) | 53 (68.8) | |||
| DNMT3A/n (%) | 1.000§ | 0.583§ | |||||
| Mutation | 20 (25.6) | 20 (26.0) | 22 (28.2) | 18 (23.4) | |||
| Wild type | 58 (74.4) | 57 (74.0) | 56 (71.8) | 59 (76.6) | |||
| IDH1/IDH2/n (%) | 0.846§ | 0.049§ | |||||
| Mutation | 16 (20.5) | 17 (22.1) | 22 (28.2) | 11 (14.3) | |||
| Wild type | 62 (79.5) | 60 (77.9) | 56 (71.8) | 66 (85.7) | |||
| RUNX1/n (%) | 0.121§ | 0.429§ | |||||
| Mutation | 5 (6.4) | 11 (14.3) | 10 (12.8) | 6 (7.8) | |||
| Wild type | 73 (93.6) | 66 (85.7) | 68 (87.2) | 71 (92.2) | |||
| TET2/n (%) | 0.588§ | 0.588§ | |||||
| Mutation | 9 (11.5) | 6 (7.8) | 9 (11.5) | 6 (7.8) | |||
| Wild type | 69 (88.5) | 71 (92.2) | 69 (88.5) | 71 (92.2) | |||
| TP53/n (%) | 0.005§ | 0.001§ | |||||
| Mutation | 13 (16.7) | 2 (2.6) | 14 (17.9) | 1 (1.3) | |||
| Wild type | 65 (83.3) | 75 (97.4) | 64 (82.1) | 76 (98.7) | |||
| NRAS/KRAS/n (%) | 0.811§ | 1.000§ | |||||
| Mutation | 9 (11.5) | 10 (13.0) | 10 (12.8) | 9 (11.7) | |||
| Wild type | 69 (88.5) | 67 (87.0) | 68 (87.2) | 68 (88.3) | |||
| CEBPA/n (%) | 0.765§ | 0.368§ | |||||
| Single Mutation | 5 (6.4) | 3 (3.9) | 4 (5.1) | 4 (5.2) | |||
| Double Mutation | 0 (0.0) | 3 (3.9) | 0 (0.0) | 3 (3.9) | |||
| Wild type | 73 (93.6) | 71 (92.2) | 74 (94.9) | 70 (90.9) | |||
| WT1/n (%) | 0.018§ | 0.534§ | |||||
| Mutation | 9 (11.5) | 1 (1.3) | 4 (5.1) | 6 (7.8) | |||
| Wild type | 69 (88.5) | 76 (98.7) | 74 (94.9) | 71 (92.2) | |||
| PTPN11/n (%) | 0.719§ | 0.495§ | |||||
| Mutation | 5 (6.4) | 3 (3.9) | 3 (3.8) | 5 (6.5) | |||
| Wild type | 73 (93.6) | 74 (96.1) | 75 (96.2) | 72 (93.5) | |||
| Relapse/n (%) | 0.265§ | 0.426§ | |||||
| Yes | 36 (46.2) | 42 (54.5) | 37 (47.4) | 41 (53.2) | |||
| No | 42 (53.8) | 34 (44.2) | 41 (52.6) | 35 (45.5) | |||
| No date | 0 (0.0) | 1 (1.3) | 0 (0.0) | 1 (1.3) | |||
Abbreviations: WBC: white blood cell; BM: bone marrow; PB: peripheral blood; FAB: French American British.
'*' denotes Mann-Whitney U test; '§' denotes chi-square test.
Prognostic impact of ACTN1 and ACTN3 expression in AML patients
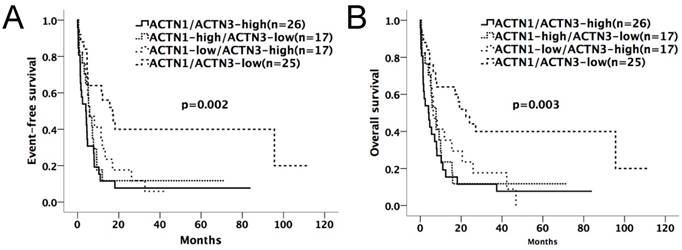
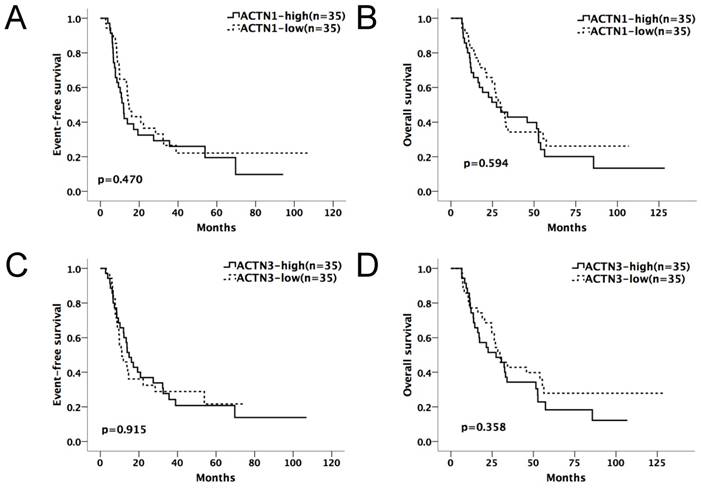
Kaplan-Meier survival curves suggested that in the chemotherapy-only group, AML patients with high expressions of either ACTN1 or ACTN3 had shorter EFS and OS compared with patients with low expressions (p=0.002 for EFS, p=0.003 for OS, Figure 2A and 2B). However, no significant difference was found when doing similar comparison in the allo-HSCT group (p>0.05, Figure 3A and 3B).
Kaplan-Meier survival curves of different expression levels of ACTN1/ACTN3 in the chemotherapy-only group. Patients with high expressions of either ACTN1 or ACTN3 had shorter EFS and OS compared with those with low expressions of both (p=0.002 for EFS, p=0.003 for OS, Figure 2A and 2B).
Expression levels of ACTN1/ACTN3 and patients' outcome in the allo-HSCT group. No significant difference was found in EFS or OS comparing high and low expression groups of ACTN1 and ACTN3. (p>0.05, Figure 3A and 3B).
Multivariate analysis was implemented to evaluate the prognostic value of clinical and biological variables in the chemotherapy-only group in order to avoid the influence of allo-HSCT. The expression levels of ACTN1, ACTN2 and ACTN3 (high vs. low), age (≥60 vs. <60 years), WBC count (≥15 vs. <15×109/L), FLT3-ITD (positive vs. negative) and other common AML mutations with relatively high frequency in this study (NPM1, DNMT3A, IDH1/2, RUNX1, TET2 and NRAS/KRAS; mutated vs. wild type), were selected to construct the Cox regression model (Table 3). High expression levels of ACTN1 (p=0.007 for EFS, p=0.021 for OS) and ACTN3 (p=0.048 for EFS, p=0.018 for OS), older age (p=0.000 for EFS, p=0.002 for OS) independently contributed to poor prognosis.
Multivariate analysis for EFS and OS in the chemotherapy-only group
| Variables | EFS | OS | |||
|---|---|---|---|---|---|
| HR (95%CI) | P-value | HR (95%CI) | P-value | ||
| ACTN1 (high vs. low) | 2.310 (1.257-4.245) | 0.007 | 2.020 (1.110-3.673) | 0.021 | |
| ACTN2 (high vs. low) | 1.679 (0.976-2.890) | 0.061 | 1.519 (0.887-2.601) | 0.128 | |
| ACTN3 (high vs. low) | 1.800 (1.005-3.225) | 0.048 | 2.067 (1.134-3.768) | 0.018 | |
| Age (≥60 vs. <60 years) | 3.329 (1.732-6.400) | 0.000 | 2.819 (1.486-5.348) | 0.002 | |
| WBC (≥15 vs. <15×109/L) | 1.701 (0.951-3.040) | 0.073 | 1.590 (0.903-2.800) | 0.108 | |
| FLT3-ITD (positive vs. negative) | 1.016 (0.505-2.043) | 0.964 | 1.000 (0.485-2.061) | 1.000 | |
| NPM1 (mutated vs. wild) | 1.293 (0.630-2.651) | 0.484 | 0.948 (0.470-1.912) | 0.882 | |
| DNMT3A (mutated vs. wild) | 1.507 (0.795-2.857) | 0.209 | 1.786 (0.946-3.372) | 0.073 | |
| IDH1/2 (mutated vs. wild) | 0.507 (0.244-1.051) | 0.068 | 0.526 (0.257-1.076) | 0.079 | |
| RUNX1 (mutated vs. wild) | 2.353 (0.903-6.134) | 0.080 | 2.446 (0.942-6.347) | 0.066 | |
| TET2 (mutated vs. wild) | 0.542 (0.240-1.225) | 0.141 | 0.363 (0.155-0.846) | 0.019 | |
| NRAS/KRAS (mutated vs. wild) | 0.663 (0.301-1.461) | 0.308 | 0.812 (0.373-1.768) | 0.600 | |
Abbreviations: EFS, Event-free survival; OS, Overall survival; WBC, white blood cell; HR, hazard ratio; CI, confidence interval.
Discussion
Since Honda, et. al., 7 found that ACTN4 was associated with poor prognosis in breast cancer patients, much laboratory and clinical work has been done to illustrate the relationship between actinins and solidary tumors, but little attention had been paid to that between actinins and hematological disorders. Our study was among the first to glimpse into the prognostic significance of ACTN1-4 in AML patients. High expression levels of ACTN1 and ACTN3 acted as adverse factors for outcome in the chemotherapy-only group. However, in the allo-HSCT group, we did not observe any effect of ACTN1 and ACTN3 on the patients' survival.
ACTN4 has been wildly studied for its function in tumors. Like ACTN4, ACTN1 is expressed in most cell types. Given the many similarities in amino acid sequence and actin-binding properties, it would be possible for different ACTNs to have overlapping functions.6 ACTN1 participates in the assembly of F-actin at invadopodia, modulates cell adhesion through regulation of focal adhesion kinase-Src interaction14, 15. Increased level of ACTN1 in the cell promotes migration and loss of polarity by reorganizing the actin cytoskeleton and E-cadherin-based adhesions16. ACTN3 is the “speed gene” that determines the performances of athletes, with 18% of the human population totally deficient in this gene17, but its functions in diseases have rarely been studied. The knocking-off of ACTN3 in mouse muscle can increase the activity of aerobic metabolism and influence sarcomere composition in a dose-dependent fashion18. The oncogenic effect of ACTN1 and the metabolic effect of ACTN3 could help explain the findings in our study, though the clear pathophysiological mechanism requires careful laboratory experiments to further delineate.
As the role of actinins in cancer progression became clear in recent years, targeted treatment against actinins has been under development. Craig, et. al., used small interfering RNAs to reduce the expression of ACTN1 in murine tumor cells. ACTN1 silencing disrupted cancer cell adhesion to murine surgical wounds and thereby prolonged the tumor-free survival19. Previous studies also reported that transforming growth factor beta (TGF-β) could induce ACTN1 mRNA expression, so targeting TGF-β would be an alternative way to suppress ACTN20, 21. Our study pointed out that ACTN1 and ACTN3 might also be potential targets in AML treatment.
High ACTN1/3 expression was associated with some of the traditional AML risk factors, such as older age, complex karyotype, and poor-risk cytogenetics. Despite the associations, ACTN1/3 expression independently contributed to the poor prognosis in AML patients receiving only chemotherapy. This highlights the fact that although AML prognostication is complex and many factors are intertwined, a single gene could still exert a strong impact.
Allo-HSCT is a powerful treatment of AML to and it can overcome the harmful effect of some high-risk molecular biomarkers22. In our study, the adverse effect of high expression levels of ACTN1 and ACTN3 was not observed in the allo-HSCT group, suggesting that allo-HSCT might surmount the adverse effect of ACTN1 and ACTN3 overexpression in AML patients.
Conclusion
In conclusion, our study found that high expression levels of ACTN1 and ACTN3 at diagnosis indicated unfavorable outcome in AML patients. The pathophysiological mechanism behind this remained to be elucidated. In the future, ACTN1 and ACTN3 could be considered used as biomarkers and indicators for allo-HSCT in AML, if their significant prognostic value were to be confirmed in larger prospective cohorts.
Abbreviations
ACTN: actinin; ALL: acute lymphoblastic leukemia; AML: acute myeloid leukemia; CR: complete remission; EFS: event-free survival; HSCT: hematopoietic stem cell transplantation; ICAMs: intercellular adhesion molecules; NGS: next generation sequencing; OS: overall survival; PI3K: phosphoinositide 3- kinase.
Acknowledgements
This work was supported by grants from the National Natural Science Foundation of China (81500118, 61501519), the China Postdoctoral Science Foundation funded project (project No.2016M600443) and PLAGH project of Medical Big Data (Project No.2016MBD-025).
Authorship
Xiaoyan Ke and Lin Fu designed and oversaw the study; Xinrui Yang wrote the manuscript; Xinrui Yang, Yifan Pang, Jilei Zhang, Jinlong Shi, Xinpei Zhang, Gaoqi Zhang, Siyuan Yang, Jing Wang, Kai Hu, Jijun Wang and Hongmei Jing performed statistical analyses. All authors contributed to data analysis, drafting and revising the paper and agree to be accountable for all aspects of the work.
Ethics Committee Approval and Patient Consent
Written informed consent was obtained from all patients for the TCGA database, which was approved by the Human Research Ethics Committee of Washington University.
Competing Interests
The authors have declared that no competing interest exists.
References
1. Dohner H, Weisdorf DJ, Bloomfield CD. Acute Myeloid Leukemia. N Engl J Med. 2015;373(12):1136-1152
2. Thol F, Damm F, Ludeking A. et al. Incidence and prognostic influence of DNMT3A mutations in acute myeloid leukemia. J Clin Oncol. 2011;29(21):2889-2896
3. Mendler JH, Maharry K, Radmacher MD. et al. RUNX1 mutations are associated with poor outcome in younger and older patients with cytogenetically normal acute myeloid leukemia and with distinct gene and MicroRNA expression signatures. J Clin Oncol. 2012;30(25):3109-3118
4. Yohe S. Molecular Genetic Markers in Acute Myeloid Leukemia. J Clin Med. 2015;4(3):460-478
5. Murphy AC, Young PW. The actinin family of actin cross-linking proteins - a genetic perspective. Cell Biosci. 2015;5:49
6. Foley KS, Young PW. The non-muscle functions of actinins: an update. Biochem J. 2014;459(1):1-13
7. Honda K, Yamada T, Endo R. et al. Actinin-4, a novel actin-bundling protein associated with cell motility and cancer invasion. J Cell Biol. 1998;140(6):1383-1393
8. Yamamoto S, Tsuda H, Honda K. et al. Actinin-4 expression in ovarian cancer: a novel prognostic indicator independent of clinical stage and histological type. Mod Pathol. 2007;20(12):1278-1285
9. Honda K, Yamada T, Hayashida Y. et al. Actinin-4 increases cell motility and promotes lymph node metastasis of colorectal cancer. Gastroenterology. 2005;128(1):51-62
10. Burmeister T, Meyer C, Schwartz S. et al. The MLL recombinome of adult CD10-negative B-cell precursor acute lymphoblastic leukemia: results from the GMALL study group. Blood. 2009;113(17):4011-4015
11. Sen S, Dong M, Kumar S. Isoform-specific contributions of alpha-actinin to glioma cell mechanobiology. Plos One. 2009;4(12):e8427
12. Hirooka S, Akashi T, Ando N. et al. Localization of the invadopodia-related proteins actinin-1 and cortactin to matrix-contact-side cytoplasm of cancer cells in surgically resected lung adenocarcinomas. Pathobiology. 2011;78(1):10-23
13. Agarwal SK, Simonds WF, Marx SJ. The parafibromin tumor suppressor protein interacts with actin-binding proteins actinin-2 and actinin-3. Mol Cancer. 2008;7:65
14. Yamaguchi H, Ito Y, Miura N. et al. Actinin-1 and actinin-4 play essential but distinct roles in invadopodia formation by carcinoma cells. Eur J Cell Biol. 2017;96(7):685-694
15. Craig DH, Haimovich B, Basson MD. Alpha-actinin-1 phosphorylation modulates pressure-induced colon cancer cell adhesion through regulation of focal adhesion kinase-Src interaction. Am J Physiol Cell Physiol. 2007;293(6):C1862-C1874
16. Kovac B, Makela TP, Vallenius T. Increased alpha-actinin-1 destabilizes E-cadherin-based adhesions and associates with poor prognosis in basal-like breast cancer. Plos One. 2018;13(5):e196986
17. MacArthur DG, North KN. A gene for speed? The evolution and function of alpha-actinin-3. Bioessays. 2004;26(7):786-795
18. MacArthur DG, Seto JT, Chan S. et al. An Actn3 knockout mouse provides mechanistic insights into the association between alpha-actinin-3 deficiency and human athletic performance. Hum Mol Genet. 2008;17(8):1076-1086
19. Craig DH, Downey C, Basson MD. SiRNA-mediated reduction of alpha-actinin-1 inhibits pressure-induced murine tumor cell wound implantation and enhances tumor-free survival. Neoplasia. 2008;10(3):217-222
20. Bakin AV, Safina A, Rinehart C, Daroqui C, Darbary H, Helfman DM. A critical role of tropomyosins in TGF-beta regulation of the actin cytoskeleton and cell motility in epithelial cells. Mol Biol Cell. 2004;15(10):4682-4694
21. Xie L, Law BK, Aakre ME. et al. Transforming growth factor beta-regulated gene expression in a mouse mammary gland epithelial cell line. Breast Cancer Res. 2003;5(6):R187-R198
22. Gupta V, Tallman MS, Weisdorf DJ. Allogeneic hematopoietic cell transplantation for adults with acute myeloid leukemia: myths, controversies, and unknowns. Blood. 2011;117(8):2307-2318
Author contact
![]() Corresponding authors: Lin Fu; Department of Hematology and Lymphoma Research Center, Peking University, Third Hospital, 49 Huayuan North Road, Beijing 100191, China. Tel: +86-10- 82267651; Fax: +86-10-82267651; Email: fulin022com; or Xiaoyan Ke; Department of Hematology and Lymphoma Research Center, Peking University, Third Hospital, 49 Huayuan North Road, Beijing 100191, China. Tel: +86-10- 82266780; Fax: +86-10-82266780; Email: xykbysycom.
Corresponding authors: Lin Fu; Department of Hematology and Lymphoma Research Center, Peking University, Third Hospital, 49 Huayuan North Road, Beijing 100191, China. Tel: +86-10- 82267651; Fax: +86-10-82267651; Email: fulin022com; or Xiaoyan Ke; Department of Hematology and Lymphoma Research Center, Peking University, Third Hospital, 49 Huayuan North Road, Beijing 100191, China. Tel: +86-10- 82266780; Fax: +86-10-82266780; Email: xykbysycom.