Journal of Cancer
ISSN: 1837-9664
3.2
Impact Factor
ISSN: 1837-9664

 Global reach, higher impact
J Cancer 2023; 14(12):2361-2372. doi:10.7150/jca.84307 This issue Cite
Research Paper
Low RCAN1.2 mRNA Expression Is Associated with Poor Prognosis of Patients with Esophageal Squamous Cell Carcinoma
Haijun Yang1,2#, Jiahuan Zhou3#, Keyao He4#, Junkuo Li1,2, Fang Zhao1,2, Ningtao Dai1,2, Shouxin Wu3, Wushuang Li3, Jiangman Zhao3 ![]() , Yaowen Zhang1,2
, Yaowen Zhang1,2 ![]() , Fuyou Zhou1,2
, Fuyou Zhou1,2 ![]()
1. Anyang Tumor Hospital, The Affiliated Anyang Tumor Hospital of Henan University of Science and Technology, Anyang 455000, Henan, China.
2. Henan Key Medical Laboratory of Precise Prevention and Treatment of Esophageal Cancer, Anyang 455000, Henan, China.
3. Shanghai Zhangjiang Institue of Medical Innovation, Shanghai Biotecan Pharmaceuticals Co., Ltd., Shanghai 201204, China.
4. The Third Affiliated Hospital of Xinxiang Medical University, Xinxiang 453003, Henan Province, China.
#Haijun Yang, Jiahuan Zhou and Keyao He contributed equally to this work.
Received 2023-3-14; Accepted 2023-7-2; Published 2023-7-31
Citation:
Yang H, Zhou J, He K, Li J, Zhao F, Dai N, Wu S, Li W, Zhao J, Zhang Y, Zhou F. Low RCAN1.2 mRNA Expression Is Associated with Poor Prognosis of Patients with Esophageal Squamous Cell Carcinoma. J Cancer 2023; 14(12):2361-2372. doi:10.7150/jca.84307. https://www.jcancer.org/v14p2361.htm
Other stylesAbstract

Background: This study aims to explore the role of RCAN1 in esophageal squamous cell carcinoma (ESCC) cells, determine the mRNA level of three RCAN1 isoforms in ESCC tissue, and evaluate the prognostic value of three RCAN1 isoforms.
Methods: Colony-forming assay, Wound-healing assay and Transwell assay were used to evaluate the effect of RCAN1 on cell proliferation, migration and invasion. The mRNA expression of three RCAN1 isoforms was detected in paired tumor and normal tissues from 100 ESCC patients by real-time PCR. Kaplan-Meier survival curves and Cox proportional hazards model were used to evaluate the prognostic value of three RCAN1 isoforms. A nomogram was used to predict the probability of 2-year and 5-year overall survival (OS).
Results: In vitro, knockdown of RCAN1 could promote ESCC cell proliferation, migration and invasion abilities. Compared to the paired normal tissues, RCAN1 isoform 1 (RCAN1.1, P=0.0027) and RCAN1 isoform 2 (RCAN1.2, P=0.0006) were significantly decreased in tumor tissues. The low expression of RCAN1.2 mRNA was associated with advanced stage (P=0.0176) and lymph node metastasis (LNM, P=0.0219). ESCC patients with low RCAN1.2 mRNA levels had shorter survival time compared to those with high RCAN1.2 levels (P=0.007). Multivariate COX analysis indicated that RCAN1.2 mRNA level was an independent prognostic indicator of OS of patients with ESCC (hazard ratio=0.5266, P=0.03554). The concordance index of nomogram to predict OS was 0.693 based on LNM, RCAN1.2, tumor stage and patients' age.
Conclusion: These findings show that RCAN1 gene play a role in preventing proliferation, migration, and invasive activity of ESCC cells. RCAN1.2 mRNA level is a novel prognostic marker in ESCC, targeting RCAN1.2 may provide a potential therapeutic approach in ESCC.
Keywords: RCAN1, esophageal cancer, tumor suppressor, prognosis, biomarker
Introduction
Esophageal cancer (EC) is one of the leading causes of cancer-related mortality worldwide. Together with other types of gastrointestinal cancers, esophageal cancer causes almost a third of disability-adjusted life-years (DALYs) due to cancer [1]. Although great efforts have been made to improve the treatment strategy, the prognosis of EC patients remains poor, with a low 5-year survival rate [2]. It is considered that lack of valid biomarker for early diagnosis and efficacious drugs are the main causes [2, 3]. Therefore, it is vital to further explore the pathogenic process that leads to EC, identify novel molecular markers or causative genes, so as to improve the prognosis of EC and search for new drug therapeutic target.
Regulator of calcineurin 1 (RCAN1, also known as Down's syndrome critical region 1 [DSCR1]) is one of the genes located on chromosome 21 which was considered as a tumor suppressor in various cancers [4]. There are three main transcripts of RCAN1 (RCAN1.1, RCAN1.2, and RCAN1.4) detected in human tissues [5]. Previous studies showed that upregulation of RCAN1 could inhibit VEGF-mediated proliferation of endothelial cells and suppress tumor angiogenesis [4, 6]. In addition, overexpression of RCAN1 could reduce cell viability in lymphoma Raji cells and restrain the lymphoma growth in mice [7]. In some gastrointestinal cancers, for instance, it was reported that RCAN1 had suppressive effect on transformed properties of early stage colorectal cancer cells [8]. Meanwhile, overexpression of RCAN1.4 in HCC cells could prevent tumor growth, migration, and angiogenesis and metastases [9]. While the role of RCAN1 in esophageal cancer is still unknown.
Given that over half of all EC-related deaths occur in China where approximately 90% of esophageal cancer cases are esophageal squamous cell carcinoma (ESCC), particularly in high-risk populations[10]. In the present study, we aimed to explore the function of RCAN1 in the proliferation, migration and invasion of ESCC cells, and to determine the mRNA level of three RCAN1 isoforms in ESCC tissue, compared with adjacent normal tissues. The results of this study may give a novel insight in the role of RCAN1 in ESCC pathogenesis and suggested that RCAN1.2 mRNA level is a potential prognostic biomarker.
Materials and methods
Patients and samples
In this study, a total of 100 ESCC patients with complete clinicopathological data were enrolled in the Anyang Tumor Hospital from 2013 to 2018. The inclusion criteria for participants in this study were (1) Newly diagnosed ESCC confirmed by postoperative histology, (2) receiving surgery resection and with negative resection margin. Exclusion criteria were (1) use of preoperative neoadjuvant therapy, (2) with other malignancies, (3) loss of follow-up. 100 pairs of primary tumor tissues and adjacent normal tissues were collected for real-time PCR. The clinical characteristics of 100 ESCC patients were showed in Table 1.
Table 1
Clinical characteristics of 100 ESCC patients according to RCAN1.2 mRNA expression level
| RCAN1.2 Low (n=50) | RCAN1.2 High (n=50) | P value | |
|---|---|---|---|
| Age/years | 0.509 | ||
| >60 | 34 | 37 | |
| ≤60 | 16 | 13 | |
| Gender | 0.023* | ||
| Female | 13 | 24 | |
| Male | 37 | 26 | |
| Smoke | 0.069 | ||
| Yes | 26 | 17 | |
| No | 24 | 33 | |
| Drink | 0.105 | ||
| Yes | 25 | 17 | |
| No | 25 | 33 | |
| Family history of cancer | 1.000 | ||
| Yes | 15 | 15 | |
| No | 35 | 35 | |
| cardiovascular and cerebrovascular diseases | 0.548 | ||
| Yes | 28 | 25 | |
| No | 22 | 25 | |
| Stage | 0.032* | ||
| I-II | 29 | 39 | |
| III-IV | 21 | 11 | |
| LNM | 0.008** | ||
| No | 24 | 37 | |
| Yes | 26 | 13 | |
| Tumor diameter | 0.052 | ||
| ≥5cm | 20 | 11 | |
| <5cm | 30 | 39 | |
| Differentiation | 0.656 | ||
| Well | 15 | 13 | |
| Poor-Moderate | 35 | 37 |
Footnote: *P<0.05, **P<0.001
This research was approved by the Ethical Review Committee of Anyang Tumor Hospital and informed consent was obtained from all participants. All procedures performed in this study were in accordance with the ethical standards of the institutional and/or national research committee and with the Helsinki declaration.
Cell culture and transfection
Esophageal squamous cell carcinoma cell line KYSE30 was obtained from the Shanghai Bogu Biological Cell Institute (Shanghai, China). ESCC cells were cultured in RPMI-1640 medium containing 10% fetal bovine serum (FBS; all from Gibco, Thermo Fisher Scientific, USA) at 37℃ in a humidified atmosphere with 5% CO2. Lentivirus-knockdown RCAN1 particles (Lenti-KD), knockdown control particles (Lenti-ctrl) were purchased from FulenGen Co., Ltd. (Guangzhou, China). For infections, KYSE30 cells were incubated with lentiviral particles and Polybrene (1 μg/ml) in RPMI-1640 medium. After 12 h, the infection medium was replaced by fresh culture medium. After 48 hours of transfection, cells were used for subsequent experiments.
Western blotting
Protein homogenates were separated by 10% SDS-PAGE electrophoresis and were then transferred to a PVDF membrane (Millipore, USA). PVDF membrane was blocked with 5% skim milk for 1 h at room temperature (RT). Primary antibody anti-RCAN1 (1:1000, Abcam, USA) and rabbit anti-human GAPDH polyclonal antibody (1:2000, Kangwei, Shanghai, China) were added and incubated at 4°C overnight. The membrane was washed 3 times for 5 min each time with TPBS, and then the secondary antibodies (goat-anti-rabbit, 1:2000, Kangwei, Shanghai, China) were incubated at RT for 1 h. The membrane was washed 3 times with TPBS. The signal was visualized by chemiluminescence and the relative expression levels were analyzed by Bio-Rad molecular imaging system (Hercules, CA).
Colony-forming assay
A total of 500 cells per well were seeded in 6-well plates and were cultivated in complete media for 7-14 days. Subsequently, media was removed, cells were washed twice in PBS. Cells were then fixed by 4% paraformaldehyde (Sigma-Aldrich, Germany) for 1h and stained with 0.5% crystal violet (Sigma-Aldrich, Germany) for 30 min at RT. Plates were thoroughly washed with water and air-dried at RT.
Wound-healing assay
For the wound healing assay, KYSE30 cells were inoculated in 6-well plates and form a confluence cell monolayer for about 12h. Each group had three wells. A pipette tip (200 μl) was used to scratch the culture well, then the wells were washed three times with PBS to remove the floating cells. Cells were cultured in serum-free medium in a humidified incubator (37˚C, 5% CO2), and were observed and captured every 3 hours, until 24 h post-scratching. The percentage of wound closure was calculated by the formula: wound closure = (original gap distance - gap distance at the indicated time)/original gap distance × 100%.
Transwell assay
The invasion assay was evaluated using the 24-well Transwell chambers (Corning, Germany). The chambers were precoated with Matrigel (Corning, Germany). The transfected cells (cell density of 1×10⁶ cells) with serum-free medium were seeded into the upper chamber of each well. The lower compartment was filled up with culture medium containing 15% FBS as the chemoattractant. After incubation at 37℃ for 24 hours, the cells attached to the lower chambers were stained with 0.1% crystal violet after fixation and counted under a light microscope (Nikon, Japan).
RNA extraction and quantitative real-time PCR
Total mRNAs were extracted from tissues by TRIzol reagent (Invitrogen, USA) following the manufacturer's manual. Reverse transcription was carried out using PrimeScript RT reagent kit (TaKaRa, Japan). Quantitative real-time polymerase chain reaction (qRT-PCR) was then performed by using a 7500 Real-Time PCR System (Applied Biosystems, USA) with the SYBR green I Master Mix Kit (Invitrogen, USA). GAPDH was used as an internal control gene, and the relative expression data were normalized to GAPDH. All expression data were quantified using the 2-ΔΔCt method. The 2-ΔΔCt value lower than median value of 100 tumor samples was defined as Low expression level, higher than median value as high expression level. The sequences of primers of RCAN1.1, RCAN1.2 and RCAN1.4 for qPCR were listed in Table S1.
Follow up
The patients were followed up from first time treatment to August 2022. After hospital discharge, the patients were followed-up regularly every 3 months during the first 2 years, every 6 months from year 3 to 5, and once a year afterwards. Overall survival (OS) was defined as the time from first time treatment to death or final follow-up. During the follow-up period, 52 ESCC patients reached the end point of follow-up, their median OS was 24.5 months (range 2-92 months). Forty-eight patients were currently alive.
Expression level analysis of three RCAN1 transcripts in external cohorts
Two datasets (GSE164158 and GSE149609) were downloaded from Gene Expression Omnibus (GEO) database to validate the mRNA expression level of three RCAN1 transcripts in external cohorts. After quality control and reads mapping[11], Fragments Per Kilobase of transcript per Million fragments mapped (FPKM) and reads count of all transcripts of RCAN1 were calculated to quantify its expression level using StringTie software[12]. DESeq2 package[13] in R was used to identify RCAN1 transcripts' expressional difference between tumor and matched normal tissues.
Statistical analysis
Data was analyzed using IBM SPSS Statistics 22 software (IBM, USA) and GraphPad Prism 6.0 software (GraphPad Software, CA) and R project. The difference in distribution of categorical variables between groups were analyzed by Chi-square or the Fisher's exact test. For continuous variables, the significant differences between groups were assessed using Student t test for normal distribution data, the Mann-Whitney U test for non-normal distribution data. Kaplan-Meier analysis was used to perform survival analysis with log-rank test to compare the differences between subgroups. Then, propensity score matching (PSM) method by MatchIt package in R was used to remove confounding bias of clinical factors associated with prognosis. A nomogram was established using prognostic factors determined by Cox proportional hazards model to predict patients' 2 and 5-year survival probability. Internal validation by the bootstrap method was performed, the concordance index (C-index) and calibration curve were calculated to assess the predictive accuracy and discriminatory capacity. The nomogram was generated using R 4.0.2 and third-party package rms and its auxiliary program package. The P value of less than 0.05 was considered statistically significant.
Figure 1
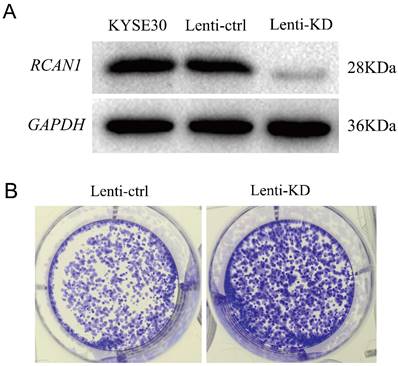
Effect of RCAN1 downregulation on ESCC Cell Proliferation, Migration, and Invasion. (A) The effect of RCAN1-targeting siRNAs in KYSE30 cells was confirmed by Western blotting analysis. (B) Knockdown RCAN1 could significantly increase the colony formation in soft agar.
Results
Effect of RCAN1 downregulation on ESCC cell proliferation, migration, and invasion
Firstly, we explored the functional role of RCAN1 in ESCC progression. We established stable model of RCAN1 knockdown by cell transfection with RCAN1 shRNA in KYSE30 cells. The result in Figure 1A showed that RCAN1 expression was successfully downregulated in the ESCC cell line. The colony-forming assay results revealed that knockdown of RCAN1 could promote ESCC cell proliferation (Figure 1B). The migration and invasion were evaluated by wound-healing assay and Transwell assay, respectively. The results showed that ESCC cell migration and invasion abilities also were improved by the downregulation of RCAN1 (Figure 2A, 2B).
Figure 2
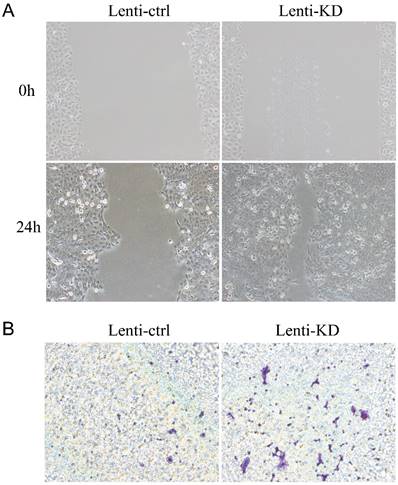
(A) RCAN1 deletion dramatically promoted the migratory ability of ESCC cells in a wound-healing assay. (B) Downregulation of RCAN1 in ESCC cells facilitated cell invasion.
Decreased mRNA expression of RCAN1.1 and RCAN1.2 in tumor tissues of ESCC
To determine the expression of three isoforms of RCAN1 (RCAN1.1, RCAN1.2, and RCAN1.4) in clinical samples, we detected the three RCAN1 isoforms in 100 pairs of ESCC and adjacent noncancerous tissues using real-time PCR. Transcript RCAN1.1 (P=0.0027, Figure 3A) and RCAN1.2 (P=0.0006, Figure 3B) were significantly decreased in tumor tissues compared to their corresponding tumor-adjacent tissues. However, RCAN1.4 displayed no significant difference (P=0.9332, Figure 3C). To further explore the relationship among three isoforms of RCAN1, we performed Spearman correlation analysis among relative expression levels of RCAN1.1, RCAN1.2 and RCAN1.4. The results indicated any two RCAN1 isoforms' expression level was significantly and positively related (Figure 3D).
Figure 3
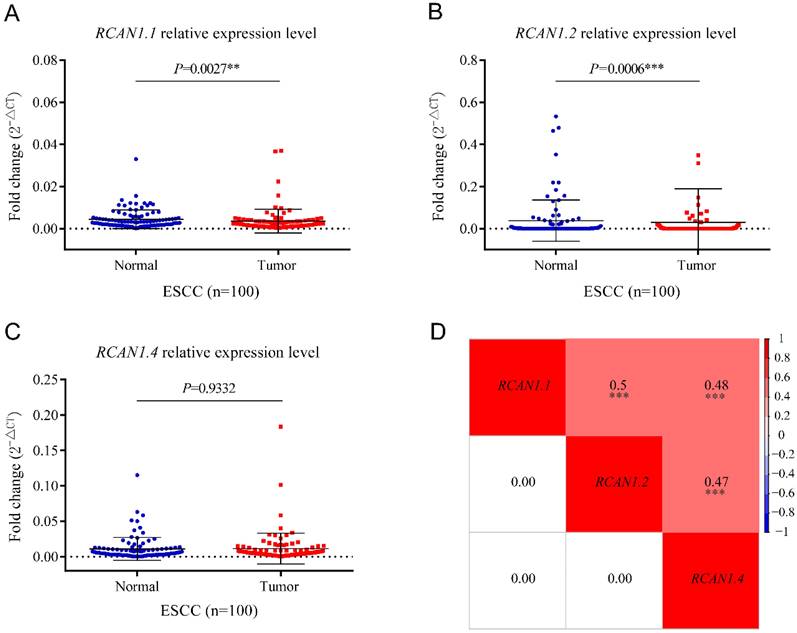
mRNA levels of RCAN1.1 (A), RCAN1.2 (B) and RCAN1.4 (C) transcripts were determined by qRT-PCR in tumor tissues and matched adjacent normal tissues of esophageal cancer patients. Line and error bar represent mean ± SD; **P < 0.01, ***P<0.001. (D) Heatmap of correlation among RCAN1.1, RCAN1.2 and RCAN1.4 relative mRNA expression levels in tumor tissues of ESCC patients. The value in the grids of the upper triangle is Spearman correlation coefficient (Spearman r), which is marked by colors (red: positive correlation; blue: negative correlation). The value in grids of the lower triangle is P value of Spearman correlation. ∗∗∗P < 0.001.
In external cohorts, RCAN1.2 was down-regulated in ESCC tumor tissues compared with matched normal tissues in both two external cohorts (Table S2). Although without significant difference, the expression trend of RCAN1.2 in external cohorts was consistent with that in our cohort, which accumulated evidences to verify the results about RCAN1.2 in our study. In addition, the expression trend of RCAN1.4 was contradictory in GSE164158 and GSE149609 datasets without significance, which from a side proved our results. The RCAN1.1 expression trend was also contradictory in GSE164158 and GSE149609 datasets without significance, but significantly decreased in our cohort, which needs further investigation.
Correlation between RCAN1.1, RCAN1.2 and RCAN1.4 mRNA expression and clinical characteristics of patients with ESCC
The patients were divided into low expression group (n=50) and high expression group (n =50) based on the median mRNA expression value of three RCAN1 isoforms in ESCC tissues. The analysis of the relationship between the mRNA expression of RCAN1.2 and clinical pathological features (Table 1) revealed that the low mRNA expression of RCAN1.2 in ESCC tissues was significantly associated with male sex (P=0.023), advanced stage (P=0.032), and LNM (P=0.008). No significant association was found between RCAN1.2 level and age, drink history, family history of cancer, concomitant cardiovascular and cerebrovascular diseases, and differentiation (all P > 0.05). Although without significance, the tumors with large size (max diameter≥5cm, P=0.052) and patients with smoke history (P=0.069,) had much high ratio of low RCAN1.2 level. Figure 4 showed, in patients with advanced stage (III-IV), the mRNA expression of RCAN1.2 was significantly lower than that in patients with early stage (P=0.0176, Figure 4B). And the mRNA expression of RCAN1.2 was significantly lower in patients with LNM than that in patients without LNM (P=0.0219, Figure 4E). These results indicated that RCAN1.2 might be involved in the development and progression of ESCC. While no significant difference in RCAN1.2 mRNA expression was found between patients with different tumor size (P=0.0743, Figure 5 B) and tumor differentiation (P=0.7221, Figure 4E).
Table S3 showed low RCAN1.1 (P=0.015) expression were related with younger age (P=0.015). There was no association between RCAN1.1 expression level and other clinical features including tumor's stage, LNM, size, differentiation, gender, smoke and drink history, family history of cancer, and concomitant cardiovascular and cerebrovascular diseases (Figure 4-5 and Table S3). Table S4 revealed low RCAN1.4 was significantly associated with younger age (P=0.015), drink history (P=0.015), and poor-moderate differentiation (P=0.026). However, Figure 5F showed the RCAN1.4 expression level was higher in tumors with poor-moderate differentiation than that in tumors with well differentiation.
RCAN1.2 as an independent prognosis factor in ESCC
The Kaplan-Meier survival curves according to RCAN1.1, RCAN1.2 and RCAN1.4 mRNA expression level were shown in Figure 6, which uncovered that ESCC patients with low RCAN1.2 mRNA levels had shorter survival time compared to those with high RCAN1.2 mRNA levels (P=0.007, Figure 6B). Furthermore, the subsequent Cox's univariate and multivariate analysis (Table 2) demonstrated that RCAN1.2 mRNA level was an independent prognostic indicator of postoperative OS of patients with ESCC (high vs low expression, hazard ratio=0.5266, P=0.03554). However, there was no significant influence on patients' OS of RCAN1.1 and RCAN1.4 expression level (Figure 6 and Table 2). The Kaplan-Meier survival curves according to clinical features were shown in Figure 7. As expected, patients with advanced stage (Figure 7A, P=0.0024) and LNM (Figure 7B, P<0.0001) had shorter OS time. Multivariate Cox analysis showed LNM was independent risk factor of poor prognosis (hazard ratio=4.1575, P=0.00112, Table 2).
Figure 4
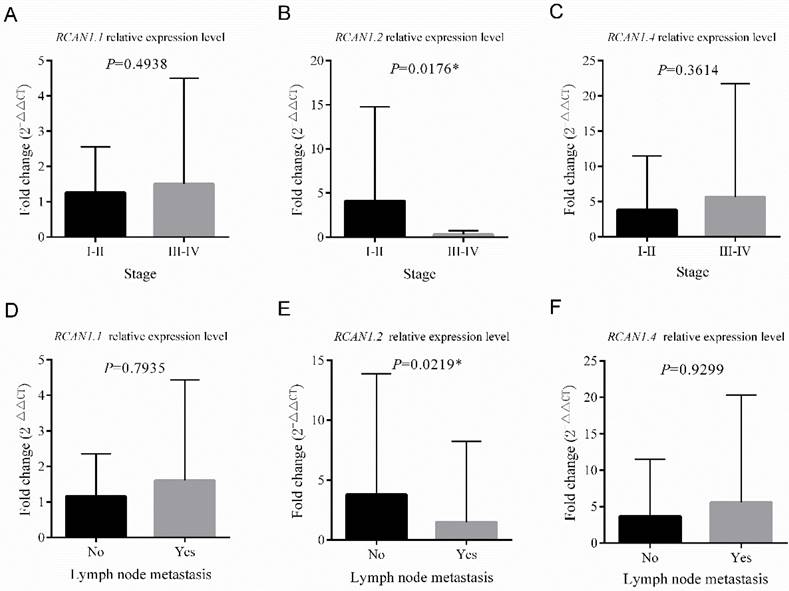
Comparison of the relative mRNA expression levels of RCAN1.1, RCAN1.2 and RCAN1.4 according to Stage (A-C) and Lymph node metastasis (D-E) in 100 esophageal cancer tissues. Line and error bar represent mean ± SD; *P < 0.05.
Figure 5
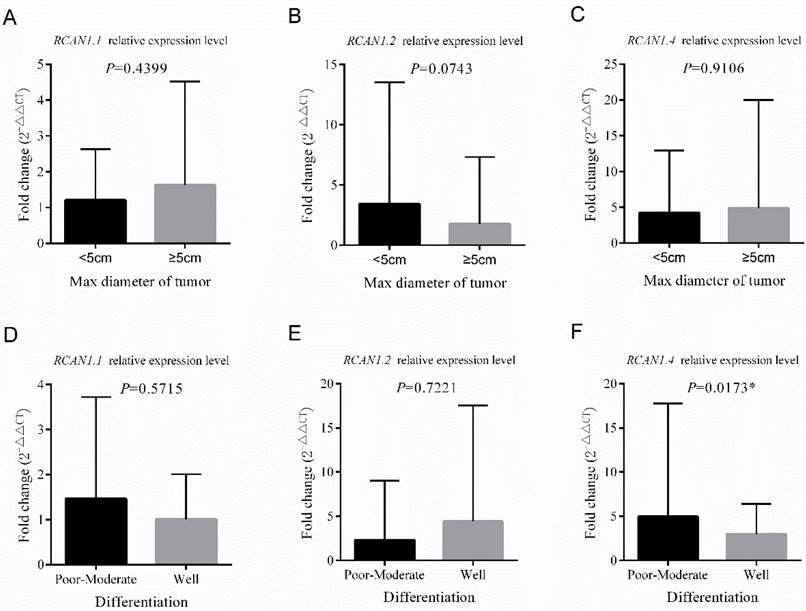
Comparison of the relative mRNA expression levels of RCAN1.1, RCAN1.2 and RCAN1.4 according to Max diameter of tumor (A-C) and Differentiation of tumor (D-E) in 100 esophageal cancer tissues. Line and error bar represent mean ± SD; *P < 0.05.
Table 2
Univariate and multivariate Cox analysis of factors for the overall survival of esophageal cancer patients
| Variables | Univariate analysis | Multivariate analysis | ||
|---|---|---|---|---|
| HR | P value | HR | P value | |
| Gender (Female vs. Male) | 0.7487 | 0.329 | ||
| Age (≤60 vs >60) | 0.5523 | 0.081 | 0.6483 | 0.21235 |
| Smoke (Yes vs. No) | 1.5616 | 0.111 | ||
| Drink (Yes vs. No) | 1.01460 | 0.959 | ||
| Family history of cancer (Yes vs. No) | 0.7379 | 0.332 | ||
| Cardiovascular and cerebrovascular diseases (Yes vs. No) | 0.8189 | 0.476 | ||
| RCAN1.1 (High vs. Low) | 0.8032 | 0.433 | ||
| RCAN1.2 (High vs. Low) | 0.4669 | 0.00848** | 0.5266 | 0.03554* |
| RCAN1.4 (High vs. Low) | 0.8344 | 0.515 | ||
| LNM (Yes vs. No) | 3.2713 | 2.76E-05*** | 4.1575 | 0.00112** |
| Stage (I-II vs III-IV) | 0.4358 | 0.00312** | 1.7347 | 0.20912 |
| Tumor diameter (≥5cm vs <5cm) | 1.2610 | 0.426 | ||
| Differentiation (Well vs Poor-moderate) | 0.7519 | 0.363 | ||
Footnote: *P<0.05, **P<0.001, ***P<0.001
To further determine the intrinsic impact of RCAN1.2 mRNA level on prognosis, we performed PSM analysis to make tumor stage and LNM status distribution comparable between low RCAN1.2 group and high RCAN1.2 group. A total of 87 ESCC patients were selected, including 50 patients with low RCAN1.2 level and 37 patients with high RCAN1.2 level. The results of Cox proportional hazards analysis after PSM analysis were shown in Table S5. From Table S5, we can see low RCAN.2 level is still a risk factor of poor prognosis. However, its independent predictive power has been weakened (P=0.05737) after rigorous adjustment by tumor stage and LNM status, combining PSM analysis with Multivariate COX analysis. The results in Figure 8 indicated RCAN1.2 mRNA level could furtherly refine patients' prognosis based on tumor stage and LNM status.
A nomogram to predict survival probability of ESCC patients
Nomogram was constructed based on Cox regression model with R. After univariable analysis, the variables of P<0.1 including RCAN1.2, LNM, stage and age were entered into build nomogram. A total score was calculated to predict 2-year and 5-year survival probability of ESCC patients, which was shown in Figure 9A. The C-index and calibration curve were used to evaluate the predictive performance of the nomogram. The C-index of the nomogram was 0.693. The calibration curves of the nomogram were presented in Figure 9B and 9C, which showed the probability of 2-year and 5-year survival were well consistent between the predictive and actual observed survival rates.
Figure 6
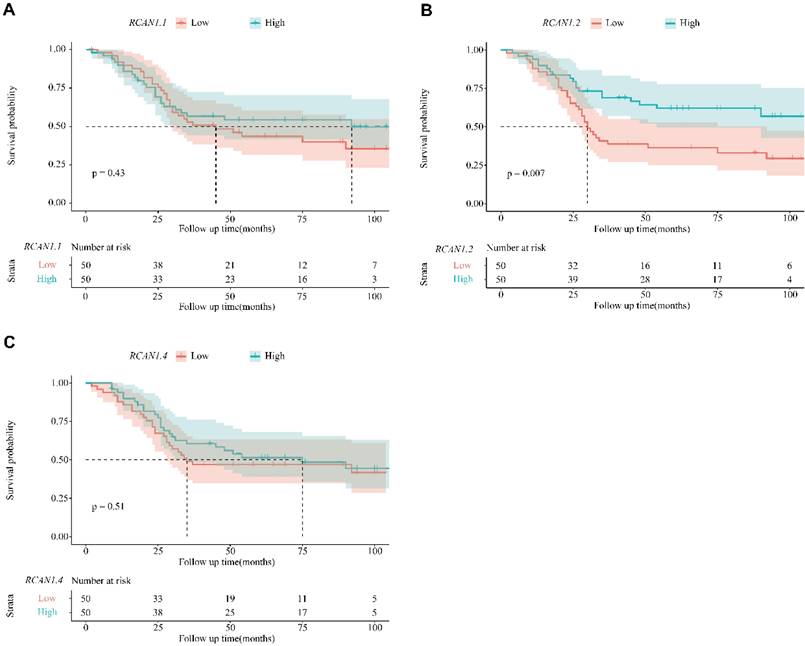
Kaplan-Meier overall survival curve for patients with esophagus cancer between the two groups of RCAN1.1 high and RCAN1.1 low mRNA expression (A), RCAN1.2 high and RCAN1.2 low mRNA expression (B), RCAN1.4 high and RCAN1.4 low mRNA expression (C).
Discussion
Esophageal squamous cell carcinoma is the predominant histologic subtype of esophageal cancer [14]. Its fast growth rate and high probability of regional and distant metastasis contributes to the poor prognosis [15]. ESCC was associated with a poorer survival compared with esophageal adenocarcinoma (EAC) [16]. Evidences showed that there are distinct molecular differences between squamous cell carcinomas and adenocarcinomas [17, 18], implying different signaling pathways involved in the development and progression of esophageal cancer with different subtypes. In this study, we found that downregulation of RCAN1 had a tumor-promoting effect on ESCC cells and RCAN1.2 mRNA level of tumor tissue may be as predictor for ESCC postoperative prognosis.
The RCAN1 gene, located on chromosome 21 in the Down syndrome critical region, has been reported to participate in a wide range of biological process and various pathophysiological changes, including Down syndrome, Alzheimer's disease and type 2 diabetes[19]. Human tissues express three main RCAN1 transcript isoforms (RCAN1.1, RCAN1.2 and RCAN1.4), generated via alternatively splicing. Previous studies showed that RCAN1 and its isoforms play a critical role on tumor inhibition. For example, in oral squamous cell carcinomas (OSCC), silencing RCAN1 could reverse the cell proliferative inhibition, cell cycle arrest and cell apoptosis induced by miR-103a-3p knockdown[20]. And RCAN1.4 knockdown could promote cell proliferation, migration and invasion, as well as improved sunitinib resistance in clear cell renal cell carcinoma [21]. Additionally, suppression of RCAN1.4 induced cell proliferation and metastasis in NSCLC cells [22] and thyroid cancer cells [23]. In our current study, we found that RCAN1 downregulation enhanced ESCC cells proliferation, migration and invasion. These results indicated that RCAN1 may serve as a tumor suppressor in ESCC.
RCAN1 was previously shown to be a competitive inhibitor of phosphatase calcineurin, leading to restraint of nuclear factor of activated T cells (NFAT) activation and signaling axis[24]. Several findings have demonstrated that calcineurin-NFAT pathway plays an important role on malignancy and tumor progression [25-27]. It was reported that the activation of c-Myc, which is a critical transcription factor for cancer cell proliferation was regulated by activated NFAT binding to an element located in the minimal c-Myc promoter [28]. Previous study showed that RCAN1.4 could prevent proliferation, migration, and invasive activity of hepatocellular carcinoma by reducing calcineurin activity and blocking nuclear translocation of NFAT [9]. Meanwhile, RCAN1 was found as an endogenous inhibitor of NF-κB signaling pathway through interacting with IκBα and affect the phosphorylation of IκBα at tyrosine 42. Overexpression of RCAN1 could restrain the lymphoma growth in mice via inhibiting NF-κB[7]. In addition, the transcription of cyclo-oxygenase 2 (COX2) was also induced by NFAT proteins. COX2 has been uncovered as a key enzyme in tumor cell migration and the metastatic dissemination of most human tumors[29]. It has been reported that RCAN1 might act as endogenous negative modulator of COX-2 expression and activity by inhibiting calcineurin and NF-кB pathways to maintain vascular contractility and stiffness[30]. In the present study, we found that knock-down RCAN1 in ESCC cell could improve cell migration and invasion abilities. However, the potential mechanisms of RCAN1 in ESCC need further exploration.
Figure 7
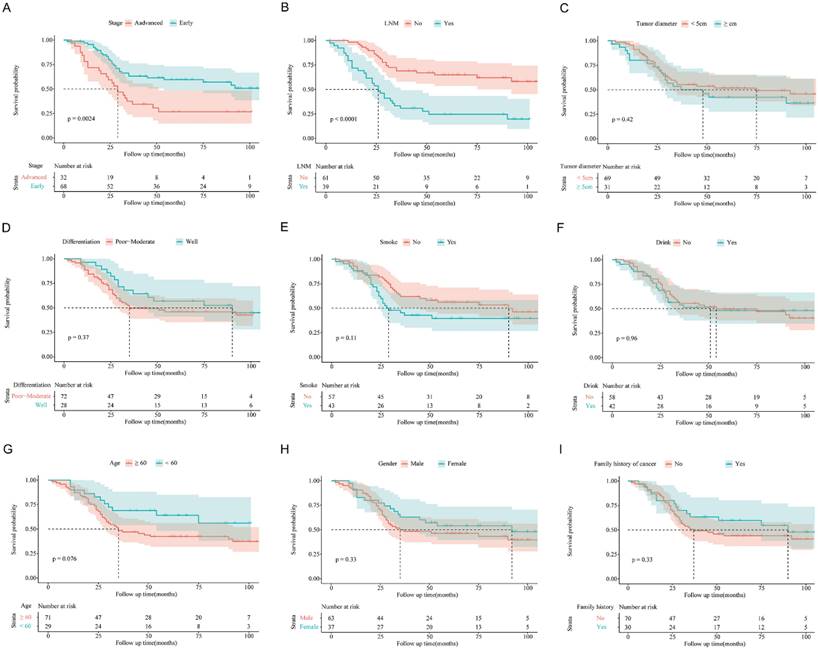
Kaplan-Meier overall survival curve for patients with esophagus cancer according to stage (A), lymph node metastasis status (B), tumor diameter (C), differentiation (D), smoke history (E), drink history (F), age (G), gender (H) and family history of caner (I).
Figure 8
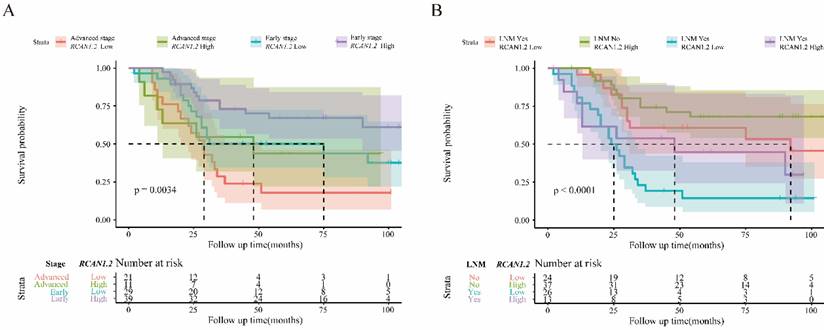
(A) Kaplan-Meier overall survival curve for patients with esophagus cancer according to tumor stage and RCAN1.2 mRNA level. (B) Kaplan-Meier overall survival curve for patients with esophagus cancer according to LNM status and RCAN1.2 mRNA level.
Figure 9
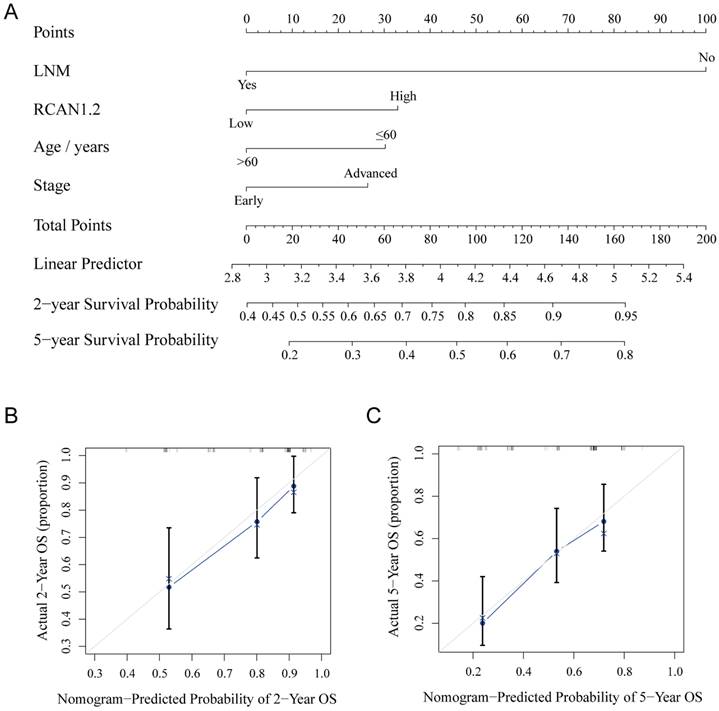
(A) A nomogram predicting the 2-year survival probability and 5-year survival probability based on lymph node metastasis status, RCAN1.2 relative mRNA expression level, patients' age and tumor stage. (B-C) The calibration curves for the nomogram to predict 2-year survival probability (B) and 5-year survival probability (C).
Besides RCAN1 plays a role in the tumor cell proliferation, migration and invasion. Previous studies have demonstrated that RCAN1 is involved in angiogenesis. For instance, RCAN1.4 regulates endothelial cell migration by establishing endothelial cell polarity in response to VEGF [31]. Meanwhile, VEGFA play a vital role in RCAN1.4-mediated PDAC angiogenesis[32]. Moreover, RCAN1.4 could regulate epithelial-mesenchymal transition (EMT) in sunitinib-resistant clear cell renal carcinoma cell lines [21]. In this study, decreased RCAN1.2 mRNA expression was found in tumor tissues compared with adjacent tissues. However, the role of RCAN1.2 in cancer progression is barely reported. Our results suggested that the mRNA expression of RCAN1.2 in ESCC tissues was associated with tumor stage and LNM. And RCAN1.2 is an independent prognosis factor in ESCC. A nomogram based on RCAN1.2 expression, tumor stage, LNM and patients' age presented good performance to predict 2-year and 5-year survival probability.
Despite the novelties in this study, there are some limitations worthy of statement. We firstly confirmed RCAN1's functional role in vitro, then performed clinical study to identify RCAN1.2 mRNA as an independent prognosis factor of ESCC. Because commercialized RCAN1.2 antibody was not available at present, the protein expression experiment of RCAN1.2 was not conducted. And additional invitro functional experiment focused on RCAN1.2 was not carried out. Further study is needed to investigate the role of RCAN1.2 in the development of ESCC by further assess the up- and down-stream signal pathway of RCAN1.2.
Conclusions
To summarize, these findings show that RCAN1 play a role in preventing proliferation, migration, and invasive activity of ESCC cells. And RCAN1.2 mRNA of tumor tissue was identified as a novel prognostic marker in ESCC, targeting RCAN1.2 may provide a potential therapeutic approach in ESCC.
Abbreviations
EC: Esophageal cancer; ESCC: esophageal squamous cell carcinoma; LNM: lymph node metastasis; OSCC: oral squamous cell carcinomas; OS: overall survival.
Supplementary Material
Supplementary tables.
Acknowledgements
Funding
This work was supported by grants from the Major Projects of Science and Technology Department in Anyang City (2022A02SF002 to F. Zhou), Henan Provincial Health Commission Outstanding Young Talents Project (YXKC2021045 to Y. Zhang), Joint Construction Project in Henan Province (LHGJ20200805 to Y. Zhang), Science and Technology Project in Henan Province (212102310702 to Y. Zhang), Joint project in Henan Province (SBGJ202002129 to Y. Zhang) , Science Foundation of Anyang City (2021C01SF011 to Y. Zhang).
Ethics approval and consent to participate
This research was approved by the Ethical Review Committee of Anyang Tumor Hospital and written informed consent was obtained from all participants. All procedures performed in this study were in accordance with the ethical standards of the institutional and/or national research committee and with the Helsinki declaration.
Authors contributions
HY, FZ and JZ (Jiahuan Zhou) conceived and designed the project. YZ, KH, JL, FZ, and ND collected samples and clinical data. JZ (Jiangman Zhao), WL and SW performed experiments and analyzed the data. HY, FZ, JZ (Jiahuan Zhou and Jiangman Zhao) and KH wrote the manuscript. All authors read and approved the final manuscript.
Competing Interests
The authors have declared that no competing interest exists.
References
1. Collaborators GBDOC. The global, regional, and national burden of oesophageal cancer and its attributable risk factors in 195 countries and territories, 1990-2017: a systematic analysis for the Global Burden of Disease Study 2017. The lancet Gastroenterology & hepatology. 2020;5:582-97
2. Pennathur A, Gibson MK, Jobe BA, Luketich JD. Oesophageal carcinoma. Lancet. 2013;381:400-12
3. Li M, Wang K, Pang Y, Zhang H, Peng H, Shi Q. et al. Secreted Phosphoprotein 1 (SPP1) and Fibronectin 1 (FN1) Are Associated with Progression and Prognosis of Esophageal Cancer as Identified by Integrated Expression Profiles Analysis. Medical science monitor: international medical journal of experimental and clinical research. 2020;26:e920355
4. Baek KH, Zaslavsky A, Lynch RC, Britt C, Okada Y, Siarey RJ. et al. Down's syndrome suppression of tumour growth and the role of the calcineurin inhibitor DSCR1. Nature. 2009;459:1126-30
5. Fuentes JJ, Pritchard MA, Estivill X. Genomic organization, alternative splicing, and expression patterns of the DSCR1 (Down syndrome candidate region 1) gene. Genomics. 1997;44:358-61
6. Ryeom S, Baek KH, Rioth MJ, Lynch RC, Zaslavsky A, Birsner A. et al. Targeted deletion of the calcineurin inhibitor DSCR1 suppresses tumor growth. Cancer cell. 2008;13:420-31
7. Liu C, Zheng L, Wang H, Ran X, Liu H, Sun X. The RCAN1 inhibits NF-kappaB and suppresses lymphoma growth in mice. Cell death & disease. 2015;6:e1929
8. Bush CR, Havens JM, Necela BM, Su W, Chen L, Yanagisawa M. et al. Functional genomic analysis reveals cross-talk between peroxisome proliferator-activated receptor gamma and calcium signaling in human colorectal cancer cells. The Journal of biological chemistry. 2007;282:23387-401
9. Jin H, Wang C, Jin G, Ruan H, Gu D, Wei L. et al. Regulator of Calcineurin 1 Gene Isoform 4, Down-regulated in Hepatocellular Carcinoma, Prevents Proliferation, Migration, and Invasive Activity of Cancer Cells and Metastasis of Orthotopic Tumors by Inhibiting Nuclear Translocation of NFAT1. Gastroenterology. 2017;153:799-811 e33
10. Shen FF, Pan Y, Yang HJ, Li JK, Zhao F, Su JF. et al. Decreased expression of SPINT1-AS1 and SPINT1 mRNA might be independent unfavorable prognostic indicators in esophageal squamous cell carcinoma. OncoTargets and therapy. 2019;12:4755-63
11. Wang J, Xu C, Cheng Q, Zhao J, Wu S, Li W. et al. RNA Sequencing Revealed Signals of Evolution From Gallbladder Stone to Gallbladder Carcinoma. Front Oncol. 2020;10:823
12. Pertea M, Pertea GM, Antonescu CM, Chang TC, Mendell JT, Salzberg SL. StringTie enables improved reconstruction of a transcriptome from RNA-seq reads. Nat Biotechnol. 2015;33:290-5
13. Love MI, Huber W, Anders S. Moderated estimation of fold change and dispersion for RNA-seq data with DESeq2. Genome Biol. 2014;15:550
14. Codipilly DC, Qin Y, Dawsey SM, Kisiel J, Topazian M, Ahlquist D. et al. Screening for esophageal squamous cell carcinoma: recent advances. Gastrointestinal endoscopy. 2018;88:413-26
15. Zhang L, Ma J, Han Y, Liu J, Zhou W, Hong L. et al. Targeted therapy in esophageal cancer. Expert review of gastroenterology & hepatology. 2016;10:595-604
16. Njei B, McCarty TR, Birk JW. Trends in esophageal cancer survival in United States adults from 1973 to 2009: A SEER database analysis. Journal of gastroenterology and hepatology. 2016;31:1141-6
17. Cancer Genome Atlas Research N, Analysis Working Group. Asan U, Agency BCC, Brigham, Women's H, Broad I, et al. Integrated genomic characterization of oesophageal carcinoma. Nature. 2017;541:169-75
18. Salem ME, Puccini A, Xiu J, Raghavan D, Lenz HJ, Korn WM. et al. Comparative Molecular Analyses of Esophageal Squamous Cell Carcinoma, Esophageal Adenocarcinoma, and Gastric Adenocarcinoma. The oncologist. 2018;23:1319-27
19. Peiris H, Keating DJ. The neuronal and endocrine roles of RCAN1 in health and disease. Clinical and experimental pharmacology & physiology. 2018;45:377-83
20. Zhang G, Chen Z, Zhang Y, Li T, Bao Y, Zhang S. Inhibition of miR-103a-3p suppresses the proliferation in oral squamous cell carcinoma cells via targeting RCAN1. Neoplasma. 2020;67:461-72
21. Song Z, Cao Q, Ruan H, Yang H, Wang K, Bao L. et al. RCAN1.4 acts as a suppressor of cancer progression and sunitinib resistance in clear cell renal cell carcinoma. Experimental cell research. 2018;372:118-28
22. Kim DH, Park S, Kim H, Choi YJ, Kim SY, Sung KJ. et al. Tumor-derived exosomal miR-619-5p promotes tumor angiogenesis and metastasis through the inhibition of RCAN1.4. Cancer letters. 2020;475:2-13
23. Wang C, Saji M, Justiniano SE, Yusof AM, Zhang X, Yu L. et al. RCAN1-4 is a thyroid cancer growth and metastasis suppressor. JCI insight. 2017;2:e90651
24. Fuentes JJ, Genesca L, Kingsbury TJ, Cunningham KW, Perez-Riba M, Estivill X. et al. DSCR1, overexpressed in Down syndrome, is an inhibitor of calcineurin-mediated signaling pathways. Human molecular genetics. 2000;9:1681-90
25. Manda KR, Tripathi P, Hsi AC, Ning J, Ruzinova MB, Liapis H. et al. NFATc1 promotes prostate tumorigenesis and overcomes PTEN loss-induced senescence. Oncogene. 2016;35:3282-92
26. Koenig A, Linhart T, Schlengemann K, Reutlinger K, Wegele J, Adler G. et al. NFAT-induced histone acetylation relay switch promotes c-Myc-dependent growth in pancreatic cancer cells. Gastroenterology. 2010;138:1189-99 e1-2
27. Quang CT, Leboucher S, Passaro D, Fuhrmann L, Nourieh M, Vincent-Salomon A. et al. The calcineurin/NFAT pathway is activated in diagnostic breast cancer cases and is essential to survival and metastasis of mammary cancer cells. Cell death & disease. 2015;6:e1658
28. Mognol GP, de Araujo-Souza PS, Robbs BK, Teixeira LK, Viola JP. Transcriptional regulation of the c-Myc promoter by NFAT1 involves negative and positive NFAT-responsive elements. Cell cycle. 2012;11:1014-28
29. Konig A, Fernandez-Zapico ME, Ellenrieder V. Primers on molecular pathways-the NFAT transcription pathway in pancreatic cancer. Pancreatology: official journal of the International Association of Pancreatology. 2010;10:416-22
30. Garcia-Redondo AB, Esteban V, Briones AM, Diaz Del Campo LS, Gonzalez-Amor M, Mendez-Barbero N. et al. Regulator of calcineurin 1 modulates vascular contractility and stiffness through the upregulation of COX-2-derived prostanoids. Pharmacological research. 2018;133:236-49
31. Alghanem AF, Wilkinson EL, Emmett MS, Aljasir MA, Holmes K, Rothermel BA. et al. RCAN1.4 regulates VEGFR-2 internalisation, cell polarity and migration in human microvascular endothelial cells. Angiogenesis. 2017;20:341-58
32. Lao M, Zhang X, Ma T, Xu J, Yang H, Duan Y. et al. Regulator of calcineurin 1 gene isoform 4 in pancreatic ductal adenocarcinoma regulates the progression of tumor cells. Oncogene. 2021;40:3136-51
Author contact
![]() Corresponding authors: Jiangman Zhao, Email: zhaojiangman86com; Yaowen Zhang, E-mail: zhangyaowen621com; Fuyou Zhou, E-mail: ayzhoufuyoucom.
Corresponding authors: Jiangman Zhao, Email: zhaojiangman86com; Yaowen Zhang, E-mail: zhangyaowen621com; Fuyou Zhou, E-mail: ayzhoufuyoucom.
Citation styles
APA
Yang, H., Zhou, J., He, K., Li, J., Zhao, F., Dai, N., Wu, S., Li, W., Zhao, J., Zhang, Y., Zhou, F. (2023). Low RCAN1.2 mRNA Expression Is Associated with Poor Prognosis of Patients with Esophageal Squamous Cell Carcinoma. Journal of Cancer, 14(12), 2361-2372. https://doi.org/10.7150/jca.84307.
ACS
Yang, H.; Zhou, J.; He, K.; Li, J.; Zhao, F.; Dai, N.; Wu, S.; Li, W.; Zhao, J.; Zhang, Y.; Zhou, F. Low RCAN1.2 mRNA Expression Is Associated with Poor Prognosis of Patients with Esophageal Squamous Cell Carcinoma. J. Cancer 2023, 14 (12), 2361-2372. DOI: 10.7150/jca.84307.
NLM
Yang H, Zhou J, He K, Li J, Zhao F, Dai N, Wu S, Li W, Zhao J, Zhang Y, Zhou F. Low RCAN1.2 mRNA Expression Is Associated with Poor Prognosis of Patients with Esophageal Squamous Cell Carcinoma. J Cancer 2023; 14(12):2361-2372. doi:10.7150/jca.84307. https://www.jcancer.org/v14p2361.htm
CSE
Yang H, Zhou J, He K, Li J, Zhao F, Dai N, Wu S, Li W, Zhao J, Zhang Y, Zhou F. 2023. Low RCAN1.2 mRNA Expression Is Associated with Poor Prognosis of Patients with Esophageal Squamous Cell Carcinoma. J Cancer. 14(12):2361-2372.
This is an open access article distributed under the terms of the Creative Commons Attribution License (https://creativecommons.org/licenses/by/4.0/). See http://ivyspring.com/terms for full terms and conditions.