Journal of Cancer
ISSN: 1837-9664
3.2
Impact Factor
ISSN: 1837-9664

 Global reach, higher impact
J Cancer 2024; 15(3):747-763. doi:10.7150/jca.90515 This issue Cite
Research Paper
Leveraging an immune cell signature to improve the survival and immunotherapy response of lung adenocarcinoma
Jiacheng Zhang1,2#, Tianrui Kuang1,2#, Keshuai Dong1, Jia Yu1 ![]() , Weixing Wang3
, Weixing Wang3 ![]()
1. Department of Hepatobiliary Surgery, Renmin Hospital of Wuhan University, Wuhan, 430060, Hubei Province, People's Republic of China.
2. Central Laboratory, Renmin Hospital of Wuhan University, Wuhan, 430060, Hubei Province, People's Republic of China.
3. Department of General Surgery, Renmin Hospital of Wuhan University, Wuhan, 430060, Hubei Province, People's Republic of China.
#Authors contributed equally to this work.
Received 2023-9-25; Accepted 2023-11-26; Published 2024-1-1
Citation:
Zhang J, Kuang T, Dong K, Yu J, Wang W. Leveraging an immune cell signature to improve the survival and immunotherapy response of lung adenocarcinoma. J Cancer 2024; 15(3):747-763. doi:10.7150/jca.90515. https://www.jcancer.org/v15p0747.htm
Other stylesAbstract

Background: Immune cells play a critical role in the prognosis of cancer. However, the function of different immune cell types in lung adenocarcinoma (LUAD) and the development of a prognostic signature based on immune cell types have not been comprehensively investigated.
Methods: We collected and included a total of 2499 LUAD patients and performed calculations to determine the penetration level of 24 immune cells. This examination was conducted using the macro-gene-based approach provided by ImmuCellAI. We performed a meta-analysis using Lasso-Cox analysis to establish the immune cell pair score (ICPS). We conducted a survival analysis to measure differences in survival across ICPS-risk groups. Wilcox test was used to measure the difference in expression level. Spearman correlation analysis was used for the relevance assessment.
Results: We collected a total of 24 immune cell types to construct cell pairs. Utilizing 17 immune cell pairs, we constructed and validated the ICPS, which plays a critical role in stratifying survival and dynamically monitoring the effectiveness of immunotherapy. Additionally, we identified several candidate drugs that target ICPS.
Conclusions: The ICPS shows promise as a valuable tool for identifying suitable candidates for immunotherapy among patients. Our comprehensive assessment of immune cell interactions in LUAD contributes to a deeper understanding of infiltration patterns and functions, thereby guiding the development of more efficacious immunotherapy strategies.
Keywords: immune cell, immunotherapy, lung adenocarcinoma, prognosis, tumor microenvironment
Introduction
Throughout the world, lung cancer is one of the most prevalent malignant tumors that pose a significant risk to human health. This disease has the highest incidence rate as well as mortality rate. Lung adenocarcinoma (LUAD) is the most prevalent histological subtype of lung cancer, possessing unique biological characteristics [1-3]. Clinically, patients with lung adenocarcinoma often lack typical clinical symptoms or even have no symptoms in the early stage, are prone to distant metastasis, and have high drug resistance. These characteristics also make the clinical treatment of lung adenocarcinoma a great challenge. Recently, with the rapid development of medical molecular biology, the treatment of LUAD has gradually diversified, and its pathological classification is also gradually refined. Lung cancer is moving towards the stage of precise diagnosis and treatment. However, the emergence of new treatment modes has also brought new problems and challenges to the clinic. The era of precision medicine has put forward higher requirements for researchers and medical staff.
With the deepening of research, researchers have gradually realized that the continuous and dynamic interaction between cancer cells and the tumor microenvironment (TME) is the key factor in promoting tumor occurrence, development, and metastasis [4]. It is composed of several different types of cells and secreted factors that trigger tumor growth. The important biological characteristics of the tumor tissue microenvironment are tissue hypoxia, low pH, increased tissue stiffness, nutrient deprivation, the formation of interstitial hypertension, and immune-inflammatory reactions [5, 6]. The TME can play an important regulatory role in tumor cell proliferation, survival, tumor angiogenesis, self-renewal of tumor stem cells, and tumor invasion and metastasis by providing growth factors, cell survival-promoting factors, extracellular matrix, and numerous adhesion molecules for tumor cells [7]. Among them, the tumor immune microenvironment, which is composed of macrophages, dendritic cells, neutrophils, B cells, T cells, tumor-associated fibroblasts, and secreted cytokines, constructs the tumor immune barrier, thereby affecting the response rate of immunotherapy [8]. The rapid development of immunotherapy has brought significant development opportunities for tumor therapy in recent years. Immune checkpoint blockers can improve anti-tumor immune response by regulating T cell activity, which has become one of the current research hotspots and the most promising strategies.
In this study, we measured immune cell infiltration levels within each cohort of samples using meta-multiple LUAD cohorts. We collected 24 types of immune cells from ImmuCellAI and established the immune cell pair (ICP) to understand the complex interactions between immune cells realistically. Finally, we created and validated the immune cell pair score (ICPS), which showed strong predictive ability in predicting prognosis and evaluating the efficacy of immunotherapy in LUAD.
Materials and Methods
Data resources
The transcriptome cohorts of LUAD were collected from multiple public databases including the Cancer Genome Atlas (TCGA) databases (TCGA-LUAD), and the gene expression omnibus (GEO) database (n=13). Besides, the immunotherapy data IMvigor210 was downloaded from the “IMvigor210CoreBiologies” R package containing 348 samples corresponding to clinicopathological information [9]. GSE78220, including patients treated with anti-PD-1 antibody, was downloaded from the GEO database [10]. After surgical removal, the pathology was clearly diagnosed as glandular cancer, and the prognostic information was complete, and patients who were not immunotherapeutic at the time of sampling were included in the study. We collected 14 LUAD cohorts [11-26] with transcriptome data and survival data (Table S1). The “DEseq.2” R package was used for the normalization and log (2+1) transformation of TCGA-LUAD data. The normalization of the IMvigor210 cohort was also conducted via “DEseq.2” R package. What's more, a LUAD-specific, meta-entire cohort was collected after preprocessing, merging, and ComBat-adjusting the 14 cohorts via the “sva” R package. The meta-entire cohort included a total of 2499 LUAD samples meeting the requirements for complete information.
The constructed of immune cell pair score (ICPS)
Firstly, the level of immune cell infiltration was conducted by a macro-gene-based approach from the ImmuCellAI (Immune Cell Abundance Identifier) [27, 28]. We can get the infiltration degree of 24 different types of immune cells in each LUAD sample. Then, to increase the comparability between cohorts from different sources and further reduce the batch effect, the immune cell pair index (ICPI) was established. The ICPI was regarded as 1 when the level of immune cell A infiltration exceeded that of another immune cell. Conversely, when the level of immune cell A was lower than that of another immune cell, the ICPI was assigned as 0. In the subsequent phase of analysis, various ICPIs exhibiting consistent values (0 or 1) were excluded to alleviate potential biases stemming from platform-specific priority measurements. Additionally, the entire meta-cohort was split into equal-sized subsets: the meta-training cohort (n=1249) and the meta-testing cohort (n=1250), maintaining a 1:1 ratio according to the random algorithm. The ICPS was constructed using the Lasso regression analysis via the “glmnet” R package in the meta-training cohort [29]. We calculated the coefficients for each ICP using the multivariate Cox proportional hazards model.

Based on the above formula, we could get the ICPS of each LUAD sample. We employed a time-dependent receiver operating characteristic (ROC) curve analysis to effectively classify patients with LUAD into high- and low-risk groups via the "survivalROC" R package [30]. Subsequently, the threshold value for classification in this study was determined based on the ICPS value that exhibited the minimal deviation from the ROC curve at a specific point. As a result, patients with LUAD from various cohorts, including TCGA-LUAD, training, testing, and meta-cohort, were classified into two risk groups according to their ICPS risk level.
Association between ICPS and clinical features of LUAD patients
To explore the prognostic significance of the ICPS, we utilized the "survival" R package to perform subsequent survival analyses. To assess the survival differences between high-risk and low-risk groups based on ICPS, we partitioned the meta-entire cohort into training and testing cohorts. To validate the prognostic role of ICPS, we also utilized the entire pooled cohort. The log-rank test was utilized to assess the significance of survival differences between the groups, considering P < 0.05 as statistically significant. In addition to analyzing ICPS, we also carefully examined other clinical indicators such as age, gender, and TNM staging to evaluate the differences between the risk groups. Statistical significance was established if the p-value obtained from the chi-square test was below the threshold of 0.05. This analysis aided in identifying statistically significant differences in clinical indicators between the low-risk and high-risk cohorts.
Association between ICPS and several mutation Indices
Firstly, we explored the mutation landscape of different risk groups with LUAD via the “maftools” R package [31]. Next, the single-nucleotide variant (SNV) data of LUAD was downloaded from the TCGA database. Based on the SNV data, the tumor mutation burden (TMB) was evaluated to analyze the differences between the ICPS groups [32]. Besides, we analyzed the differences in tumor stemness indicators between ICPS groups, such as transcriptomic signatures based-index (mRNAsi), DNA methylation based-index (mDNAsi), epigenetic regulation based-index (EREG-mDNAsi), differentially methylated probes-based stemness index (DMPsi), and enhancer-based stemness index (ENHsi). The tumor stemness was closely related to tumor prognosis based on the previous studies. What's more, we compared the genomic instability state between ICPS groups according to the homologous recombination deficit (HRD) score, which could help predict the responsiveness of malignant tumors to platinum chemotherapy and PARPi therapy. The Wilcoxon test was used to compare the group differences mentioned above.
The immune landscape of ICPS in LUAD
Firstly, the level of tumor immune infiltrating cells of each LUAD sample was obtained based on the TIMER [33, 34] (https://cistrome.shinyapps.io/timer/), EPIC [35], CIBERSORT [36], and MCPcounter [37]. We explored the relationship between ICPS and tumor immune infiltrating cells by Pearson's correlation analysis. Next, the immune score, stromal score, and tumor purity of the TCGA-LUAD cohort were calculated to explore the association between ICPS and the immune landscape via the “ESTIMATE” algorithm. The T cell dysfunction and exclusion (TIDE) method [38, 39] was utilized to investigate the response to different immune treatments. Additionally, a quantitative assessment was conducted on LUAD samples. The TIDE scores of the LUAD samples were obtained from the website: http://tide.dfci.harvard.edu/. The previous study identified 49 molecular markers related to immune characteristics. Building upon the above-mentioned study, we examined the correlation between ICPS and tumor immune characteristics. Given the substantial importance of immune checkpoints (ICS) and immunogenic cell death (ICD) modulators in tumor immunity, our objective was to investigate the correlation between ICPS and both ICS and ICD modulators. Correlation statistical analyses were performed using the Spearman method. Furthermore, we measured 29 immune functions in the ICPS risk groups via the "CIBERSORT" R package. Subsequent analysis was performed to examine the disparities in immune function across the groups.
Investigating the role of ICPPI in response to immunotherapy
The IMvigor210 cohort including 298 patients who were treated with anti-PD-L1 immunotherapy and GSE78220, including patients treated with anti-PD-1 antibody were used to investigate the association between the ICPS and immunotherapy after normalizing. The Kruskal-Wallis test was used to investigate the difference in ICPS scores across the various response groups (CR, PR, PD, and SD). The “survival” R package was used to explore the difference in survival between the ICPS risk groups. The ROC curves were used to assess the prediction of the efficacy of immunotherapy via the “pROC” R package.
Drug sensitivity exploring
Subsequently, our efforts focused on identifying numerous innovative therapeutic drugs, which provide several new options for treating LUAD. We initially identified the differentially expressed genes (DEGs) between the low-risk and high-risk ICPS groups within the entire meta-cohort via the "limma" R package. Next, we screened for the overlap of up-regulated and down-regulated DEGs between the ICPS-related DEGs and normal-ICPS-related DEGs to perform Connectivity map (CMap) analysis in CLUE (https://clue.io/). Small molecule drugs with |score| ≥ 90 were regarded as potential drugs.
Statistical Analysis
All statistical analyses were conducted using the R software (version 4.1.0). The threshold for statistical significance was set as P < 0.05.
Results
Analytic Pipeline
The LUAD data were obtained from the TCGA and GEO databases. The data were subjected to quality control, batch effect removal, normalization, organization of mutation, and clinical, and survival data, before being used for subsequent analysis. Figure 1 illustrated the main analysis process of this study.
ICPS Construction
Initially, the ImmuCellAI was employed to evaluate immune cell infiltration of the 24 different types in each sample (Table S2). Univariate Cox analysis was conducted to determine the prognostic significance of the 24 distinct immune cell types (Table S3). Figures 2B and 2C illustrated the complex connections between the 24 types of immune cells in LUAD, with a majority of them showing positive connections. In contrast, central memory T cell (Tcm) and effector memory T cell (Tem) exhibited a strong negative connection with other cells. The results suggested that these distinct immune cells could have varying roles in immune infiltration, either working synergistically or antagonistically. Specifically, naïve CD4+ T cell, tregulatory1 cell (Tr1), and CD8+ T cell were identified as risk factors for overall survival (OS) in LUAD. Natural Treg cell (nTreg), mucosal-associated invariant T cell (MAIT), and natural killer cell (NK) were identified as favorable factors for OS in LUAD (Figure 2A). As described in the methodology, a total of 276 immune cell pairs (ICPs) were established using 24 different types of immune cells (Table S4). The entire set of ICPs underwent a log-rank test. A total of 56 ICPs were included in the lasso regression equation (Figure 2D, E), followed by multivariate regression analysis that involved 28 ICPs (Table S5). Finally, 17 ICPs (Table S6) were selected for the construction of ICPS (Figure 2E). The area under the curve (AUC) value of the ROC curve was 0.689 at 5 years (Figure 3A). Additionally, LUAD was split into high-risk and low-risk subgroups using ICPS=9.1417 as the threshold (Figure 3A, Table S7, Figure S1).
Relationship between ICPS and Clinical Features of LUAD
As mentioned earlier, the meta-cohort (n=2499) was divided into a training cohort (n=1249) and a testing cohort (n=1250). Within the training cohort, patients were stratified into two groups based on their ICPS levels: the high-risk group (n=543) and the low-risk group (n=706), according to the predetermined cutoff value. Figure 3B demonstrated that LUAD patients with low ICPS exhibited better OS (P < 0.05). The result was also validated in the testing cohort (P < 0.05), meta-entire cohort (P < 0.05), and TCGA-LUAD cohort (P < 0.05) (Figure 3C-E). Overall, patients with LUAD in the high-risk group of ICPS were at a higher risk of mortality, thus indicating ICPS as a prognostic indicator for LUAD. To determine whether the ICPS was better than previous prognostic signatures, three multiple gene signatures were collected and included in the present study. As shown in Figure 3F, the ICPS showed a better prognosis prediction potential compared to the four-gene signature [40], five-gene signature [41], and six-gene signature [42] in the TCGA-LUAD cohort, especially the ability to forecast over 5 and 10 years. Furthermore, we conducted further investigation into the clinical differences between the risk groups based on ICPS. Additionally, we conducted validation across four cohorts (Figure 3G-J). These clinical characteristics included survival status, age, gender, stage, and grade of relapse (Table S8). The results indicated that patients in the high-risk group of ICPS across the four cohorts exhibited higher rates of relapse (P < 0.05 (training cohort), P = 0.28(test cohort), P < 0.05 (total cohort)) and poorer survival status (higher proportion of mortality) (P < 0.05 (training cohort), P < 0.05 (test cohort), P < 0.05 (total cohort), P < 0.05 (TCGA-PAAD cohort)).
Association between ICPS and Mutation
Figure 4A presented the mutation landscape of the 25 most highly mutated genes in patients with LUAD based on TCGA data. The high-risk cohort displayed a significantly higher mutation rate compared to the low-risk cohort. However, for some special mutations in LUAD, such as EGFR, KRAS, STK11, and TP53, no significant difference was found between the high and low ICPS groups, both in the wild-type and mutation-type of these genes (Figure 4B, Table S9, P > 0.05). Higher TMB, coupled with increased somatic mutation rates, has been associated with enhanced anti-cancer immunity. Figure 5E demonstrates that the TMB level exhibited a significant increase in the ICPS high-risk group in comparison to the low-risk group (P < 0.05).
Figure 1
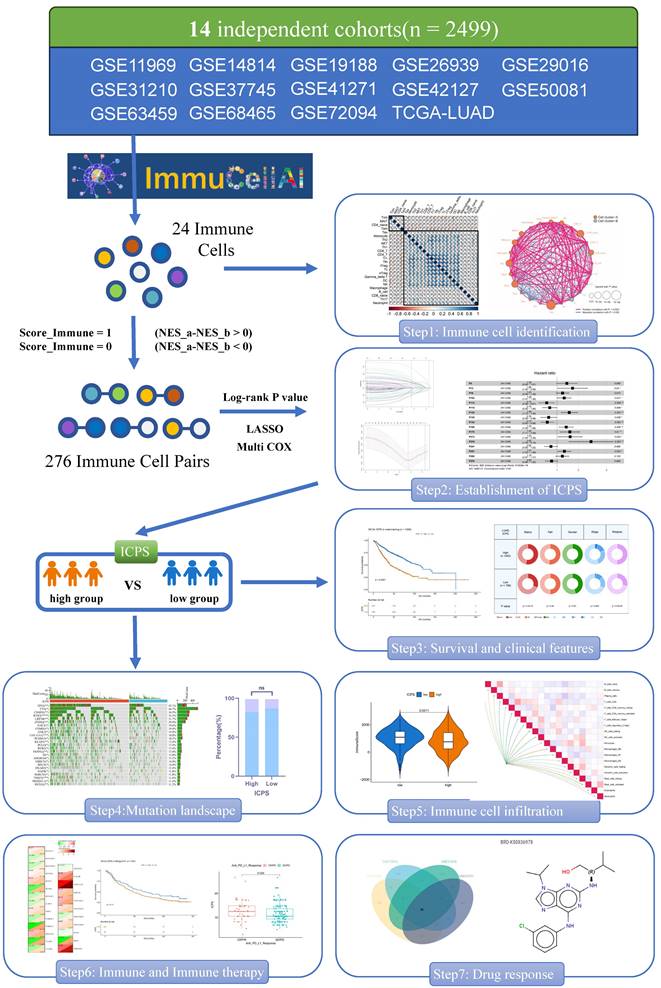
The flow diagram of this study.
Figure 2
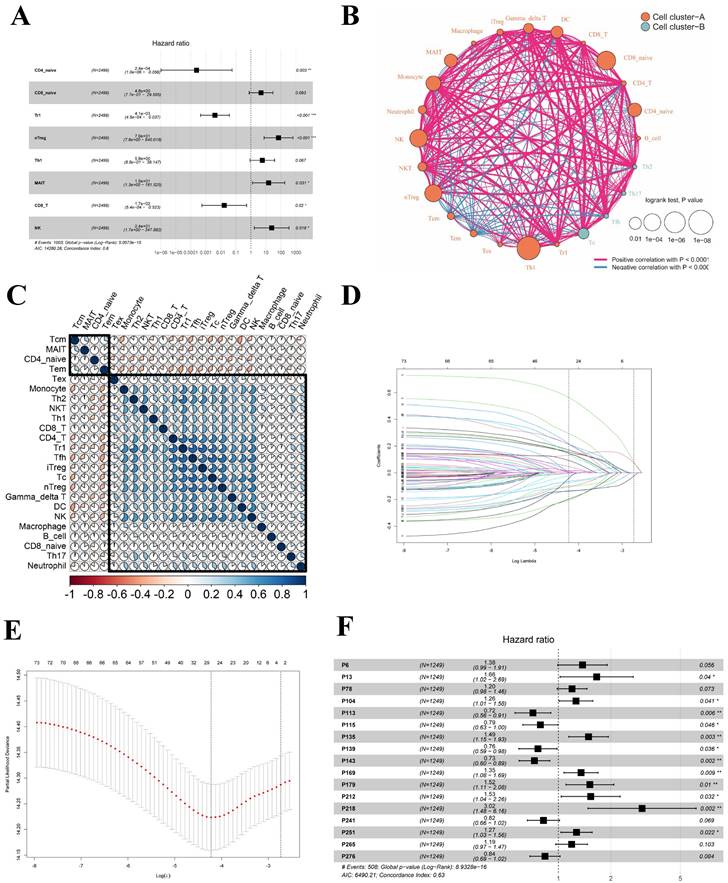
Screening of immune cells and establishment of immune cell pair score (ICPS). (A) Forest plot for the Hazard Ratios (HRs) of Immune cells. (B, C) Cellular interaction and survival landscape of the 24 immune cell types. (D, E) Plot of partial likelihood deviance for the 17 immune cell pairs (ICPs) associated with survival in the training set. (F) Forest plot for the HRs of ICPs used for ICPS construction.
Figure 3
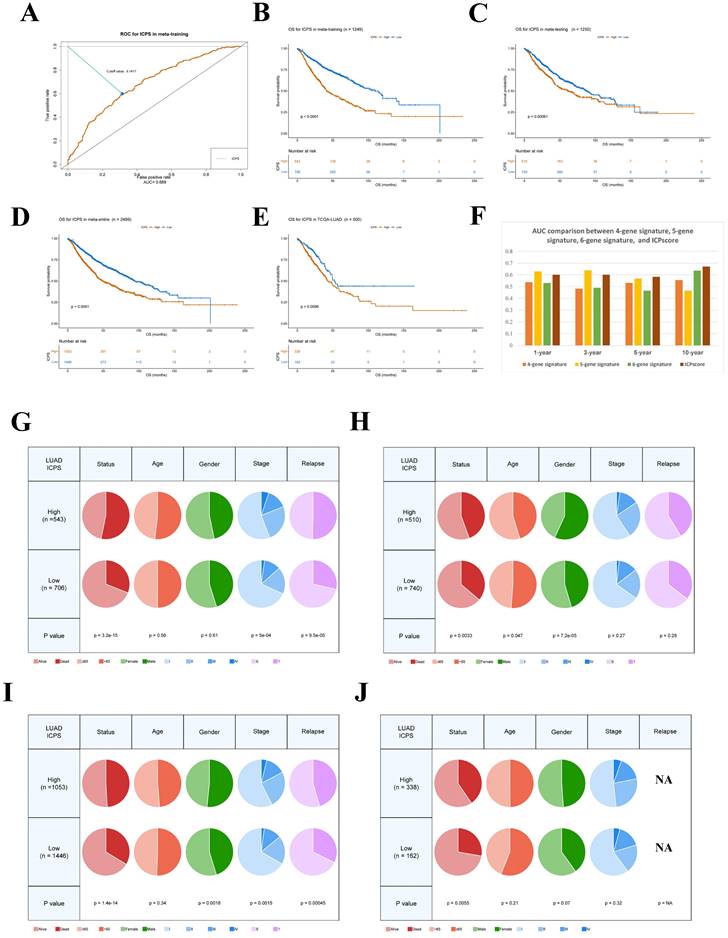
Survival and clinical difference between ICPS high-risk and ICPS low-risk group. (A) Time-dependent ROC curve for ICPS in the meta-training cohort at 5 years. (B) Overall survival curve for ICPS in the training cohort (n=1249). (C) Overall survival curve for ICPS in the testing cohort (n=1250). (D)Overall survival curve for ICPS in the entire meta-cohort(n=2499). (E) Overall survival curve for ICPS in the TCGA-LUAD data (n=500). (F) AUC comparison between 4-gene signature, 5-gene signature, 6-gene signature, and ICPS. (G-J) The differences in clinical features including status, age, gender, stage, and relapse between the two ICPS risk groups. (G) meta-training cohort, (H) meta-testing cohort, (I) entire meta-cohort, (J) TCGA-LUAD cohort.
Figure 4
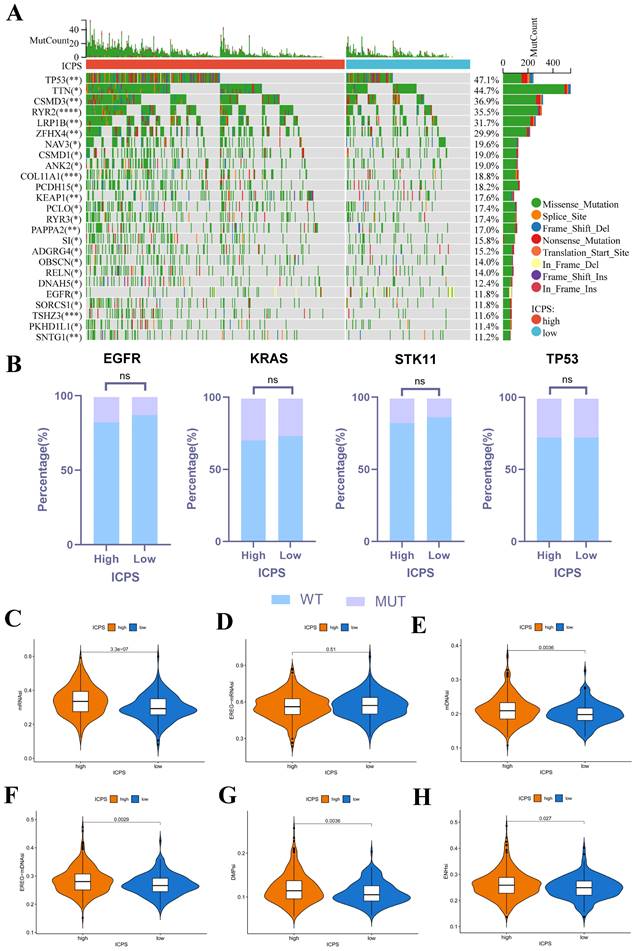
Correlation between ICPS and genomic mutations using TCGA-LUAD data. (A) The waterfall plots of the top 25 genes with the highest mutation rate in the TCGA-LUAD. (B) Correlation between ICPS and gene mutation. (C) Correlation between ICPS and mRNAsi. (D) Correlation between ICPS and EREG-mRNAsi. (E) Correlation between ICPS and mDNAsi. (F) Correlation between ICPS and EREG-mDNAsi. (G) Correlation between ICPS and DMPsi. (H) Correlation between ICPS and ENHsi.
RNAsi was identified as a novel predictor associated with stem-like characteristics and tumor prognosis. No significant difference was observed in EREG-mRNAsi score levels between the two groups (Figure 4D, P > 0.05). Patients in the ICPS low-risk group exhibited lower mRNAsi scores (Figure 4C, P < 0.05), mDNAsi (Figure 4E, P < 0.05), EREG-mDNAsi (Figure 4F, P < 0.05), DMPsi (Figure 4G, P < 0.05), and ENHsi (Figure 4H, P < 0.05) when compared to those in ICPS high-risk set. HRD leads to impaired repair of double-strand breaks, making it a common driver of tumorigenesis. Patients in the ICPS low-risk set showed lower HRD scores and higher HRD expression compared to those in the ICPS high-risk set (Figure 5C-D, P < 0.05) (Table S10).
The immune landscape of ICPS in LUAD
The association between ICPS and tumor immune infiltrating cells was explored. The study concluded that ICPS showed positive correlations with macrophages, CD8+-T cells, and cancer-associated fibroblasts (CAFs). Furthermore, ICPS exhibited a negative association with NK cells, B cells, CD4+-T-cells, and endothelial cells, as indicated by the TIMER (Figure 5A, Table S11). Additional analyses demonstrated that ICPS showed positive associations with cytotoxic lymphocytes, NK cells, CD8+-T-cells, monocytic lineage, and fibroblasts. Conversely, ICPS demonstrated negative associations with B lineage, myeloid dendritic cells, T-cells, neutrophils, and endothelial cells from the EPIC (Figure 6B, Table S11). Furthermore, the results obtained using the CIBERSORT and MCPcounter algorithms were in line with the aforementioned findings (Figure S2, Table S11). Immune-related scores are valuable in assessing the prognosis of tumor patients and the effectiveness of immunotherapy. Our results indicated that patients in the low-risk group exhibited higher ESTIMATE scores (Figure 5F, P < 0.05), immune scores (Figure 5G, P < 0.05), and stromal scores (Figure 5H, P < 0.05) compared to those the high-risk set (Table S10). The analysis revealed that LAG3, PDCD1, TMIGD2, TNFRSF18, TNFRSF4, TNFRSF8, TNFSF4, CD276, CD70, and IDO1 displayed positive associations with ICPS. In contrast, IDO2, TNFSF15, BTLA, CD28, CD40LG and HHLA2 exhibited negative associations with ICPS (Figure 6A). Additionally, PANX1, CALR, CXCL10, EIF2A, EIF2AK1, and HMGB1 showed a positive correlation with ICPS. Conversely, IFNK, P2RY2, TLR3, and HGF exhibited a negative correlation with ICPS (Figure 6B). Tertiary lymphoid structures (TLS) were found to play a crucial role in tumor immunity. This study examined the correlation between ICPS and TLS gene signatures. The results revealed a positive association between ICPS and CCL3, CCL4, CCL5, CCL8, CXCL10, CXCL11, and CLCL9 (Figure 6C) (Table S12).
Relationship between ICPS and immunotherapy
Immunotherapies, such as PD-L1 and PD-1 blockade, have undoubtedly made significant advances in tumor treatments. The low-risk subgroup of patients (n = 86) exhibited longer survival (Figure 7A, Table S13, P = 0.11) compared to the ICPS high-risk subgroup (n = 261) in IMvigor210. Furthermore, the study explored the predictive value of the ICPS in anti-PD-L1 immunotherapy (Figure 7B-E). Patients with ICPS-high risk were more likely to benefit from anti-PD-L1 treatment (Figure 7B-C), as confirmed by the Wilcox test (P = 0.029, Figure 7D-E). ICPS was identified as a predictive biomarker for anti-PD-L1 immunotherapy benefits (Figure 7F, AUC = 0.600). Furthermore, we investigated whether ICPS could play a role in the response to anti-PD-1 treatment using cohort GSE78220. Patients with ICPS-low risk showed better survival (P = 0.19, Figure 7G). Patients with ICPS-low risk showed a better response to anti-PD-1 immunotherapy (Figure 7H-I), as indicated by the results of the Wilcox test (P = 0.96, Figure 7J-K). The ICPS was further demonstrated to be a reliable predictive tool for the benefits of anti-PD-1 therapy (AUC = 0.538, Figure 7L) (Table S13). Despite the limited sample size and its non-LUAD origin, the results confirmed that ICPS plays a significant role in predicting the response to immunotherapy.
Novel Candidate Drugs Treating LUAD
After categorizing LUAD patients into ICPS high and low-risk groups, a total of 115 DEGs consisting of 65 up-regulated DEGs and 50 down-regulated DEGs were identified through a meta-entire cohort (Figure 8A-B, Table S14). The top 50 DEGs were then selected for CMap (Connectivity map) analysis. This pattern of gene regulation highly overlaps with several drugs that could be involved in the treatment of PAAD patients (Table S15), including BRD-K50836978 (purvalanol-a), BRD-K71035033 (masitinib), BRD-K04546108 (JAK3-inhibitor-VI), BRD-K52522949 (NCH-51), BRD-K56334280 (amonafide), and BRD-K22503835 (scriptaid) (Figure 8C-H).
Figure 5
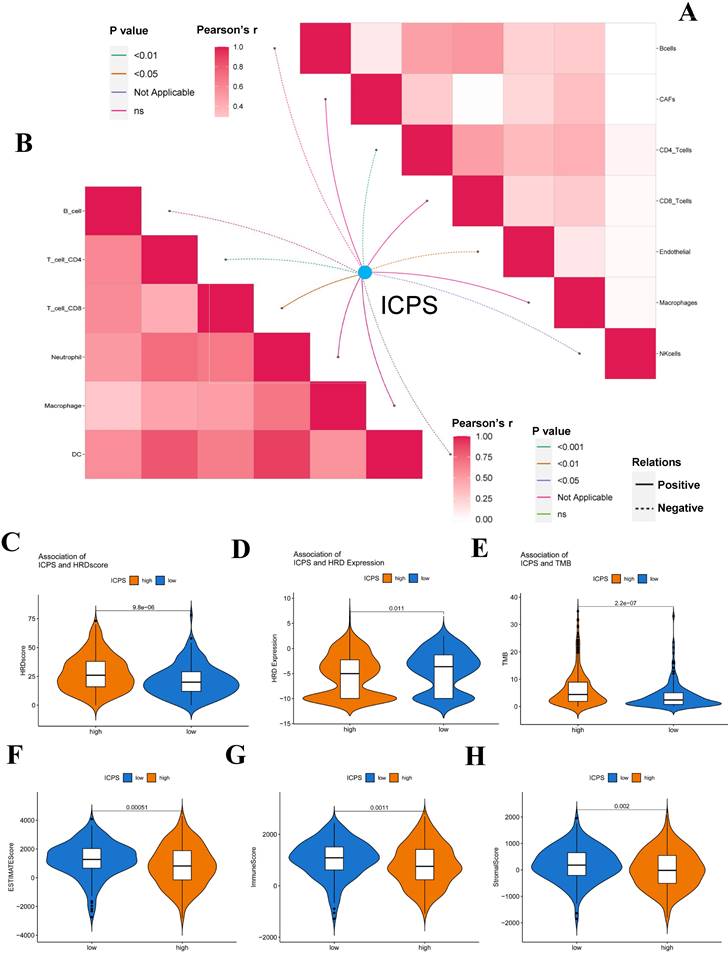
Correlation between ICPS and immune features. (A) Correlation between ICPS and immune cells in TIMER database. (B) Correlation between ICPS and immune cells based on EPIC. (C) Correlation between ICPS and HRD score. (D) Correlation between ICPS and HRD expression. (E) Correlation between ICPS and TMB. (F) Correlation between ICPS and ESTIMATE score. (G) Correlation between ICPS and immune score. (H) Correlation between ICPS and stromal score.
Figure 6
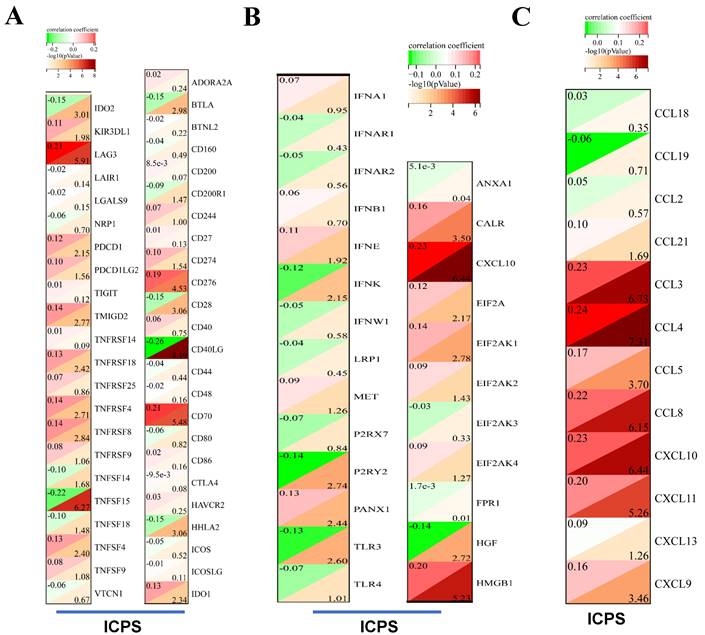
Immune landscape of ICPS in LUAD. (A) Correlation between ICPS and immune indicators. (B) Correlation between ICPS and ICD modulators. (C) Correlation between ICPS and TLSs.
Discussion
Currently, the incidence and mortality of lung cancer are at the forefront of all kinds of malignant tumors. The most common histological type is LUAD. Historically, surgery, radiotherapy, and chemotherapy have been the primary treatment modalities. Recently, EGFR-TKIs targeted therapy and immunotherapy have emerged as promising approaches for patients with LUAD [43]. However, despite having high PD-L1 expression, patients with LUAD did not derive notable benefits from immunotherapy, possibly due to their unique TME [44]. TME is composed of tumor cells, stromal components, and immune components. Numerous studies have increasingly shown the significance of immune cell infiltration within the TME in influencing the prognosis of malignant tumor patients and the effectiveness of immunotherapy [45, 46]. However, the heterogeneity of tumor patients results in variability in the TME of LUAD patients, potentially contributing to differences in their response to immunotherapy [47, 48]. Hence, investigating the heterogeneity of the TME in LUAD patients was deemed crucial for identifying novel strategies in the selection of patients for immunotherapy. In this study, we evaluated the infiltration levels of 24 types of immune cells in 2499 LUAD samples from 14 different public datasets using the ImmuCellAI. ImmuneAI can identify 6 types of immune cells and 18 subsets of T cells, including iTreg, Tc, and exhausted T cells etc. The T cell subpopulations in question are of significant importance in the context of tumor immunity and immunotherapy.
Figure 7
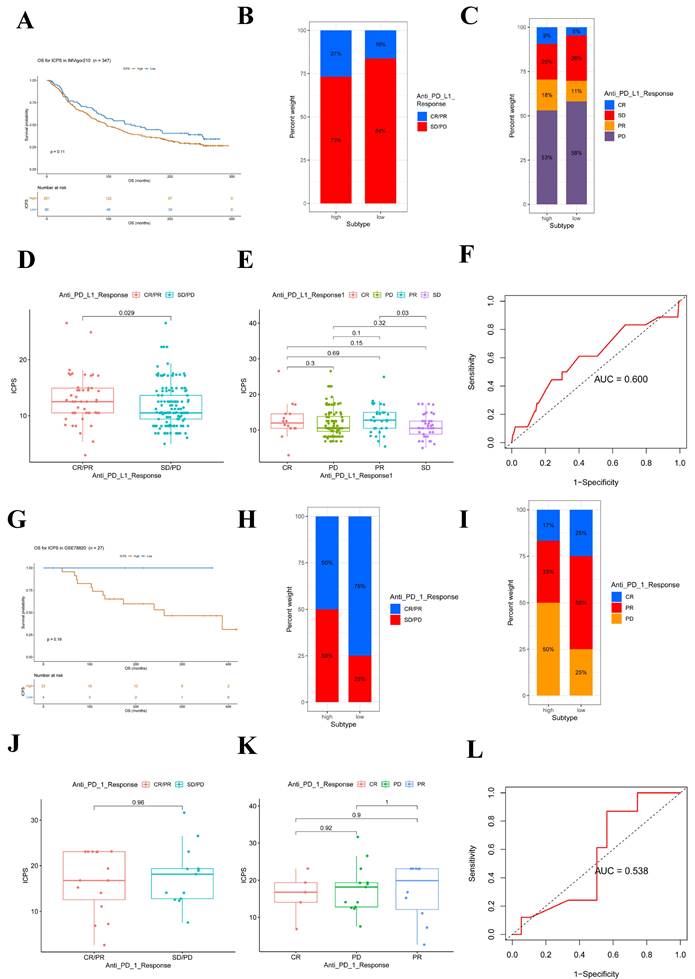
ICPS for predicting the effect of immunotherapy. (A) Kaplan-Meier curves for patients with high (n = 261) and low (n =86) ICPS in the IMvigor210 cohort. (B) Rate of clinical response (complete response (CR)/ partial response (PR) and stable disease (SD)/progressive disease (PD)) to anti-PD-L1 immunotherapy in high or low ICPS groups in the IMvigor210 cohort. (C) Rate of clinical response to anti-PD-L1 immunotherapy in high or low ICPS groups in the IMvigor210 cohort. (D, E) Distribution of ICPS in groups with different anti-PD-L1 clinical response statuses. (F) ROC curve measuring the predictive value of the ICPS. (G) Kaplan-Meier curves for patients with high (n = 23) and low (n =4) ICPS in the GSE78220 cohort. (H) Rate of clinical response (complete response (CR)/ partial response (PR) and stable disease (SD)/progressive disease (PD)) to anti-PD-1 immunotherapy in high or low ICPS groups in the GSE78220 cohort. (I) Rate of clinical response to anti-PD-1 immunotherapy in high or low ICPS groups in the GSE78220 cohort. (J, K) Distribution of ICPS in groups with different anti-PD-1 clinical response statuses. (L) ROC curve measuring the predictive value of the ICPS.
Figure 8
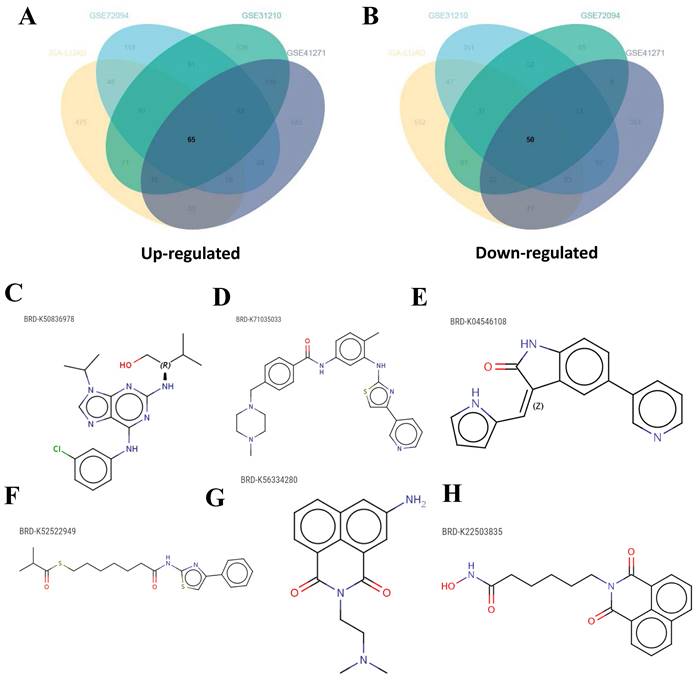
Candidate drugs targeting ICPS identification. (A, B) DEGs identification among ICPS-risk groups. (C-H) The top six drugs that could potentially be used to treat LUAD.
To account for batch effects and errors among multiple platforms, we only considered pairwise comparisons of immune cell infiltration levels within the cohort based on immune cell pairs. Based on the total of 276 immune cell pairs, the ICPS was established using 24 different types of immune cell pairs. We found that the patients with low ICPS showed better OS compared to those with high ICPS. These results demonstrated that the ICPS system was a valuable prognostic indicator for LUAD. What's more, we investigated the correlation between ICPS and immunotherapy. We observed that patients with high ICPS in LUAD had elevated TMB in comparison to those with low ICPS. It has been previously reported that TMB is linked to improved clinical response to single immunotherapy in certain solid tumors, with patients having high TMB exhibiting significantly better response compared to those with low TMB [49, 50].
A variety of immune cells are involved in tumor progression and immune regulation, such as regulatory T cells (Tregs), regulatory macrophages (Mregs), NK cells, tolerogenic dendritic cells (tolDCs), and regulatory B cells. Previous studies have shown that immune cells can affect the prognosis and immunotherapy efficacy of cancer patients, including LUAD [51]. Patients with ICPS high-risk scores have more various chemokines, including CCL3, CCL4, CXCL9, and CXCL10, which means that tumors in the body will recruit more CD8+ cells [51-53]. CD8+ cells are often considered to have anti-tumor effects, but in our study, we found that patients in the high-ICPS risk score group had higher levels of CD8+ T cell infiltration, which is inconsistent with previous prognoses and has piqued our interest [54]. In the analysis of immune checkpoint correlation, we found a significant correlation between LAG3 and ICPS, which may explain this phenomenon. LAG3 as the third immune checkpoint is often associated with poorer prognosis and less immunotherapy benefit at higher levels. Although there is an increase in CD8+ T cells in the high-ICPS patient group, there is also increased expression of LAG3 leading to increased tumor immune suppression [55, 56]. Previous studies have confirmed that melanoma patients with LAG3+CD8+ immunotype have worse prognosis after immunotherapy. Therefore, it may be easier for patients in the high-ICPS group to benefit from LAG3+ checkpoint inhibitors and further exploration can be conducted in this direction [57]. At the same time, patients in the high-level ICPS group have lower ESTIMATE scores indicating higher tumor purity and poorer prognosis [58].
We evaluated the predictive ability of ICPS on immunotherapy responses using anti-PD-L1 and anti-PD-1 immunotherapy. In IMvigor210, the patients with ICPS low-risk had longer survival. Notably, patients classified as ICPS-high risk were more likely to benefit from anti-PD-L1 treatment, suggesting that ICPS could serve as a predictive biomarker for anti-PD-L1 immunotherapy benefits. Similarly, in GSE78220, patients in the ICPS-low-risk set demonstrated better survival when compared to the ICPS-high-risk set. Furthermore, the ICPS-low-risk group exhibited a better response to anti-PD-1 immunotherapy in comparison to the ICPS-high-risk group, indicating that ICPS may also serve as a viable prediction tool for assessing the benefits of anti-PD-1 therapy. In the PD-L1 treatment group, the high-risk group was more likely to benefit from immunotherapy and reach CR/PR. However, the higher risk group had a worse prognosis, which is consistent with the aforementioned conclusions. This suggests that PD-L1 therapy does not fully improve patient outcomes in the high-risk ICPS group. Moreover, considering the significant differences in LAG3 among patients in different groups of ICPS, it may be that ICPS is more meaningful in predicting patients' recovery from LAG3 inhibitor therapy. However, due to the lack of publicly available datasets on immunotherapy for LUAD, we were unable to verify the predictive ability of ICPS in this context. Therefore, our future research will focus on collecting samples to further study and validate this potential.
In malignant tumors, the presence of a distinct subset of tumor cells exhibiting self-renewal and differentiation capabilities has been confirmed by researchers. These cells, characterized by stemness properties, are referred to as cancer stem cells (CSCs) [59]. In primary tumors, undifferentiated CSCs are more likely to disseminate and invade compared to normal tumor cells, thereby contributing to cancer progression and poor prognosis among patients [60]. Moreover, CSCs also play a critical role in tumor drug resistance [61, 62]. Stemness classification can be utilized by researchers to identify novel molecular markers that can guide clinical tumor treatment and prognosis assessment [63]. Various models based on mRNAsi have demonstrated the potential of stemness scores as powerful indicators for predicting tumor prognostic and treatment response [64, 65]. We observed that patients with ICPS low-risk exhibited lower mRNAsi scores, mDNAsi, EREG-mDNAsi, DMPsi, and ENHsi in this study. These findings suggest that the ICPS high-risk group possessed a higher degree of tumor stemness, with a tendency toward poorly differentiated and more malignant tumor tissues.
DNA can undergo various types of damage as a result of endogenous and exogenous factors. Among these, DNA double-strand break (DSB) damage is the most cytotoxic [66]. Under normal circumstances, the body maintains the integrity and stability of the genome by utilizing repair pathways, with homologous recombination (HR) being one of the repair methods for repairing DSBs [67]. Numerous studies have demonstrated the association between HR-related genes or proteins and tumor sensitivity to radiotherapy and drugs. As a novel biomarker, HRD plays a significant role in the individualized treatment of tumors [68]. In our study, we observed that patients in the ICPS low-risk group showed lower HRD scores and higher HRD expression in comparison to those in the ICPS high-risk group. These findings suggest that ICPS can reflect the level of HRD and may serve as a suitable tool for guiding tumor prognosis, as well as potentially guiding patients toward the use of PARPi (PARP inhibitor).
In addition to immunotherapy, drug therapy, particularly chemotherapy, remains a primary treatment strategy for LUAD. Therefore, our investigation also aimed to identify potential novel therapeutic candidates for LUAD. We identified six drugs, specifically BRD-K50836978 (purvalanol-a), BRD-K71035033 (masitinib), BRD-K04546108 (JAK3-inhibitor-VI), BRD-K52522949 (NCH-51), BRD-K56334280 (amonafide), and BRD-K22503835 (scriptaid). Further analysis revealed that these drugs may share common mechanisms of action, such as inhibition of histone deacetylase (HDAC) and cyclin-dependent kinase (CDK).
This research also has certain limitations. Despite efforts to collect and utilize multiple LUAD cohorts, we were unable to gather external data for verification, and no experiments have been done to confirm our conclusions. Moving forward, our next step involves collecting data from LUAD patients within our hospital and conducting validation studies on the ICPS in the near future. This is highly significant for predicting the future prognosis and treatment of LUAD patients, particularly in immunotherapy. It also offers insights for developing precise treatment plans.
Conclusion
In this study, we devised and validated an ICPS as a prognostic indicator for LUAD. This score holds potential as a valuable tool for identifying patients who are suitable candidates for immunotherapy. Our comprehensive assessment of immune cell interactions in LUAD contributes to a deeper understanding of infiltration patterns and functions, thereby guiding the development of more efficacious immunotherapy strategies.
Abbreviations
LUAD: Lung adenocarcinoma; TME: tumor microenvironment; ICP: immune cell pair; ICPS: immune cell pair score; TCGA: The Cancer Genome Atlas; GEO: gene expression omnibus; ImmuCellAI: Immune Cell Abundance Identifier; ICPI: immune cell pair index; ROC: receiver operating characteristic; SNV: single-nucleotide variant; TMB: tumor mutation burden; mRNAsi: transcriptomic signatures based-index; mDNAsi: DNA methylation based-index; EREG-mDNAsi: epigenetic regulation based-index; DMPsi: differentially methylated probes-based stemness index; ENHsi: enhancer-based stemness index; HRD: homologous recombination deficit; TIDE: T cell dysfunction and exclusion; ICS: immune checkpoints; ICD: immunogenic cell death; DEGs: differentially expressed genes; CMap: Connectivity map; Tcm: central memory T cell; Tem: effector memory T cell; Tr1: tregulatory1 cell; OS: overall survival; nTreg: natural Treg cell; MAIT: mucosal-associated invariant T cell; NK: natural killer cell; CAFs: cancer-associated fibroblasts; Tregs: regulatory T cells; Mregs: regulatory macrophages; tolDCs: tolerogenic dendritic cells; CSCs: cancer stem cells; DSB: DNA double-strand break; HDAC: inhibition of histone deacetylase; CDK: cyclin-dependent kinase.
Supplementary Material
Supplementary figures and tables.
Acknowledgements
Availability of data and materials
All databases generated/analyzed for this study are included/have their accession numbers included in the article.
Author contributions
JC. Z., TR. K., and J. Y. conceived and designed the study. JC. Z., and TR. K. performed the analysis procedures. J.C. Z. analyzed the results. TR. K., and KS. D. contributed analysis tools. JC. Z., and TR. K. contributed to the writing of the manuscript. J.Y., and WX.W. completed the review and supervision of this article. All authors have reviewed the manuscript.
Competing Interests
The authors have declared that no competing interest exists.
References
1. Liu J, Ren L, Li S, Li W, Zheng X, Yang Y. et al. The biology, function, and applications of exosomes in cancer. Acta pharmaceutica Sinica B. 2021;11:2783-97
2. Wei S, Zhang ZY, Fu SL, Xie JG, Liu XS, Xu YJ. et al. Hsa-miR-623 suppresses tumor progression in human lung adenocarcinoma. Cell death & disease. 2017;8:e2829
3. Song C, Guo Z, Yu D, Wang Y, Wang Q, Dong Z. et al. A Prognostic Nomogram Combining Immune-Related Gene Signature and Clinical Factors Predicts Survival in Patients With Lung Adenocarcinoma. Frontiers in oncology. 2020;10:1300
4. Vitale I, Manic G, Coussens LM, Kroemer G, Galluzzi L. Macrophages and Metabolism in the Tumor Microenvironment. Cell metabolism. 2019;30:36-50
5. Wong KY, Cheung AH, Chen B, Chan WN, Yu J, Lo KW. et al. Cancer-associated fibroblasts in nonsmall cell lung cancer: From molecular mechanisms to clinical implications. International journal of cancer. 2022;151:1195-215
6. Zeltz C, Primac I, Erusappan P, Alam J, Noel A, Gullberg D. Cancer-associated fibroblasts in desmoplastic tumors: emerging role of integrins. Seminars in cancer biology. 2020;62:166-81
7. Zhang C, Tang B, Hu J, Fang X, Bian H, Han J. et al. Neutrophils correlate with hypoxia microenvironment and promote progression of non-small-cell lung cancer. Bioengineered. 2021;12:8872-84
8. Bejarano L, Jordāo MJC, Joyce JA. Therapeutic Targeting of the Tumor Microenvironment. Cancer discovery. 2021;11:933-59
9. Balar AV, Galsky MD, Rosenberg JE, Powles T, Petrylak DP, Bellmunt J. et al. Atezolizumab as first-line treatment in cisplatin-ineligible patients with locally advanced and metastatic urothelial carcinoma: a single-arm, multicentre, phase 2 trial. Lancet (London, England). 2017;389:67-76
10. Hugo W, Zaretsky JM, Sun L, Song C, Moreno BH, Hu-Lieskovan S. et al. Genomic and Transcriptomic Features of Response to Anti-PD-1 Therapy in Metastatic Melanoma. Cell. 2016;165:35-44
11. Takeuchi T, Tomida S, Yatabe Y, Kosaka T, Osada H, Yanagisawa K. et al. Expression profile-defined classification of lung adenocarcinoma shows close relationship with underlying major genetic changes and clinicopathologic behaviors. Journal of clinical oncology: official journal of the American Society of Clinical Oncology. 2006;24:1679-88
12. Matsuyama Y, Suzuki M, Arima C, Huang QM, Tomida S, Takeuchi T. et al. Proteasomal non-catalytic subunit PSMD2 as a potential therapeutic target in association with various clinicopathologic features in lung adenocarcinomas. Molecular carcinogenesis. 2011;50:301-9
13. Zhu CQ, Ding K, Strumpf D, Weir BA, Meyerson M, Pennell N. et al. Prognostic and predictive gene signature for adjuvant chemotherapy in resected non-small-cell lung cancer. Journal of clinical oncology: official journal of the American Society of Clinical Oncology. 2010;28:4417-24
14. Hou J, Aerts J, den Hamer B, van Ijcken W, den Bakker M, Riegman P. et al. Gene expression-based classification of non-small cell lung carcinomas and survival prediction. PloS one. 2010;5:e10312
15. Wilkerson MD, Yin X, Walter V, Zhao N, Cabanski CR, Hayward MC. et al. Differential pathogenesis of lung adenocarcinoma subtypes involving sequence mutations, copy number, chromosomal instability, and methylation. PloS one. 2012;7:e36530
16. Staaf J, Jönsson G, Jönsson M, Karlsson A, Isaksson S, Salomonsson A. et al. Relation between smoking history and gene expression profiles in lung adenocarcinomas. BMC medical genomics. 2012;5:22
17. Okayama H, Kohno T, Ishii Y, Shimada Y, Shiraishi K, Iwakawa R. et al. Identification of genes upregulated in ALK-positive and EGFR/KRAS/ALK-negative lung adenocarcinomas. Cancer research. 2012;72:100-11
18. Botling J, Edlund K, Lohr M, Hellwig B, Holmberg L, Lambe M. et al. Biomarker discovery in non-small cell lung cancer: integrating gene expression profiling, meta-analysis, and tissue microarray validation. Clinical cancer research: an official journal of the American Association for Cancer Research. 2013;19:194-204
19. Khadse A, Haakensen VD, Silwal-Pandit L, Hamfjord J, Micke P, Botling J. et al. Prognostic Significance of the Loss of Heterozygosity of KRAS in Early-Stage Lung Adenocarcinoma. Frontiers in oncology. 2022;12:873532
20. Girard L, Rodriguez-Canales J, Behrens C, Thompson DM, Botros IW, Tang H. et al. An Expression Signature as an Aid to the Histologic Classification of Non-Small Cell Lung Cancer. Clinical cancer research: an official journal of the American Association for Cancer Research. 2016;22:4880-9
21. Parra ER, Behrens C, Rodriguez-Canales J, Lin H, Mino B, Blando J. et al. Image Analysis-based Assessment of PD-L1 and Tumor-Associated Immune Cells Density Supports Distinct Intratumoral Microenvironment Groups in Non-small Cell Lung Carcinoma Patients. Clinical cancer research: an official journal of the American Association for Cancer Research. 2016;22:6278-89
22. Hight SK, Mootz A, Kollipara RK, McMillan E, Yenerall P, Otaki Y. et al. An in vivo functional genomics screen of nuclear receptors and their co-regulators identifies FOXA1 as an essential gene in lung tumorigenesis. Neoplasia (New York, NY). 2020;22:294-310
23. Der SD, Sykes J, Pintilie M, Zhu CQ, Strumpf D, Liu N. et al. Validation of a histology-independent prognostic gene signature for early-stage, non-small-cell lung cancer including stage IA patients. Journal of thoracic oncology: official publication of the International Association for the Study of Lung Cancer. 2014;9:59-64
24. Robles AI, Arai E, Mathé EA, Okayama H, Schetter AJ, Brown D. et al. An Integrated Prognostic Classifier for Stage I Lung Adenocarcinoma Based on mRNA, microRNA, and DNA Methylation Biomarkers. Journal of thoracic oncology: official publication of the International Association for the Study of Lung Cancer. 2015;10:1037-48
25. Shedden K, Taylor JM, Enkemann SA, Tsao MS, Yeatman TJ, Gerald WL. et al. Gene expression-based survival prediction in lung adenocarcinoma: a multi-site, blinded validation study. Nature medicine. 2008;14:822-7
26. Schabath MB, Welsh EA, Fulp WJ, Chen L, Teer JK, Thompson ZJ. et al. Differential association of STK11 and TP53 with KRAS mutation-associated gene expression, proliferation and immune surveillance in lung adenocarcinoma. Oncogene. 2016;35:3209-16
27. Miao YR, Zhang Q, Lei Q, Luo M, Xie GY, Wang H. et al. ImmuCellAI: A Unique Method for Comprehensive T-Cell Subsets Abundance Prediction and its Application in Cancer Immunotherapy. Advanced science (Weinheim, Baden-Wurttemberg, Germany). 2020;7:1902880
28. Miao YR, Xia M, Luo M, Luo T, Yang M, Guo AY. ImmuCellAI-mouse: a tool for comprehensive prediction of mouse immune cell abundance and immune microenvironment depiction. Bioinformatics (Oxford, England). 2022;38:785-91
29. Simon N, Friedman J, Hastie T, Tibshirani R. Regularization Paths for Cox's Proportional Hazards Model via Coordinate Descent. Journal of statistical software. 2011;39:1-13
30. Heagerty PJ, Lumley T, Pepe MS. Time-dependent ROC curves for censored survival data and a diagnostic marker. Biometrics. 2000;56:337-44
31. Mayakonda A, Lin DC, Assenov Y, Plass C, Koeffler HP. Maftools: efficient and comprehensive analysis of somatic variants in cancer. Genome research. 2018;28:1747-56
32. Addeo A, Friedlaender A, Banna GL, Weiss GJ. TMB or not TMB as a biomarker: That is the question. Critical reviews in oncology/hematology. 2021;163:103374
33. Li T, Fan J, Wang B, Traugh N, Chen Q, Liu JS. et al. TIMER: A Web Server for Comprehensive Analysis of Tumor-Infiltrating Immune Cells. Cancer research. 2017;77:e108-e10
34. Li B, Severson E, Pignon JC, Zhao H, Li T, Novak J. et al. Comprehensive analyses of tumor immunity: implications for cancer immunotherapy. Genome biology. 2016;17:174
35. Racle J, de Jonge K, Baumgaertner P, Speiser DE, Gfeller D. Simultaneous enumeration of cancer and immune cell types from bulk tumor gene expression data. eLife. 2017 6
36. Newman AM, Liu CL, Green MR, Gentles AJ, Feng W, Xu Y. et al. Robust enumeration of cell subsets from tissue expression profiles. Nature methods. 2015;12:453-7
37. Becht E, Giraldo NA, Lacroix L, Buttard B, Elarouci N, Petitprez F. et al. Estimating the population abundance of tissue-infiltrating immune and stromal cell populations using gene expression. Genome biology. 2016;17:218
38. Fu J, Li K, Zhang W, Wan C, Zhang J, Jiang P. et al. Large-scale public data reuse to model immunotherapy response and resistance. Genome medicine. 2020;12:21
39. Jiang P, Gu S, Pan D, Fu J, Sahu A, Hu X. et al. Signatures of T cell dysfunction and exclusion predict cancer immunotherapy response. Nature medicine. 2018;24:1550-8
40. Ma Y, Yang J, Ji T, Wen F. Identification of a novel m5C/m6A-related gene signature for predicting prognosis and immunotherapy efficacy in lung adenocarcinoma. Frontiers in genetics. 2022;13:990623
41. Dong L, Fu L, Zhu T, Wu Y, Li Z, Ding J. et al. A five-collagen-based risk model in lung adenocarcinoma: prognostic significance and immune landscape. Frontiers in oncology. 2023;13:1180723
42. Sun S, Yang Y, Yang Z, Wang J, Li R, Tian H. et al. Ferroptosis Characterization in Lung Adenocarcinomas Reveals Prognostic Signature With Immunotherapeutic Implication. Frontiers in cell and developmental biology. 2021;9:743724
43. Vansteenkiste J, Wauters E, Reymen B, Ackermann CJ, Peters S, De Ruysscher D. Current status of immune checkpoint inhibition in early-stage NSCLC. Annals of oncology: official journal of the European Society for Medical Oncology. 2019;30:1244-53
44. Toki MI, Mani N, Smithy JW, Liu Y, Altan M, Wasserman B. et al. Immune Marker Profiling and Programmed Death Ligand 1 Expression Across NSCLC Mutations. Journal of thoracic oncology: official publication of the International Association for the Study of Lung Cancer. 2018;13:1884-96
45. Binnewies M, Roberts EW, Kersten K, Chan V, Fearon DF, Merad M. et al. Understanding the tumor immune microenvironment (TIME) for effective therapy. Nature medicine. 2018;24:541-50
46. Wu TD, Madireddi S, de Almeida PE, Banchereau R, Chen YJ, Chitre AS. et al. Peripheral T cell expansion predicts tumour infiltration and clinical response. Nature. 2020;579:274-8
47. Jamal-Hanjani M, Quezada SA, Larkin J, Swanton C. Translational implications of tumor heterogeneity. Clinical cancer research: an official journal of the American Association for Cancer Research. 2015;21:1258-66
48. Wu F, Fan J, He Y, Xiong A, Yu J, Li Y. et al. Single-cell profiling of tumor heterogeneity and the microenvironment in advanced non-small cell lung cancer. Nature communications. 2021;12:2540
49. Hellmann MD, Callahan MK, Awad MM, Calvo E, Ascierto PA, Atmaca A. et al. Tumor Mutational Burden and Efficacy of Nivolumab Monotherapy and in Combination with Ipilimumab in Small-Cell Lung Cancer. Cancer cell. 2018;33:853-61.e4
50. Wang F, Wei XL, Wang FH, Xu N, Shen L, Dai GH. et al. Safety, efficacy and tumor mutational burden as a biomarker of overall survival benefit in chemo-refractory gastric cancer treated with toripalimab, a PD-1 antibody in phase Ib/II clinical trial NCT02915432. Annals of oncology: official journal of the European Society for Medical Oncology. 2019;30:1479-86
51. Gajewski TF, Schreiber H, Fu YX. Innate and adaptive immune cells in the tumor microenvironment. Nature immunology. 2013;14:1014-22
52. Reschke R, Gajewski TF. CXCL9 and CXCL10 bring the heat to tumors. Science immunology. 2022;7:eabq6509
53. Hoch T, Schulz D, Eling N, Gómez JM, Levesque MP, Bodenmiller B. Multiplexed imaging mass cytometry of the chemokine milieus in melanoma characterizes features of the response to immunotherapy. Science immunology. 2022;7:eabk1692
54. St Paul M, Ohashi PS. The Roles of CD8(+) T Cell Subsets in Antitumor Immunity. Trends in cell biology. 2020;30:695-704
55. Andrews LP, Cillo AR, Karapetyan L, Kirkwood JM, Workman CJ, Vignali DAA. Molecular Pathways and Mechanisms of LAG3 in Cancer Therapy. Clinical cancer research: an official journal of the American Association for Cancer Research. 2022;28:5030-9
56. Aggarwal V, Workman CJ, Vignali DAA. LAG-3 as the third checkpoint inhibitor. Nature immunology. 2023;24:1415-22
57. Woo SR, Turnis ME, Goldberg MV, Bankoti J, Selby M, Nirschl CJ. et al. Immune inhibitory molecules LAG-3 and PD-1 synergistically regulate T-cell function to promote tumoral immune escape. Cancer research. 2012;72:917-27
58. Yoshihara K, Shahmoradgoli M, Martínez E, Vegesna R, Kim H, Torres-Garcia W. et al. Inferring tumour purity and stromal and immune cell admixture from expression data. Nature communications. 2013;4:2612
59. Khaledian B, Thibes L, Shimono Y. Adipocyte regulation of cancer stem cells. Cancer science. 2023
60. Clara JA, Monge C, Yang Y, Takebe N. Targeting signalling pathways and the immune microenvironment of cancer stem cells - a clinical update. Nature reviews Clinical oncology. 2020;17:204-32
61. Saygin C, Matei D, Majeti R, Reizes O, Lathia JD. Targeting Cancer Stemness in the Clinic: From Hype to Hope. Cell stem cell. 2019;24:25-40
62. Shibue T, Weinberg RA. EMT, CSCs, and drug resistance: the mechanistic link and clinical implications. Nature reviews Clinical oncology. 2017;14:611-29
63. Malta TM, Sokolov A, Gentles AJ, Burzykowski T, Poisson L, Weinstein JN. et al. Machine Learning Identifies Stemness Features Associated with Oncogenic Dedifferentiation. Cell. 2018;173:338-54.e15
64. Wei R, Quan J, Li S, Liu H, Guan X, Jiang Z. et al. Integrative Analysis of Biomarkers Through Machine Learning Identifies Stemness Features in Colorectal Cancer. Frontiers in cell and developmental biology. 2021;9:724860
65. Zhang Y, Tseng JT, Lien IC, Li F, Wu W, Li H. mRNAsi Index: Machine Learning in Mining Lung Adenocarcinoma Stem Cell Biomarkers. Genes. 2020 11
66. Wright WD, Shah SS, Heyer WD. Homologous recombination and the repair of DNA double-strand breaks. The Journal of biological chemistry. 2018;293:10524-35
67. Li J, Sun H, Huang Y, Wang Y, Liu Y, Chen X. Pathways and assays for DNA double-strand break repair by homologous recombination. Acta biochimica et biophysica Sinica. 2019;51:879-89
68. Hodgson DR, Dougherty BA, Lai Z, Fielding A, Grinsted L, Spencer S. et al. Candidate biomarkers of PARP inhibitor sensitivity in ovarian cancer beyond the BRCA genes. British journal of cancer. 2018;119:1401-9
Author contact
![]() Corresponding authors: Jia Yu (yogaqq116edu.cn), Weixing Wang (sate.llitecom).
Corresponding authors: Jia Yu (yogaqq116edu.cn), Weixing Wang (sate.llitecom).
Citation styles
APA
Zhang, J., Kuang, T., Dong, K., Yu, J., Wang, W. (2024). Leveraging an immune cell signature to improve the survival and immunotherapy response of lung adenocarcinoma. Journal of Cancer, 15(3), 747-763. https://doi.org/10.7150/jca.90515.
ACS
Zhang, J.; Kuang, T.; Dong, K.; Yu, J.; Wang, W. Leveraging an immune cell signature to improve the survival and immunotherapy response of lung adenocarcinoma. J. Cancer 2024, 15 (3), 747-763. DOI: 10.7150/jca.90515.
NLM
Zhang J, Kuang T, Dong K, Yu J, Wang W. Leveraging an immune cell signature to improve the survival and immunotherapy response of lung adenocarcinoma. J Cancer 2024; 15(3):747-763. doi:10.7150/jca.90515. https://www.jcancer.org/v15p0747.htm
CSE
Zhang J, Kuang T, Dong K, Yu J, Wang W. 2024. Leveraging an immune cell signature to improve the survival and immunotherapy response of lung adenocarcinoma. J Cancer. 15(3):747-763.
This is an open access article distributed under the terms of the Creative Commons Attribution License (https://creativecommons.org/licenses/by/4.0/). See http://ivyspring.com/terms for full terms and conditions.