Journal of Cancer
ISSN: 1837-9664
3.2
Impact Factor
ISSN: 1837-9664

 Global reach, higher impact
J Cancer 2024; 15(6):1536-1550. doi:10.7150/jca.89526 This issue Cite
Research Paper
Integrated Bioinformatics and Experimental Analysis of Long Noncoding RNA Associated-ceRNA as Prognostic Biomarkers in Advanced Stomach Adenocarcinoma
Yixin Chen1#, Xin Gao1#, Xinyang Dai1, Yuwei Xia1, Xinran Zhang1, Leitao Sun2,3,4 ![]() , Ying Zhu2
, Ying Zhu2 ![]()
1. The First Affiliated Hospital of Zhejiang Chinese Medical University (Zhejiang Provincial Hospital of Chinese Medicine), Hangzhou 310006, China.
2. Department of Medical Oncology, The First Affiliated Hospital of Zhejiang Chinese Medical University (Zhejiang Provincial Hospital of Chinese Medicine), Hangzhou 310006, China.
3. Academy of Chinese Medical Science, Zhejiang Chinese Medical University, Hangzhou 310053, China.
4. Key Laboratory of Neuropharmacology and Translational Medicine of Zhejiang Province, School of Pharmaceutical Sciences, Zhejiang Chinese Medical University, Hangzhou 310053, China.
# Yixin Chen and Xin Gao contributed equally to this work.
Received 2023-8-26; Accepted 2024-1-10; Published 2024-1-21
Citation:
Chen Y, Gao X, Dai X, Xia Y, Zhang X, Sun L, Zhu Y. Integrated Bioinformatics and Experimental Analysis of Long Noncoding RNA Associated-ceRNA as Prognostic Biomarkers in Advanced Stomach Adenocarcinoma. J Cancer 2024; 15(6):1536-1550. doi:10.7150/jca.89526. https://www.jcancer.org/v15p1536.htm
Other stylesAbstract

Background: Advanced stomach adenocarcinoma (ASTAD) is a highly malignant and prognostically poor stage of gastric cancer. Recently, long noncoding RNA (lncRNA) was found to play a crucial role, including as competing endogenous RNA (ceRNA) in cancer. However, studies on large-scale sample in ASTAD are still lacking, thus we constructed the ceRNA network of ASTAD to explore its molecular mechanism.
Methods: We compared the expression of mRNAs, lncRNAs and miRNAs between ASTAD and normal tissues utilizing RNA-Seq and miRNA-seq Data from The Cancer Genome Atlas (TCGA). GO and KEGG enrichment analysis were executed for annotating the functions of differentially expressed mRNAs. Subsequently, we investigated the expression correlations between the differentially expressed lncRNAs and their respective mRNAs by constructing a ceRNA network. Kaplan-Meier survival analysis was used to assess the relationship between high/low risk scores based on this network with patient prognosis in TCGA training cohort and GSE15459 validation cohort. In vitro functional assays were employed to verify the cancer-promoting effects of key lncRNAs in the ceRNA network and their possible mechanisms.
Results: In ASTAD tissues, a total of 176 lncRNAs, 124 miRNAs, and 2205 mRNAs were identified as differentially expressed. Our constructed ceRNA network consisted 6 differentially expressed lncRNAs (PVT1, MAGI2-AS3, KCNQ1OT1, LINC02086, AC125807.2 and LINC02535), 25 miRNAs and 130 mRNAs, and the risk score derived from these lincRNAs could predict ASTAD patient outcomes. Key lncRNA LINC02086 was experimentally verified to enhance proliferation and migration of gastric cancer cells by competitively binding to miR-93a-5p with MMP3.
Conclusion: Our comprehensive ceRNA network for ASTAD provides valuable insights into its molecular mechanisms, and LINC02086 may be used as an innovative target for clinical treatment.
Keywords: ASTAD, ceRNA network, TCGA, molecular mechanisms
Introduction
In terms of incidence and mortality, gastric cancer is among the top five malignant tumors globally[1], and it is the third leading cause of cancer-related deaths[2]. Stomach adenocarcinoma (STAD) is the main pathological type of gastric cancer (GC), with poor prognosis and limited treatment options[3]. Chemotherapy remains the primary treatment modality for patients with STAD at stage III or IV, aiming to increase patient survival time and improve quality of life are goals of treatment.
At present, fluorouracil combined with platinum is mostly used as the first-line chemotherapy of ASTAD, but the median Overall Survival (OS) is still difficult to break through 2 years, and the 5-year survival rate is less than 20%[4]. Molecular targeted therapy is an emerging treatment in recent years. The ToGA trial showed that the addition of trastuzumab to chemotherapy can increase the median OS to 16 months and the response rate to 47% in HER-2 positive patients[5]. However, the positive rate of HER-2 in STAD patients is only about 22%[6], limiting the potential benefit of trastuzumab to a small subset of patients. Moreover, STAD exhibits high heterogeneity, leading to unsuccessful outcomes in several other targeted drug therapy studies[7]. Although in recent years, immunotherapy has been as another treatment strategy for cancer, finding from the Keynote-062 study revealed that combining anti PD-L1 with chemotherapy didn't provide additional efficiency[8]. So, immunotherapy remains a challenge in the first-line treatment of ASTAD. In order to comprehend the molecular process of ASTAD and look for novel molecular targets, it is crucial to explore ASTAD biomarkers and use risk stratification and prognostic prediction using biomarkers to develop new and more effective treatment regimens.
Non-coding RNA is an increasing important direction of current molecular research, including types of miRNA, lncRNA and circRNA. For lncRNAs (longer than 200 nucleotides to 100 kb in length with little or no protein-coding potential), it can work as ceRNA, also known as RNA sponge by binding to miRNAs. In malignant tumor cells, ceRNAs can weaken miRNA inhibition on targeted mRNAs, playing a significant role in tumor occurrence, progression, metastasis, and even drug therapy[9].Differential expression of lncRNAs in tumors can help identify their competing mRNAs and enhance our understanding of their significance. For example, studies have shown that lncRNA HOXC-AS1 targets miR-99a-3p and upregulates MMP8 to promote gastric cancer[10], lncRNA ELFN1-AS1 upregulates TRIM29 by inhibiting miR-211-3p to accelerate the growth of GC,[11], and the interaction between lncRNA MIR100HG and hnRNPA2B1 contributes to colorectal cancer advancement. [12].
In tumors, different lncRNAs may compete for the same miRNA, and lncRNAs also share a certain number of miRNAs with mRNAs, thereby forming complex RNA regulatory networks that affect pathways and functions. While some studies have constructed lncRNA-associated ceRNA networks in GC,[13] it is urgent to build a ceRNA network specific to ASTAD, select key lincRNA, verify their molecular biological functions and ceRNA mechanism of action, and apply them in treatment decision-making, prognosis prediction and targeted therapy of advanced gastric adenocarcinoma.
Materials & Methods
Data collection
The clinical data on patient age, sex, and race were extracted from the STAD dataset in the TCGA database, from which we selected patients with TNM stage III or IV for further data analysis. The inclusion criteria were that: (i) the histological diagnosis was STAD; (ii) sufficient information for clinical characteristics (including age, gender, race, stage, survival status and survival time); and (iii) the AJCC pathologic stage were III or IV. In total, 186 ASTAD patients were included in this study and their clinical characteristics were summarized in Supplemental Table 1.
Explore the differentially expressed genes
The RNA sequencing (RNA‐Seq) and miRNA sequencing (miRNA‐Seq) data were derived from the TCGA data portal. In total, we analyzed data from 177 ASTAD tumor tissues and 9 adjacent normal tissues were available for RNA-seq, including lncRNA-Seq and mRNA-Seq. Additionally, miRNA-Seq information was available for 178 ASTAD tumor tissues and 7 adjacent normal tissues. To identify significantly differentially expressed mRNA (DEG), lncRNA (DELnc) and miRNA (DEM) between cancer tissues and normal tissues, we utilized the edgeR package in R software[14]. The cut‐off value was |log2FC| > 1 and FDR < 0.05 (FC, fold change; FDR, adjust p value).
Function and pathway enrichment
The gene ontology (GO) and Kyoto Encyclopedia of Genes and Genomes (KEGG) analysis were necessary to better understand the function of differentially expressed genes. GO enrichment analysis[15] was mainly used to annotate the genes and gene products, with terms classified into three categories: biological processes (BP), cellular composition (CC), and molecular function (MF). The KEGG[16] database contains information on genomes, biological pathways, diseases, and chemical compounds. Therefore, for differentially expressed RNA (DEG and DELnc), we used enrichGO and enrichKEGG packages in R for functional analysis. Next, the pathview packages in R was used to construct KEGG pathways.
Construct the competitive endogenous RNA network
The gdcCEAnalysis package in R was used to predict the interactions between lncRNA-miRNA and mRNA-miRNA. Statistically significant correlations were determined by performing correlation analysis with p < 0.05 and regsim correlation coefficient not equal to zero. We employed the Starbase database[17] online for verification and supplementation of miRNAs predicted to be targeted by the DElncs. And the mRNA-miRNA pairs were supplemented with miRTarBase[18] and TargetScan[19] databases. The resulting interactions were then utilized to construct the lncRNA‐miRNA‐mRNA network using Cytoscape (version 3.7.0)[20].
Correlation analysis and survival analysis
The correlation between lncRNAs and their corresponding mRNAs was analyzed using the gdcCorPlot package in R. To assess the prognostic relevance of competitive endogenous RNA, we integrated the clinical data from ASTAD patients. Based on the median expression value of each lncRNA in ASTAD patients, we used the gdcKMPlot package in R to draw KM survival curves to show the correlation between the expression level of each lncRNA in the ceRNA network and patients' prognosis.
CeRNA Network in relation to overall survival of the ASTAD patients
For the DElncRNAs in the ceRNA network, we conducted multivariate COX regression in SPSS 25.0. Subsequently, we calculated the prognostic risk score as: explncRNA1 * βlncRNA1+ explncRNA2 * βlncRNA2 + explncRNAn * βlncRNAn (exp, expression level; β, the regression coefficient derived from the multivariate Cox regression model) [21]. The TCGA-ASTAD data was used as the training cohort. Additionally, we selected the GSE15459 dataset from GEO database and screened data of patients at stages 3-4 to serve as an external validation cohort. The risk scores of the two cohorts were calculated, then the high-risk group and the low-risk group were respectively divided accordingly in each cohort. The overall survival rates of the high-risk and low-risk groups ware compared by KM analysis using "ggsurvplot" package. Furthermore, time-dependent ROC curves were generated using the "survivalROC" package with a focus on predicting 1-, 2-, and 3-year survival in ASTAD patients based on the "NNE" method[22].
Cell culture
The human gastric cancer cell lines MKN-1, HGC-27, NUGC-3, NUGC-4, human normal gastric epithelial cell GES-1 and human embryonic kidney (HEK) 293T cell were obtained from Key Laboratory of Prevention, Diagnosis and Therapy of Upper Gastrointestinal Cancer of Zhejiang Province. The STR fingerprint authentications can be provided upon request. The above cell lines were cultured in Roswell Park Memorial Institute (RPMI) 1640 (BI, Israel) or Dulbecco's modiffed Eagle's medium (DMEM; Cienry, China) medium supplemented with 10% fetal bovine serum (FBS, MEILUNCELL, China), and 1% penicillin and streptomycin in a 5% CO2 incubator (ThermoFisher, USA) at 37℃ humidified environment.
RNA interference
Small interfering RNAs (siRNA) directed against LINC02086 and negative control (siNC) were synthesized by Zhejiang Sunya Company (Hangzhou, China). Transient transfection was performed by Polyplus jetPRIME kit (France) on NUGC-3 cells following standard protocol. We harvested cells after 48 h for RT-qPCR examination and functional assays or after 72 h for Western Blot analysis. The siRNA sequences were generalized as flowing: si-LINC02086#1 sense: CCUUGGAGGUCUGAUGCAUUUTT; si-LINC02086#1 antisense: AAAUGCAUCAGACCUCCAAGGTT; si-LINC02086#2 sense: AAGGCUGGUCCUGUCUCUAUATT; si-LINC02086#2 antisense: UAUAGAGACAGGACCAGCCUUTT.
Cell proliferation assay and colony formation
Cell proliferation ability was assayed by Cell Counting Kit-8 (CCK-8, MedChemExpress, USA). NUGC-3(5× 10³ cells/well) were seeded in 96-well plates and incubated at 37 °C for one hour. Absorbance at 450 nm was measured daily for 4 consecutive days. For the colony formation assay, treated NUGC-3 cells (5× 10³ cells) of each group were inoculated in 6-cm dishes and incubated for at least one week. After washing with phosphate-buffered saline (PBS), the cells were fixed in methanol for 30 min and stained with 0.1% crystal violet solution for 30 min before analysis.
Cell cycle assay
The transfected NUGC-3 cells in each group were collected and fixed in 75% ethanol at - 20°C overnight. On the next day, after discarding the ethanol, the cells were washed once with PBS, resuspended with 500 μl DNA staining solution (Multiscience, China), and stained for 30 min at room temperature. Cell cycle assay was performed using flow cytometry (FACS LSRII, BD Bioscience, USA) and the results were analyzed using ModfitLT 5.
Edu assay
We used the 5-ethynyl-20-deoxyuridine (EdU) assay kit (Beyotime, Shanghai, China) to de-duplicate the cell proliferation ability. 1.2 × 10⁵ NUGC-3 cells from each group were inoculated into confocal plates and incubated with 10 μM EdU buffer at 37 °C for 2 h, then fixed with 4% formaldehyde for 30 min and permeabilized with 0.1% Triton X-100 for 30 min. The nuclei of the cells were stained with Hoechst staining after the addition of Click additive solution to the culture medium. Finally, the results were observed by fluorescence microscope.
Cell migration ability assay
Transwell assay was conducted using 24-well plates with 8-μm pore size transwell filter inserts (Corning, USA). A total of 1.2 × 10⁵ NUGC-3 cells were suspended using serum-free medium and added to the upper chamber. Medium containing 10% FBS was added to the lower chamber. After incubation in 37 °C for 24h, the cells on the underside of membrane were fixed and stained with Wright's-Giemsa stain (Nanjing Jiancheng, China) and further photographed.
For the wound healing experiment, the 2-well Culture-Insert (Ibidi, Germany) was pre-inserted in a 12-well plate. Then, treated cells were inoculated into each compartment at a density of 0.7 million cells and incubated at 37°C for 24h. The culture inserts were removed for scratch formation, and then the cells were photographed and continued to be cultured in ≤ 1% FBS medium to allow them to migrate and gradually close the wounds, and photographed under the microscope every 24h.
Total RNA extraction and RT-qPCR
Total RNA was isolated from GC cell lines using FastPure Cell/Tissue Total RNA Isolation Kit (Vazyme Biotech, Nanjing, China). Subsequently, 1ug of RNA underwent reverse transcription into cDNA using the HiScript II Q RT SuperMix (Vazyme Biotech, Nanjing, China). The fluorescence-based SYBR Green (Vazyme Biotech, Nanjing, China), detected on the ABI QuantStudio 5 Real-Time system (Applied Biosystems, USA). The relative RNA amount was calculated using the 2-ΔΔCt method, normalized to β-actin.
All premiers were derived from Tsingke Biological Technology (Beijing, China) and were displayed as following: β-actin, F: 5'-CATCCACGAAACTACCTTCAACTCC-3', R: 5'-GAGCCGCCGATCCACACG-3'; LINC02086, F: 5'-CTGTTACAGCAGAACCGAAGATTT-3', R: 5'-GGCAAATGAAATCCCAGACAG-3'; LINC02535, F: 5'-CAGGCTTTGTATCTTCAGTTGCTT-3', R: 5'-GGTTGAGGTGGAATCGAGTGTT-3'.
Western blotting
Total protein was extracted using RIPA buffer (Fdbio science, Hangzhou, China) containing 1% protease and phosphatase inhibitors (Bimake, USA). Protein quantification was performed using BCA Protein Assay Kit (Fdbio science, Hangzhou, China). Protein samples of 40ug from each group were separated by 4-20% SDS-PAGE (GenScript, Nanjing, China) and then transferred to 0.22 μm PVDF membranes (Millipore, USA). Following a 2-hour blocking step in 3% Bovine Serum Albumin (BSA) at room temperature, the membranes were incubated overnight at 4℃ with primary antibodies including anti‐β-actin (1:5000; YM3028, Immunoway), anti-MMP3 (1:1000, ab52915, Abcam), anti‐E‐cadherin (1:500; YT1454, Immunoway), anti‐ZO-1 (1:500; YN1410, Immunoway), anti-N-cadherin (1:500, YT2988, Immunoway), anti-β-Catenin (1:1000, YM3403, Immunoway), anti-Snail (1:500, YT4351, Immunoway) and anti-Vimentin (1:500, YT4880, Immunoway). The next day, the membranes was washed 3 times with TBST and incubated with HRP-secondary antibody for 2 hours at room temperature. Immunoblots were detected with an imaging system (Bio-Rad, USA) and an enhanced chemiluminescence detection kit (Fdbio science, Hangzhou, China). GAPDH was selected as a loading control.
Dual luciferase reporter assay
The wild-type (WT) or mutant-type (MUT) sequences of LINC02086 and 3' UTR of MMP3 were cloned into the pmirGLO plasmid (REPOBIO, Hangzhou, China). The miR-93-5p mimics and corresponding negative control were synthesized by RiboBio (Guangzhou, China). The interaction between miR-93-5p and its putative binding sites was tested by the Dual Luciferase Reporter Assay Kit (Vazyme Biotech, Nanjing, China). Briefly, HEK293T cells or NUGC-3 cells were seeded in a 24-well plate and co-transfected with 300 ng of the luciferase reporter constructs (pmirGLO plasmid) and miR-93-5p mimics (20uM), or with si-LINC02086 (20uM) or overexpressed LINC02086 plasmid (300ng) using Polyplus jetPRIME kit. After 48 h, cells were lysed, incubated with firefly and Renilla luciferase substrates, and measured for enzyme activity using a luminometer. Firefly luciferase activity was normalized against Renilla luciferase to represent miRNA binding efficiency. Each group was conducted in triplicate.
Statistical analysis
Each experiment was repeated independently 2-3 times and the results were analyzed using GraphPad Prism 9.0. Measurement data were expressed as mean ± SD. One-way analysis of variance (ANOVA) or t-test was used to compare quantitative data, and nonparametric χ2 test was used to compare qualitative data. P-values for each analysis are marked on figures, and the level of statistical significance was defined to P < 0.05 (*P < 0.05; **P < 0.01; ***P < 0.001; ****P < 0.0001).
Above, research flow was shown in Figure 1.
Results
Clinical characteristics of advanced stomach adenocarcinoma patients
In the analyzed dataset, 186 ASTAD patients were enrolled in the study, with 148 (79.57%) at stage III and 38 (20.43%) at stage IV. Among them, 125 (67.20%) were aged ≤70 years while the remaining 61(32.80%) were over 70 years old, with a median age of 65.23 years old. Of these patients, there were more males (62.37%) than females (37.63%). The ethnic distribution was as follows: Asian-30 (16.13%), Black or African American-7 (3.76%), White-118 (63.44%), Native Hawaiian or other Pacific Islanders-1 (0.54%), and not reported-130 (16.13%). Only six patients had a duration of illness ≥ 5 years. The detail results were listed in Supplemental Table 1.
Differentially expressed lncRNA, miRNA and mRNA
The study investigated differentially expressed genes (DEG) and differentially expressed lncRNA (DELnc) in tumor tissues compared to normal tissues. |log2FC| > 1 and FDR < 0.05 were considered as discriminatively expressed. The analysis identified 2205 protein coding RNAs (1056 elevated and 1149 downregulated) and 176 lncRNA (121 elevated and 55 downregulated) (Figure 2A-B). Similarly, filtering analysis based on the above criteria identified 124 differential expression miRNAs (DEM), including 68 up-regulated and 56 down-regulated, between cancerous and normal tissues (Figure 2C-D). These findings suggested that the expression patterns of these genes can serve as distinguishing factors for ASTAD from normal tissues.
Figure 1
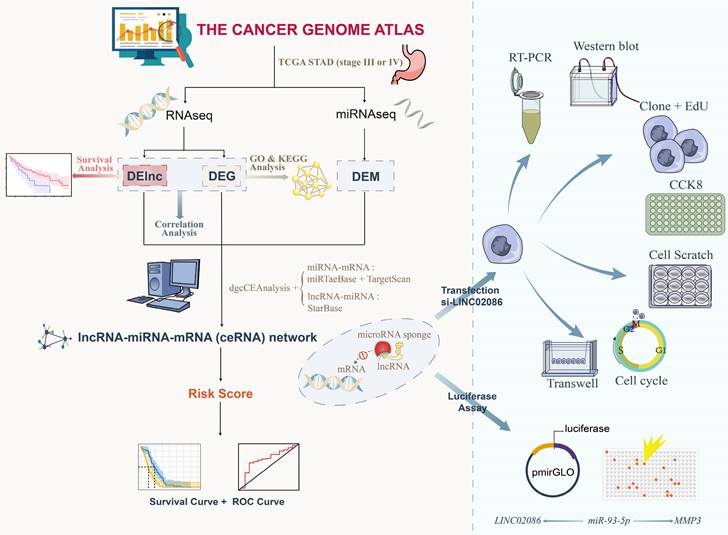
Flowchart for study.
Figure 2
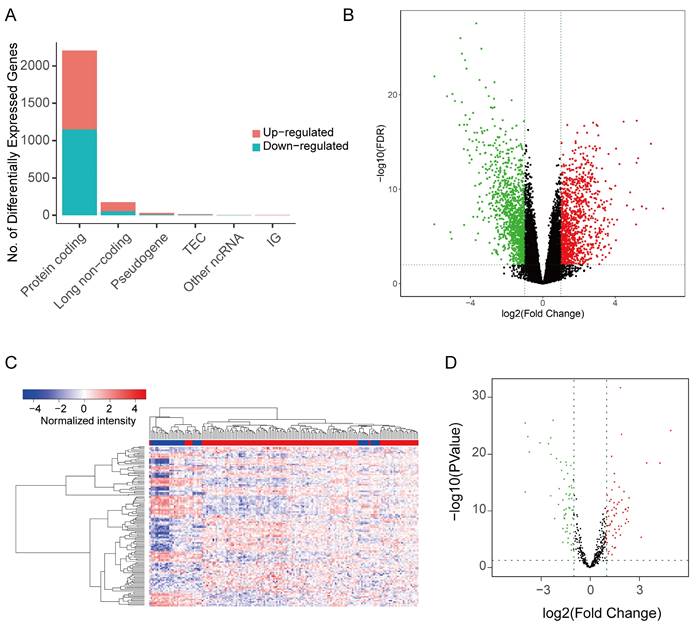
The DEG and DELnc between ASTAD tumor tissues and normal tissues was explored from TCGA database. (A-B) The analysis identified 2205 protein coding RNAs and 176 lncRNA (C-D) Filtering analysis identified 124 DEM between normal tissues and cancer tissues.
GO and KEGG enrichment analysis of DEG
The GO analysis revealed that most of the differentially expressed genes (DEGs) were involved in various biological processes, including extracellular matrix and structure organization, cell proliferation (sister chromatid segregation and nuclear division), and tissue development (cartilage, issue, renal system, etc.) (Figure 3A). Most of these biological processes occur in regions such as the extracellular matrix and chromosomes (Figure 3C). Accordingly, the molecular functions of DEGs mainly include in gene expression process such as transcription factor activity, cell proliferation process and RNA polymerase II proximal promoter sequence-specific DNA binding (Figure 3B). In KEGG enrichment analysis, the DEGs were predominantly associated with pathways like Cell cycle, Cytokine-Cytokine receptor interaction, Viral protein interaction with Cytokine and Cytokine receptor and other signaling pathways (Figure 3D), consistent with the findings from GO analysis. Notably, the cell cycle pathway had the most significant p-value (Supplemental Figure 1).
Competitive endogenous RNA network in Advanced stomach adenocarcinoma
The potential interactions among the DEG, DELnc and DEM were predicted based on the ceRNA hypothesis. Using the gdcCEAnalysis package in R and the supplementary prediction through the Starbase database, miRTarBase and TargetScan databases online, we generated a ceRNA network model consisting of 6 DELncs, 25 DEMs and 130 DEGs interacting with each other. Table 1 presents the mutual prediction results between LncRNA-miRNA and miRNA-mRNA.
Figure 3
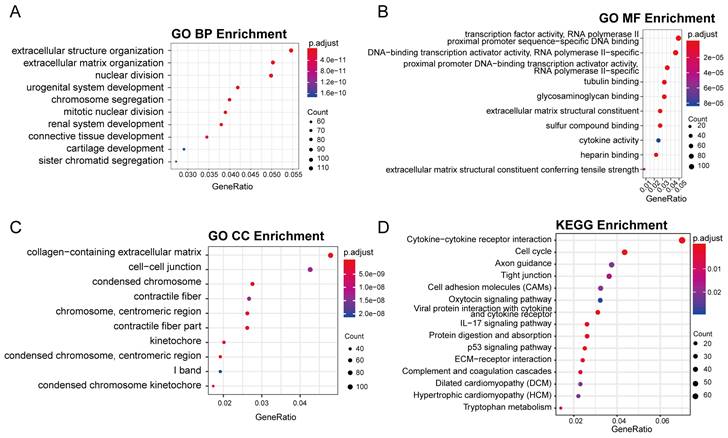
The result of GO and KEGG enrichment analysis of DEGs. (A) The first 10 items of biological process category sorted by p-value in the GO analysis. (B) The first 10 items of molecular function category sorted by p-value in the GO analysis. (C) The first 10 items of cellular component category sorted by p-value in the GO analysis. (D) The first 10 items of KEGG enrichment sorted by p-value.
Table 1
The mutual prediction results between LncRNA-miRNA and miRNA-mRNA from gdcCEAnalysis package in R and supplemented by Starbase database, miRTarBase and TargetScan databases online
| LncRNA | miRNA | mRNA |
|---|---|---|
| PVT1 | hsa-miR-93-5p | TNFRSF10B, SUSD1, MCM7, KAT2B, SLC2A4, E2F1, ZBTB4, CDKN1A, CXCL8, MMP3, FOXA1 |
| PVT1 | hsa-miR-106a-5p | TNFRSF10B, SUSD1 |
| PVT1 | hsa-miR-20a-5p | ILDR1, LAMP3, FHL1, DNMT1, RUNX1, TCEAL1, LIMK1, UBE2C, E2F1, KIT, RBL1, BCL2, CDKN1A, KIF26B, EGLN3, RGS5, BAMBI, PTPRO |
| PVT1 | hsa-miR-106b-5p | LAMP3 |
| MAGI2-AS3 | hsa-miR-374b-5p | ID4, PPP1R3C, VAMP2, TLE4, LPAR1, NTN1, NOVA1, CYBRD1, ADAMTSL3, DUSP19, RECK, DMD, MEIS1, NR3C1, NFIX, TTLL7, MYLK, SATB1, FGF13, AKAP2, TNS1, PDZD2, UST, ZCCHC24, LRCH2, ATP8B2, L1CAM, MKX, PCDH7 |
| MAGI2-AS3 | hsa-miR-374a-5p | ID4, PPP1R3C, VAMP2, TLE4, LPAR1, NTN1, NOVA1, CYBRD1, ADAMTSL3, DUSP19, RECK, DMD, MEIS1, NR3C1, NFIX, TTLL7, MYLK, SATB1, FGF13, AKAP2, TNS1, PDZD2, UST, ZCCHC24, LRCH2, ATP8B2, L1CAM, MKX, PCDH7 |
| KCNQ1OT1 | hsa-miR-7-5p | HELLS |
| KCNQ1OT1 | hsa-miR-140-5p | HELLS |
| KCNQ1OT1 | hsa-miR-24-3p | HELLS, EML4 |
| KCNQ1OT1 | hsa-miR-29c-3p | MYBL2, EML4, COL5A2, C1QTNF6, SLC12A8, BMP1, MEST, LOXL2, PDGFRB, F11R, ADAMTS7, COL7A1, TMPRSS3, ITGA11, DIO2 |
| KCNQ1OT1 | hsa-miR-29b-3p | MYBL2, EML4, COL5A2, C1QTNF6, SLC12A8, BMP1, MEST, LOXL2, PDGFRB, F11R, ADAMTS7, COL7A1, TMPRSS3, ITGA11, DIO2 |
| KCNQ1OT1 | hsa-miR-29a-3p | MYBL2, EML4, COL5A2, C1QTNF6, SLC12A8, BMP1, MEST, LOXL2, PDGFRB, F11R, ADAMTS7, COL7A1, TMPRSS3, ITGA11, DIO2 |
| KCNQ1OT1 | hsa-miR-338-3p | EML4 |
| KCNQ1OT1 | hsa-miR-145-5p | EML4 |
| KCNQ1OT1 | hsa-miR-183-5p | EML4 |
| KCNQ1OT1 | hsa-miR-148b-3p | VAV2, ITGA11 |
| KCNQ1OT1 | hsa-miR-152-3p | VAV2, ITGA11 |
| KCNQ1OT1 | hsa-miR-148a-3p | VAV2, ITGA11 |
| KCNQ1OT1 | hsa-miR-335-5p | VAV2 |
| LINC02086 | hsa-miR-143-3p | LIMK1, COL3A1, HNF4A, GABARAPL1, BCL2, BAG3, MACC1, MMP9, SERPINE1, HK2, TLR2, KLF5 |
| LINC02086 | hsa-miR-93-5p | TNFRSF10B, SUSD1, MCM7, KAT2B, SLC2A4, E2F1, ZBTB4, CDKN1A, CXCL8, MMP3, FOXA1 |
| LINC02086 | hsa-miR-17-5p | SLC16A9, KAT2B, DNMT1, RUNX1, BRCA2, TCEAL1, UBE2C, E2F1, TNFSF12, RBL1, ZBTB4, BCL2, CDKN1A, VLDLR, IGFBP3, NPAS3, CLU, TIMP3, PTPRO |
| LINC02086 | hsa-miR-20a-5p | ILDR1, LAMP3, FHL1, DNMT1, RUNX1, TCEAL1, LIMK1, UBE2C, E2F1, KIT, RBL1, BCL2, CDKN1A, KIF26B, EGLN3, RGS5, BAMBI, PTPRO |
| LINC02086 | hsa-miR-20b-5p | NCAPG, CCNB1, NCAPG2, BRCA1, CDKN1A, BAMBI |
| AC125807.2 | hsa-let-7c-5p | TNFRSF10B, CDC25A, HMGA2, IL6 |
| LINC02535 | hsa-miR-30a-5p | NCAM1, DNMT1, SOX4, DTL, KLF9, CCNE2, HNF4G, SKP2, LOX, BCL11A, CDH1, EYA2, IL21R |
Next, the interactions of these results were used to construct the ceRNA network utilizing the Cytoscape_v3.7.0 (Figure 4A). According to the ceRNA action model, both lncRNA and mRNA competitively bind to the same miRNA, leading to mRNA inhibition. Consequently, a positive expression correlation is expected between lncRNA and mRNA. Therefore, we performed expression correlation analysis for six lncRNAs and their respective competitive mRNAs within the aforementioned ceRNA network. The results displayed scatter plots illustrating each lncRNA's highest expression correlation coefficient with its corresponding mRNA (Figure 4B-G).
Figure 4
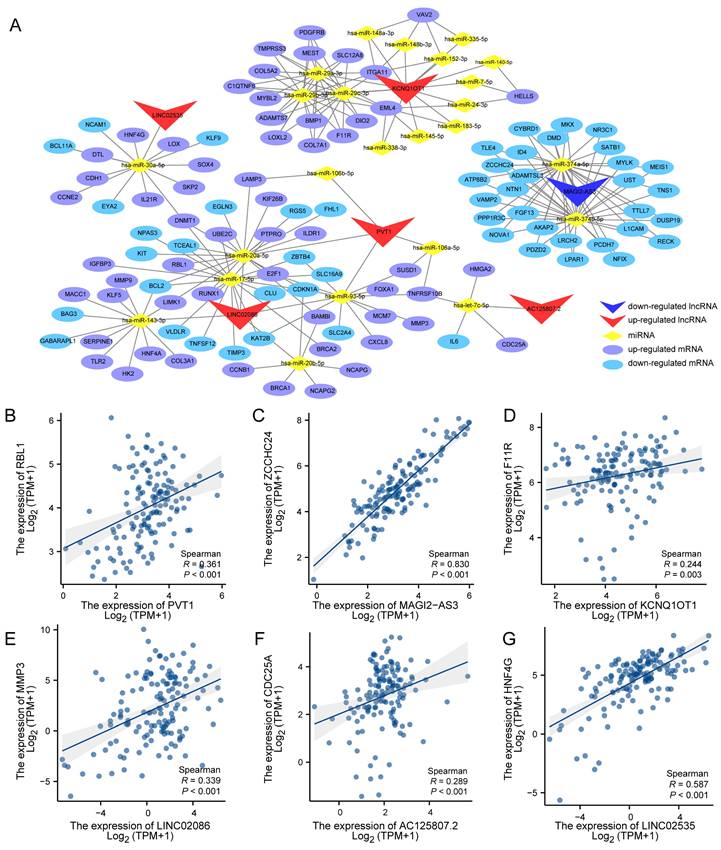
Competitive endogenous RNA network in Advanced stomach adenocarcinoma and correction analysis between DElnc and DEM. (A) The lncRNA-miRNA-mRNA (ceRNA) network model of ASTAD constructed containing 6 DELnc, 25 DEM and 130 DEG interacting with each other. (B-G) The correlation analysis between each LncRNA in the ceRNA network and its mRNA with the highest expression correlation coefficient.
Survival analysis
For the DElncs in the ceRNA network, we used the gdcKMPlot package in R for univariate KM analysis to estimate the effect of lncRNAs on overall survival in patients with ASTAD. Only 114 individuals with available survival time information were included in the analysis. The results of KM analysis revealed that out of these 6 lncRNAs, only three exhibited statistically significant survival curves: AC125807.2, LINC02086 and LINC02535 (Figure 5). The expression of AC125807.2 was positively correlated with OS of ASTAD patients, while LINC02086 and LINC02035 were negatively.
Further, for the TCGA-ASTAD training cohort, according to COX regression coefficient, the risk score of lncRNA-ceRNA network was calculated as follows: the expression of LINC02086 * 0.056 + the expression of LINC02535 * 0.082 + the expression of AC125807.2 * (-0.231) + the expression of PVT1 *0.0181 + the expression of MAGI2-AS3 * 0.109 + the expression of KCNQ1OT1 * (-0.007), and the median risk score in it was 0.561. Similarly, the risk score of the GSE15459 validation cohort was: LINC02086 * 0.025 + LINC02535 * 0.042 + AC125807.2 *0.244+ PVT1 * 0.232 + MAGI2-AS3 * 0.116 + KCNQ1OT1 *0.018, and the median risk score was 5.497. Then, patients in two cohorts were categorized into low-risk and high-risk groups based on median risk score. KM survival curves were subsequently employed to assess the OS of the different risk groups. The result showed significantly poorer survival in the high-risk patients in the training cohorts (P <0.0001; Figure 6A), and the result of the time-dependent ROC curve show that the signature has a good predictive efficacy on the patients' 1-year, 2-year 3-year survival rates (Figure 6B, the area under the curve (AUC) were 0.654, 0.731 and 0.721, respectively). Meanwhile, the scatter diagram of the risk score and the heatmap of risk score and the expression of 6 lncRNAs in the entire cohort are shown in Figure 6C and Figure 6D. The results of the heatmap showed that the expression of LINC02086 and LINC02535 was basically in line with high expression in high-risk tissues and low expression in low-risk tissues, while there was no significant difference in the distribution of the other four lncRNAs. In addition, the KM curve of the external validation cohort (GSE15459) also confirmed that high-risk patients had significantly worse prognosis compared to their low-risk counterparts (P = 0.009; Figure 6E). As shown in Figure 6F, the risk signature can also accurately predict the survival rate in the validation cohort, whose 1-year, 2-year and 3-year area under the ROC curve are 0.676, 0.705, and 0.737, respectively.
Figure 5
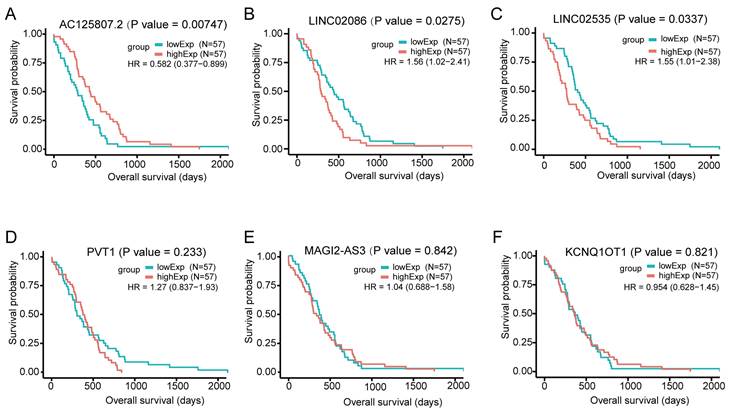
Overall survival analysis for the differentially expressed lncRNAs in the ceRNA network in patients with ASTAD, based on the median expression value of each lncRNA. It showed AC125807.2, LINC02086 and LINC02535 had statistically significant survival curves. (A) KM survival curve for AC125807.2. (B) KM survival curve for LINC02086. (C) KM survival curve for LINC02535. (D) KM survival curve for PVT1. (E) KM survival curve for MAGI2-AS3. (F) KM survival curve for KCNQ1OT1.
Figure 6
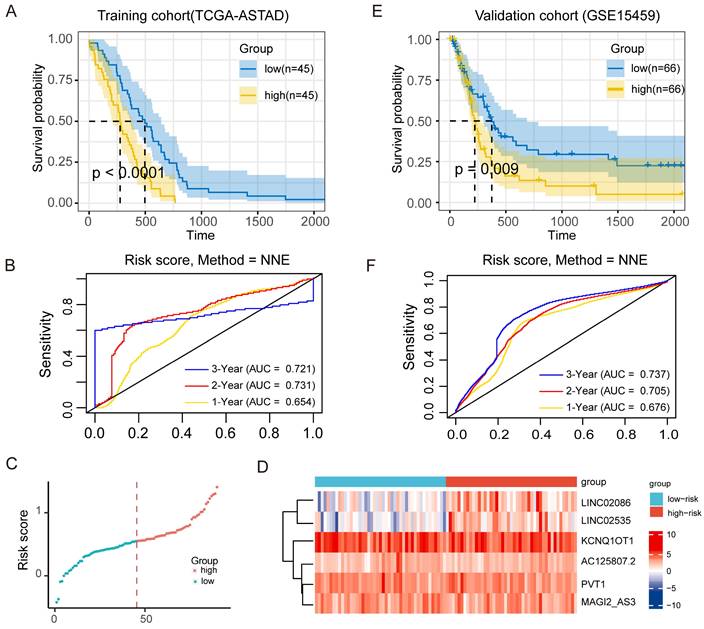
Prognostic effect of ceRNA network model on ASTAD patients. (A) KM survival curve for patients with high-risk scores and low-risk scores in training cohort. (B) ROC curve for assessing the efficacy of our signature in predicting patients' 1-year, 2-year, and 3-year survival rates in the training cohort. (C) The scatter diagram of the risk score and the expression of 6 lncRNAs in the entire cohort. (D) The scatter diagram of the risk score and the heatmap of risk score and the expression of 6 lncRNAs in the entire cohort. (E) KM survival curve for patients with high-risk scores and low-risk scores in validation cohort. (F) ROC curve for assessing the efficacy of our signature in predicting patients' 1-year, 2-year, and 3-year survival rates in thevalidation cohort.
LINC02086 acting as a ceRNA, competitively binding miR-93-5p with MMP3, and promoting GC progression in vitro
On one hand, due to the prognostic correlation of LINC02086 and LINC02535 in ASTAD, RT-qPCR was used to detect their expression levels between GC cells and normal gastric epithelial cell. The results revealed a significant upregulation of LINC02086 and LINC02535 in GC cells (Figure 7A). After siRNA transfection was used to knock down the expression of LINC02086 in GC cell NUGC-3, it showed the changes in the cell function. Specifically, CCK-8, clonal formation and EdU assay showed that the decreased expression of LINC02086 inhibited the proliferation ability of GC cells in vitro (Figure 7C-E), while cell cycle detection indicated a certain G2 phase arrest (Figure 7F). Furthermore, transwell and scratch assays confirmed that the expression of LINC02086 was significantly correlated with the migration ability of gastric cancer cells (Figure 7G-H).
In addition, western blot showed that EMT-related markers also had corresponding expression changes in the si-LINC02086 group. Specifically, the expression of epithelial markers such as E-cadherin and ZO-1 was up-regulated, while that of interstitial markers such as N-cadherin, β-catenin, Snail and Vimentin were down-regulated (Figure 8A-B). These findings comprehensively prove that high LINC02086 expression in gastric cancer promotes cell growth, proliferation and migration in vitro.
On the other hand, we analyzed mRNAs in the ceRNA network and identified MMP3 as the most significantly differentially expressed gene in ASTAD patients from the TCGA dataset (Supplemental Table 2). In the ceRNA network, both MMP3 and LINC02086 were likely to bind to miR-93-5p. Therefore, we propose that LINC02086/miR-93-5p/MMP3 axis might play a role in promoting ASTAD through the regulatory mechanism of ceRNA. In order to verify the above possibility, we performed RT-qPCR and WB detection on si-LINC02086 GC cell, and the results demonstrated that inhibition of LINC02086 expression led to down-regulation of both RNA (Figure 8C) and protein levels (Figure 8A-B) of MMP3. This confirmed a correlation between LINC02086 expression and MMP3 (Figure 8E). Furthermore, dual luciferase reporting assays confirmed direct regulatory effects of miR-93-5p on both LINC02086 and MMP3 through binding at the same site (Figure 8F-G). In addition, after the combination of si-LINC02086, the regulatory effect of miR-93-5p on MMP3 was weakened, and on the contrary, it was enhanced in the oe-LINC02086 group (Figure 8H). These findings provide further evidence for the involvement of LINC02086 as a ceRNA in gastric cancer.
Figure 7
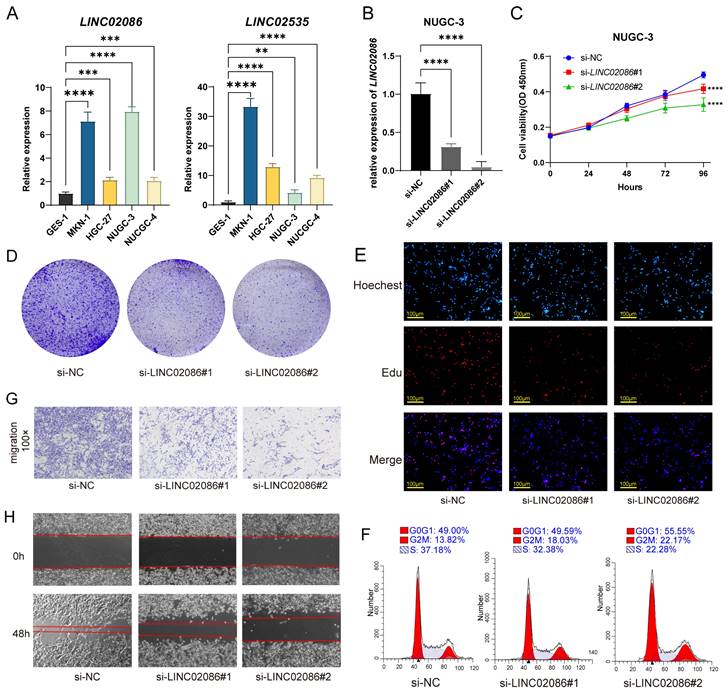
The verification of LINC02086 promoting GC progression in vitro. (A) RT-qPCR showed the expression levels of LINC02086 and LINC02535 were significantly higher in gastric cancer cells then normal gastric epithelial cell. (B) RT-qPCR showed the knockdown efficiency of siLINC02086 in NUGC-3 cell. (C-E) CCK-8, clonal formation assay and EdU assay showed that the decreased expression of LINC02086 inhibited the proliferation ability of gastric cancer cells. (F) Cell cycle detection results showed that the down-regulated expression of LINC02086 caused certain G2 phase arrest of gastric cancer cells. (G-H) The transwell and scratch assays showed that the expression of LINC02086 was significantly correlated with the migration ability of gastric cancer cells.
Figure 8
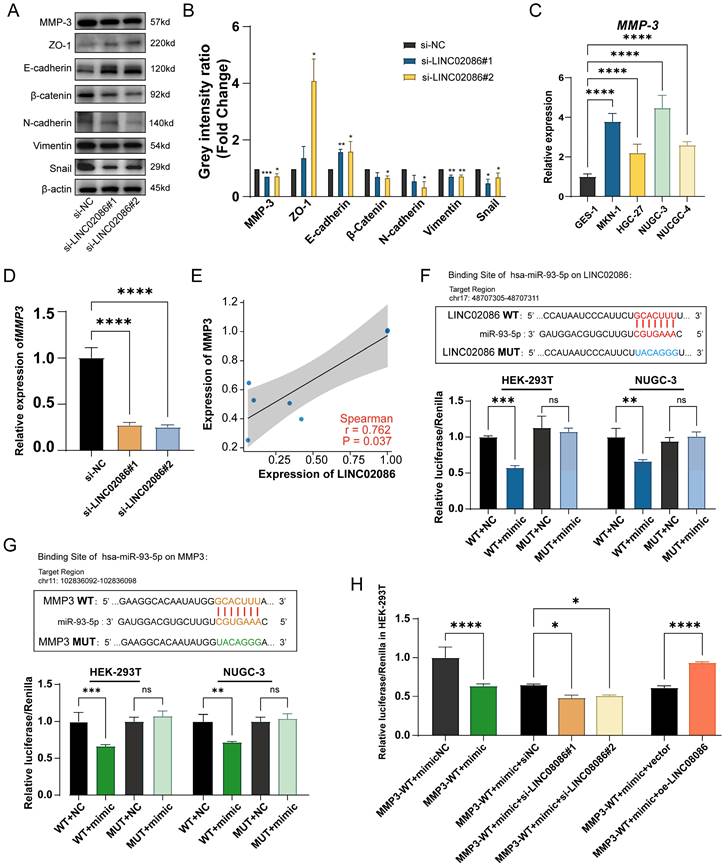
The verification of LINC02086 acting as a ceRNA, competitively binding miR-93-5p with MMP3. (A) Western blot showed the EMT-related markers and MMP3 were associated with LINC02086 expression. (B) The grey intensity ratio of western blot results. (C) RT-qPCR showed the expression levels of MMP3 were significantly higher in gastric cancer cells then normal gastric epithelial cell. (D) RT-qPCR showed that the mRNA level of MMP3 was down-regulated in si-LINC02086 group. (E) Scatter plot of expression correlation between MMP3 and LINC02086 at mRNA level based on PCR results. (F) Dual-luciferase reporting assay verified the target binding of LINC02086 and miR-93-5p. (G) Dual-luciferase reporting assay verified the target binding of MMP3 and miR-93-5p. (H) Dual-luciferase reporting assay showed the Luciferase activity of miR-93-5p on MMP3 influenced by the si/oe-LINC02086.
Discussion
There have been many studies of the ceRNA network in various cancers, including stomach cancer. However, few of them have focused on the different stages with different prognosis, whose biomarkers should also be different. ASTAD has its high heterogeneity and lacks mature targeted therapy and immunotherapy, thus requiring more relevant biomarkers to find new therapeutic targets and play their clinical role. Large-scale sample studies focusing specifically on ASTAD using microarray detection are still lacking. Hence, we selected patients with pathological stage III-IV from TCGA-STAD patients to analyzed the expression patterns of ASTAD mRNA, miRNA and lncRNA using microarray data. Despite limited sample availability (9 RNAseq and 7 miRNASeq data from adjacent normal tissues), we included all available sequencing data in our analysis to maximize sample utilization. Based on differentially expressed mRNA-miRNA and miRNA-lncRNA pairs, we constructed a ceRNA network comprising PVT1, MAGI2-AS3, KCNQ1OT1, LINC02086, AC125807.2 and LINC02535 as the ceRNAs.
Among these, PVT1 has been reported as a ceRNA that acts as an oncogenic molecule in stomach cancer[23], involved in the occurrence and development of STAD through various biological processes such as EMT[24], tumor angiogenesis[25], and anti-5-fluorouracil resistance[26]. KCNQ1OT1 has also been reported on the role of ceRNA[27]. Studies have found that KCNQ1OT1 enhanced cell proliferation and migration in bladder cancer by modulating the miR-145-5p/PCBP2 pathway[28], and the interaction between KCNQ1OT1 and miR-145-5p was also found in this study. The latest experimental verification[29] showed that MAGI2-AS3 was a kind of lncRNA related to EMT, which maintains ZEB1 overexpression by sponging miR-141/200a, leading to a poor prognosis of gastric cancer. However, our separate KM analysis did not demonstrate correlation between these three lncRNAs and ASTAD prognosis, perhaps because our study only targeted patients with advanced stages. Currently, researches on lncRNA by scholars mainly focus on bioinformatics analysis and basic experiments. Therefore, future investigations should encompass more clinical trials aimed at validating their clinical significance across different pathological stages.
In this study, we conducted KM survival analysis on 114 patients with stage III or IV STAD in the TCGA database. We found significant correlations between the lncRNAs AC125807.2, LINC02086, and LINC02535 from our ceRNA network and patient survival. Elevated expression levels of LINC02086 and LINC02535 predicted poor prognosis in ASTAD patients. So far, limited research has been conducted on these lncRNAs, with only one study linking LINC02535 to gastric cancer development. The study by Jianzhong Wu et al.[30] utilized transcriptome sequencing on clinical tissues from poorly differentiated gastric cancer patients found that LINC02535 was differentially highly expressed in tumor tissues and verified its oncogenic function in vitro. Furthermore, another study suggested an association between LINC02535 and cervical cancer[31]. Similarly, current studies have solely implicated LINC02086 as a ceRNA involved in hepatocellular carcinoma[32] and laryngeal squamous cell carcinoma[33]. Therefore, to validate our bioinformatics findings, we performed RT-qPCR to determine the expression levels of LINC02086 and LINC02535, which demonstrated a substantial up-regulation of their expression in gastric cancer cells, aligning with our bioinformatics prediction.
Further, in accordance with the ceRNA action model, a positive correlation is expected to exist between the expression levels of lncRNAs and their competing mRNAs within the network. In our constructed ceRNA network model, most lncRNA-miRNA-mRNA expressions adhere to this rule. Notably, MAGI2-AS3 and ZCCHC24 exhibit the strongest correlation among the groups of lncRNAs and mRNAs. However, there were also some groups has low correlation coefficients or even opposite expression trends. This could be attributed to other molecules in gastric cancer influencing the expression of these specific mRNAs alongside the role played by lncRNA as a ceRNA. Considering our aim to explore the specific possible mechanism of ceRNA in ASTAD, and based on the PCR results indicating high expression of that LINC02086 and LINC0253 in GC cells, we screened mRNAs in the ceRNA that were also highly expressed in ASTAD, and selected MMP3 with the highest log2FC value as the key mRNA for further study. In the ceRNA network, MMP3 and LINC02086 could competitively bind miR-93-5p, as directly confirmed by our dual luciferase reporter assay in vitro, and in the LINC02086 knock down gastric cancer cells, MMP3 was accordingly down-regulated in both mRNA and protein levels. In addition, for LINC02086, our study also confirmed that its knock down has biological functions including cell cycle arrest, inhibiting cell proliferation and metastasis in gastric cancer cells. These results imply that the LINC02086/miR-93-5p/MMP3 mechanism pathway may contribute to the pathogenesis of ASTAD. Functional enrichment analysis of DEGs in the ceRNA network revealed that it promotes cancer by interfering with gene transcription and cell proliferation, aligning with our in vitro experimental results. However, animal experiments are needed to confirm these findings, which will be conducted in our ongoing research.
Current studies suggest that ceRNA networks can be used for survival risk assessment in tumors. For instance, multiple lncRNA biomarkers have been identified to predict prognosis in colon cancer[34], while 5-lncRNA has shown potential as a prognostic biomarker for survival prediction in breast cancer[35]. To assess the prognostic value of our ceRNA network in ASTAD, we examined the risk scores of 6 lncRNAs through COX regression and performed survival analysis in the TCGA-ASTAD training cohort and the GSE154595 external validation cohort. Our results showed that ceRNA network model can serve as a prognostic model for ASTAD, with lncRNAs being potential biomarkers. Specifically, to our knowledge, this is the first study to develop a lncRNA risk score for advanced stomach adenocarcinoma utilizing the ceRNA network. However, our study has limitations, as it relies on ceRNA theory and requires further experimental validation and clinical follow-up.
Conclusions
Based on differentially expressed mRNAs, miRNAs, and lncRNAs in advanced stomach cancer, we created a ceRNA network in this study. Thus, we determined a 6-lncRNA network model (PVT1, MAGI2-AS3, KCNQ1OT1, LINC02086, AC125807.2 and LINC02535) that could predict survival risk and prognosis of ASTAD. And through GO and KEGG analysis of differentially expressed mRNAs, we found evidence suggesting that ceRNA may bind to miRNAs with target genes to regulate gene expression and interfere with the gene transcription and proliferation of tumor cells. Notably, LINC02086 and LINC02535 showed potential as poor prognostic signatures for ASTAD patients. Finally, we determined that LINC02086 has biological effects that promote the proliferation and migration of gastric cancer cells. This finding may be connected to a putative method of regulation of LINC02086/miR-93-5p/MMP3 as a ceRNA. Overall, this study constructs a ceRNA network of ASTAD and provides valuable information for further understanding of its molecular mechanism.
Abbreviations
ASTAD: advanced stomach adenocarcinoma; GC: gastric cancer; lncRNA: long noncoding RNA; ceRNA: competing endogenous RNA; TCGA: The Cancer Genome Atlas; OS: overall survival; DEG: differentially expressed; DELnc: differentially expressed lncRNA; DEM: differentially expressed miRNA; GO: gene ontology; KEGG: Kyoto Encyclopedia of Genes and Genomes; BP: biological processes; CC: cellular composition; MF: molecular function; KM: Kaplan Meier; AUC: area under the curve; EMT: Epithelial-Mesenchymal Transition.
Supplementary Material
Supplementary figure and tables.
Acknowledgements
We appreciate the great help/ technical support/ experimental support from the Public Platform of Medical Research Center, Academy of Chinese Medical Science, Zhejiang Chinese Medical University.
Funding
This work was supported by China Postdoctoral Science Foundation [grant number 2023T160588], The National College Students Innovation and Entrepreneurship Training Program [grant number 202310344065], Zhejiang Province College Students' Technology and Innovation Program in 2022 [grant number 2022R410A002], The Research Project of Zhejiang Chinese Medical University [grant number 2021RCZXZK10] and Young Elite Scientists Sponsorship Program by CACM [grant number 2021-QNRC2-B13].
Author contributions
Yixin Chen: Conceptualization, Methodology, Software, Visualization, Writing- Original draft preparation. Xin Gao: Conceptualization, Methodology, Validation, Visualization, Writing- Original draft preparation. Xinyang Dai: Conceptualization, Methodology, Investigation, Visualization, Writing- Original draft preparation. Yuwei Xia: Methodology, Validation, Writing- Original draft preparation. Xinran Zhang: Methodology, Validation, Writing- Original draft preparation. Leitao Sun: Validation, Writing- Original draft preparation. Ying Zhu: Conceptualization, Methodology, Supervision, Writing- Reviewing and Editing, Project administration, Funding acquisition.
Data availability statement
The original contributions presented in the study are included in the article, further inquiries can be directed to the corresponding author.
Competing Interests
The authors have declared that no competing interest exists.
References
1. Li K, Zhang A, Li X, Zhang H, Zhao L. Advances in clinical immunotherapy for gastric cancer. Biochim Biophys Acta Rev Cancer. 2021;1876:188615
2. Ajani JA, D'Amico TA, Bentrem DJ, Chao J, Cooke D, Corvera C. et al. Gastric Cancer, Version 2.2022, NCCN Clinical Practice Guidelines in Oncology. J Natl Compr Canc Netw. 2022;20:167-92
3. Asplund J, Kauppila JH, Mattsson F, Lagergren J. Survival Trends in Gastric Adenocarcinoma: A Population-Based Study in Sweden. Ann Surg Oncol. 2018;25:2693-702
4. Kang YK, Chen LT, Ryu MH, Oh DY, Oh SC, Chung HC. et al. Nivolumab plus chemotherapy versus placebo plus chemotherapy in patients with HER2-negative, untreated, unresectable advanced or recurrent gastric or gastro-oesophageal junction cancer (ATTRACTION-4): a randomised, multicentre, double-blind, placebo-controlled, phase 3 trial. Lancet Oncol. 2022;23:234-47
5. Janjigian YY, Maron SB, Chatila WK, Millang B, Chavan SS, Alterman C. et al. First-line pembrolizumab and trastuzumab in HER2-positive oesophageal, gastric, or gastro-oesophageal junction cancer: an open-label, single-arm, phase 2 trial. Lancet Oncol. 2020;21:821-31
6. Shi F, Liu Y, Zhou X, Shen P, Xue R, Zhang M. Disitamab vedotin: a novel antibody-drug conjugates for cancer therapy. Drug Deliv. 2022;29:1335-44
7. Xu W, Yang Z, Lu N. Molecular targeted therapy for the treatment of gastric cancer. J Exp Clin Cancer Res. 2016;35:1
8. Zheng Z, Guo Y, Zou CP. Oncological outcomes of addition of anti-PD1/PD-L1 to chemotherapy in the therapy of patients with advanced gastric or gastro-oesophageal junction cancer: A meta-analysis. Medicine (Baltimore). 2020;99:e18332
9. Zhou W, Gao M, Liang C, Lin B, Wu Q, Chen R. et al. Systematic Understanding of the Mechanism of Baicalin against Gastric Cancer Using Transcriptome Analysis. Biomed Res Int. 2021;2021:5521058
10. Jiang Y, Li X, Yang Y, Luo J, Ren X, Yuan J. et al. LncRNA HOXC-AS1 Sponges miR-99a-3p and Upregulates MMP8, Ultimately Promoting Gastric Cancer. Cancers (Basel). 2022;14:3534
11. Huang J, Yuan W, Chen B, Li G, Chen X. lncRNA ELFN1-AS1 upregulates TRIM29 by suppressing miR-211-3p to promote gastric cancer progression. Acta Biochim Biophys Sin (Shanghai). 2023;55:484-97
12. Liu H, Li D, Sun L, Qin H, Fan A, Meng L. et al. Interaction of lncRNA MIR100HG with hnRNPA2B1 facilitates m(6)A-dependent stabilization of TCF7L2 mRNA and colorectal cancer progression. Mol Cancer. 2022;21:74
13. Li F, Huang C, Li Q, Wu X. Construction and Comprehensive Analysis for Dysregulated Long Non-Coding RNA (lncRNA)-Associated Competing Endogenous RNA (ceRNA) Network in Gastric Cancer. Med Sci Monit. 2018;24:37-49
14. Leek JT, Monsen E, Dabney AR, Storey JD. EDGE: extraction and analysis of differential gene expression. Bioinformatics. 2006;22:507-8
15. Ashburner M, Ball CA, Blake JA, Botstein D, Butler H, Cherry JM. et al. Gene ontology: tool for the unification of biology. The Gene Ontology Consortium. Nat Genet. 2000;25:25-9
16. Kanehisa M. The KEGG database. Novartis Found Symp. 2002;247:91-101 discussion -3, 19-28, 244-52
17. Li JH, Liu S, Zhou H, Qu LH, Yang JH. starBase v2.0: decoding miRNA-ceRNA, miRNA-ncRNA and protein-RNA interaction networks from large-scale CLIP-Seq data. Nucleic Acids Res. 2014;42:D92-7
18. Huang HY, Lin YC, Cui S, Huang Y, Tang Y, Xu J. et al. miRTarBase update 2022: an informative resource for experimentally validated miRNA-target interactions. Nucleic Acids Res. 2022;50:D222-D30
19. McGeary SE, Lin KS, Shi CY, Pham TM, Bisaria N, Kelley GM. et al. The biochemical basis of microRNA targeting efficacy. Science. 2019;366:6472
20. Shannon P, Markiel A, Ozier O, Baliga NS, Wang JT, Ramage D. et al. Cytoscape: a software environment for integrated models of biomolecular interaction networks. Genome Res. 2003;13:2498-504
21. Zeng JH, Liang L, He RQ, Tang RX, Cai XY, Chen JQ. et al. Comprehensive investigation of a novel differentially expressed lncRNA expression profile signature to assess the survival of patients with colorectal adenocarcinoma. Oncotarget. 2017;8:16811-28
22. Heagerty PJ, Lumley T, Pepe MS. Time-dependent ROC curves for censored survival data and a diagnostic marker. Biometrics. 2000;56:337-44
23. Wang L, Xiao B, Yu T, Gong L, Wang Y, Zhang X. et al. lncRNA PVT1 promotes the migration of gastric cancer by functioning as ceRNA of miR-30a and regulating Snail. J Cell Physiol. 2021;236:536-48
24. Zhao J, Wu J, Qin Y, Zhang W, Huang G, Qin L. LncRNA PVT1 induces aggressive vasculogenic mimicry formation through activating the STAT3/Slug axis and epithelial-to-mesenchymal transition in gastric cancer. Cell Oncol (Dordr). 2020;43:863-76
25. Li Y, Xue JY, Chen S, Wang C, Sun P, Fu S. et al. LncRNA PVT1 is a novel mediator promoting the angiogenesis response associated with collateral artery formation. Int J Biochem Cell Biol. 2022;151:106294
26. Petit J, Carroll G, Gould T, Pockney P, Dun M, Scott RJ. Cell-Free DNA as a Diagnostic Blood-Based Biomarker for Colorectal Cancer: A Systematic Review. The Journal of surgical research. 2019;236:184-97
27. Feng L, Li H, Li F, Bei S, Zhang X. LncRNA KCNQ1OT1 regulates microRNA-9-LMX1A expression and inhibits gastric cancer cell progression. Aging (Albany NY). 2020;12:707-17
28. Wang J, Zhang H, Situ J, Li M, Sun H. KCNQ1OT1 aggravates cell proliferation and migration in bladder cancer through modulating miR-145-5p/PCBP2 axis. Cancer Cell Int. 2019;19:325
29. Li D, Wang J, Zhang M, Hu X, She J, Qiu X. et al. LncRNA MAGI2-AS3 Is Regulated by BRD4 and Promotes Gastric Cancer Progression via Maintaining ZEB1 Overexpression by Sponging miR-141/200a. Mol Ther Nucleic Acids. 2020;19:109-23
30. Wu J, Gao L, Chen H, Zhou X, Lu X, Mao Z. LINC02535 promotes cell growth in poorly differentiated gastric cancer. J Clin Lab Anal. 2021: e23877.
31. Wen D, Huang Z, Li Z, Tang X, Wen X, Liu J. et al. LINC02535 co-functions with PCBP2 to regulate DNA damage repair in cervical cancer by stabilizing RRM1 mRNA. J Cell Physiol. 2020;235:7592-603
32. Ye J, Li H, Wei J, Luo Y, Liu H, Zhang J. et al. Risk Scoring System based on lncRNA Expression for Predicting Survival in Hepatocellular Carcinoma with Cirrhosis. Asian Pac J Cancer Prev. 2020;21:1787-95
33. Shi Y, Yang D, Qin Y. Identifying prognostic lncRNAs based on a ceRNA regulatory network in laryngeal squamous cell carcinoma. BMC Cancer. 2021;21:705
34. Cheng Y, Geng L, Wang K, Sun J, Xu W, Gong S. et al. Long Noncoding RNA Expression Signatures of Colon Cancer Based on the ceRNA Network and Their Prognostic Value. Dis Markers. 2019;2019:7636757
35. Yao Y, Zhang T, Qi L, Zhou C, Wei J, Feng F. et al. Integrated analysis of co-expression and ceRNA network identifies five lncRNAs as prognostic markers for breast cancer. J Cell Mol Med. 2019;23:8410-9
Author contact
![]() Corresponding authors: Ying Zhu, ying.zhuedu.cn; Leitao Sun, sunnyltedu.cn.
Corresponding authors: Ying Zhu, ying.zhuedu.cn; Leitao Sun, sunnyltedu.cn.
Citation styles
APA
Chen, Y., Gao, X., Dai, X., Xia, Y., Zhang, X., Sun, L., Zhu, Y. (2024). Integrated Bioinformatics and Experimental Analysis of Long Noncoding RNA Associated-ceRNA as Prognostic Biomarkers in Advanced Stomach Adenocarcinoma. Journal of Cancer, 15(6), 1536-1550. https://doi.org/10.7150/jca.89526.
ACS
Chen, Y.; Gao, X.; Dai, X.; Xia, Y.; Zhang, X.; Sun, L.; Zhu, Y. Integrated Bioinformatics and Experimental Analysis of Long Noncoding RNA Associated-ceRNA as Prognostic Biomarkers in Advanced Stomach Adenocarcinoma. J. Cancer 2024, 15 (6), 1536-1550. DOI: 10.7150/jca.89526.
NLM
Chen Y, Gao X, Dai X, Xia Y, Zhang X, Sun L, Zhu Y. Integrated Bioinformatics and Experimental Analysis of Long Noncoding RNA Associated-ceRNA as Prognostic Biomarkers in Advanced Stomach Adenocarcinoma. J Cancer 2024; 15(6):1536-1550. doi:10.7150/jca.89526. https://www.jcancer.org/v15p1536.htm
CSE
Chen Y, Gao X, Dai X, Xia Y, Zhang X, Sun L, Zhu Y. 2024. Integrated Bioinformatics and Experimental Analysis of Long Noncoding RNA Associated-ceRNA as Prognostic Biomarkers in Advanced Stomach Adenocarcinoma. J Cancer. 15(6):1536-1550.
This is an open access article distributed under the terms of the Creative Commons Attribution License (https://creativecommons.org/licenses/by/4.0/). See http://ivyspring.com/terms for full terms and conditions.