Journal of Cancer
ISSN: 1837-9664
3.2
Impact Factor
ISSN: 1837-9664

 Global reach, higher impact
J Cancer 2024; 15(6):1762-1769. doi:10.7150/jca.90379 This issue Cite
Research Paper
Gene polymorphisms of METTL5 and METTL16 are related to epithelial ovarian cancer risk in South China: A three-center case-control study
Siyi Zhang1*, Shanshan Liu2*, Wenchu Chen1*, Yaping Yan2, Mansi Cai2, Xiaoping Liu2, Ailing Luo2, Wenjuan Li3, Lisha Yi4 ![]() , Yingyi Xu1
, Yingyi Xu1 ![]()
1. Department of Anesthesiology, Guangzhou Women and Children's Medical Center, Guangzhou Medical University, Guangdong Provincial Clinical Research Center for Child Health, Guangzhou, 510623, China.
2. Department of Hematology and Oncology, Guangzhou Women and Children's Medical Center, Guangzhou Medical University, Guangdong Provincial Clinical Research Center for Child Health, Guangzhou, 510623, China.
3. Medical Research Center, Shunde Hospital, Southern Medical University, Foshan, Guangdong, 528000, China.
4. Department of gynaecology, Guangzhou Women and Children's Medical Center, Guangzhou Medical University, Guangdong Provincial Clinical Research Center for Child Health, Guangzhou, 510623, China.
*These authors contributed equally to this work.
Received 2023-9-21; Accepted 2024-1-15; Published 2024-2-4
Citation:
Zhang S, Liu S, Chen W, Yan Y, Cai M, Liu X, Luo A, Li W, Yi L, Xu Y. Gene polymorphisms of METTL5 and METTL16 are related to epithelial ovarian cancer risk in South China: A three-center case-control study. J Cancer 2024; 15(6):1762-1769. doi:10.7150/jca.90379. https://www.jcancer.org/v15p1762.htm
Other stylesAbstract

Background: The potential relation of methyltransferase-like gene polymorphisms and epithelial ovarian cancer (EOC) remains unclear.
Methods: Five SNPs (METTL5 rs3769767 A>G, METTL16 rs1056321 T>C, METTL5 rs10190853 G>A, METTL5 rs3769768 G>A and METTL16 rs11869256 A>G) of methyltransferase-like genes was selected trough NCBI dbSNP database. Two hundred and eighty-eight cases and 361 controls were enrolled from three hospitals in South China to conduct the case-control study. Genomic DNA was abstracted from peripheral blood and genotyped through a TapMan assay. Stratified analysis was conducted to explore the association of rs10190853, rs3769768, rs11869256 genotype and EOC susceptibility. The combination analysis was adopted to evaluate the relation between inferred haplotypes of the METTL5, METTL16 genes and EOC risk. Multifactor dimensionality reduction (MDR) analysis was performed to verify the interaction of SNPs.
Results: Among the five analyzed SNPs, METTL5 rs3769768 AA exhibited a significant association with increased EOC risk, while METTL5 rs10190853 GA, METTL16 rs11869256 GA was certified to decrease the susceptibility of EOC. The stratified analysis further revealed the harmful effect of METTL5 rs3769768 AA in EOC patients. On the contrary, METTL16 rs11869256 AG/GG and METTL5 rs10190853 AA showed the reduced risk of EOC in patients of specific subgroups. Combination analysis identified that haplotypes AAA highly connected with reduced risk of EOC. MDR analysis revealed that these SNPs existed no specific interactions.
Conclusion: METTL5 rs3769768 was related to increased risk of EOC. METTL5 rs10190853 and METTL16 rs11869256 decreased the susceptibility in EOC. METTL5 and METTL16 could be potential target of molecular therapy and prognosis markers.
Keywords: epithelial ovarian cancer, polymorphism, methyltransferase-like gene, susceptibility
Introduction
Epithelial ovarian cancer (EOC) remains the most common cause of death amongst all type of gynaecological malignancies, accounts for 90% of all ovarian cancers. It occurs about 57200 new cases and 27200 cases of death in China yearly, which comprise 8.47% of all cancers and 4.04% of all cancer deaths, respectively[1]. The 5-years relative survival of EOC is 50.8%[2]. The diagnostic evaluation of EOC involves pelvic ultrasound, computed tomography (CT) scans of the thorax, abdomen, and pelvis, and pathological examination. Additionally, serum levels of CA-125, CA 19-9, and CEA are crucial for the diagnosis[3]. EOC is classified as high-grade serous (HGSOC), low-grade serous(LGSOC), mucinous, clear cell, endometroid (EC), and undifferentiated according to pathological features[4, 5]. Based on the International Federation of Gynecology and Obstetrics (FIGO 2018) system, EOC staging range from I to IV. Optimal surgery and platinum-based chemotherapy contributes to cure of early stage EOC with 92.4% 5-year survival rate, but can't improve the prognosis of advanced stage[6].
N6-methyladenosine (m6A) is the most abundant internal modification of RNA in eukaryotic cells, which has been proved to have impact on carcinogenesis. Methyltransferases METTL3, METTL14, METTL5, METTL16 and Wilms' tumor 1-associated protein (WTAP), demethylases fat mass and obesity-associated protein (FTO) and α-ketoglutarate-dependent dioxygenase homolog 5 (ALKBH5), and readers YT521-B homology (YTH) domain family (including YTHDF1, YTHDF2, YTHDF3, YTHDC1 and YTHDC2) play essential roles during the modification. Targeting on m6A regulators promotes the development of anticancer drugs[7]. The m6A methyltransferases participant in the tumor growth, metastasis, and chemotherapy resistance of ovarian cancer[8]. METTL3 can promote the tumor growth of EOC[9]. Studies have shown that in EOC, m6A methylation regulators modify the tumor progression, such as high expression of WTAP relating to the poor prognosis of EOC[8]. Chang et al.[10] assessed the METTL16 expression in EOC and found that low expression of METTL16 was connected with shorter overall survival, which suggested that METTL16 might be beneficial to prognostic evaluation of EOC, but the specific mechanism remains unclear. However, the expression and function of ribosomal RNA m6A methyltransferase METTL5 in EOC has not been reported.
Genome-wide association studies (GWAS) have identified several loci and single nucleotide polymorphisms (SNPs) that are linked to the susceptibility of EOC[11, 12]. METTL3 polymorphisms reduced the susceptibility of Wilms tumor[13]. It was reported that METTL14 polymorphisms may relate to risk of hepatoblastoma[14]. WTAP polymorphisms has weak impact on the susceptibility of neuroblastoma[15]. Zhen et al.[16] found that METTL16 polymorphisms reduced the risk of sudden cardiac death. As far as we know, no study conducted to verify the potential association of METTL16 polymorphisms and cancers. Besides, there is no research reveal the relationship between METTL5 polymorphisms and diseases. A plenty of studies discover that heritable variations in genes have remarkable effect on the progression of EOC[17]. Nevertheless, how SNPs in m6A methyltransferases METTL5 and METTL16 function on the risk of EOC remains unrevealed.
In present study, we aimed to reveal the association between methyltransferase METTL5 and METTL16 gene polymorphisms and EOC susceptibility by performing a three-center case-control study in South China, which included five SNPs.
Materials and Methods
Study subjects
In our study, 288 EOC patients and 361 controls were enrolled from Guangzhou Women and Children's Center, The First Affiliated Hospital of Jinan University, and Shunde Hospital of Southern Medical University. Age-matched control subjects, who were free of EOC or other gynaecological malignancies, were collected from volunteers visiting the same hospital. All participants signed consent to use their sample for research purpose. The study was approved by the Ethics Committee of Guangzhou Women and Children's Medical Center (No.117A01). The demographic characteristics of all participants were presented in Table S1.
SNP selection and genotyping
We performed the selection of potentially functional SNPs through the NCBI dbSNP database (http://www.ncbi.nlm.nih.gov/projects/SNP) and the SNP info (https://snpinfo.niehs.nih.gov/snpinfo/snpfunc.html) according to the following criteria: located in the 5' untranslated region, 3' untranslated region, 5' flanking region, and exon of the gene, low linkage disequilibrium (R2 < 0.8). Five SNPs (rs3769767 A>G, rs1056321 T>C, rs10190853 G>A, rs3769768 G>A, rs11869256 A>G) were chosen. DNA was extracted by the TIANamp DNA Kit (Tiangen, Beijing, China) according to the standard instructions of the kit. In order to exclude genotyping errors, genotyping results were confirmed by randomly assaying 10% of the original specimens for replication.
SNP‑SNP interaction analysis
Epistasis was evaluated and characterized between the SNPs by the multifactor dimensionality reduction (MDR) method using the MDR software, v3.0.2 (Computational Genetics Laboratory, University of Pennsylvania, USA; available for free at https://www.epistasis.org) as previously described[18]. Briefly, the genotype of each SNP was characterized by a predefined number and analyzed in conjunction with data indicating the presence or absence of EOC. Cross-validation consistency (CVC) and the test accuracy were used to identify the best interaction models. Values with a P <0.05 were considered statistically significant.
Statistical analysis
The χ2 test was performed to assess if the selected METTL5 and METTL16 SNPs deviated from Hardy-Weinberg equilibrium among controls. The two-sided χ2 test was used to compare demographic variables and genotype frequencies of the cases and controls. Unconditional logistic regression analyses were conducted to compute ORs and their corresponding 95% CIs with or without adjustment for age. The SAS statistical package (version 9.1; SAS Institute, Cary, NC) was adopted to perform all statistical analyses. A two-sided P values was used for all the statistical analysis and a P value < 0.05 was considered as statistical significance.
Results
Association of m6A methyltransferases polymorphisms and EOC risk
Our study successfully genotyped five SNPs, which were rs3769767 A/G, rs1056321 T/C, rs10190853 G/A, rs3769768 G/A, and rs11869256 A/G. The single-locus analysis was conducted to identify the association between five SNPs and EOC risk, as shown in Table 1. The METTL5 rs10190853 (GA versus GG: adjusted OR=0.607,95% CI=0.432-0.853, P=0.0041) and METTL16 rs11869256 (GA versus AA: adjusted OR=0.565,95% CI=0.401-0.796, P=0.0011) variant alleles showed reduced susceptibility to EOC. On the contrary, the METTL5 rs3769768 (AA versus GG: adjusted OR=2.841,95% CI=1.026-7.867, P=0.0444) variant alleles resulted in enhanced risk of EOC. The rest two SNPs of METTL5 gene (rs3769767 A>G, rs1056321 T>C) were not detected relationship with EOC risk.
Table 1
Logistic regression analysis of associations between METTL5, METTL16 polymorphisms and EOC susceptibility.
| Genotype | Cases | Controls | Pa | Crude OR | P | Adjusted OR | Pb | |||||
|---|---|---|---|---|---|---|---|---|---|---|---|---|
| (N=288) | (N=361) | (95% CI) | (95% CI) b | |||||||||
| rs3769767A>G (HWE=0.001) | ||||||||||||
| AA | 163 (69.07) | 182 (56.88) | 1.00 | 1.00 | ||||||||
| AG | 62 (26.27) | 132 (41.25) | 0.553 (0.389-0.786) | 0.0010 | 0.548 (0.384-0.782) | 0.0009 | ||||||
| GG | 11 (4.66) | 6 (1.88) | 2.157 (0.785-5.930) | 0.1361 | 2.483 (0.895-6.884) | 0.0805 | ||||||
| Additive | 0.0004 | 0.729 (0.533-0.996) | 0.0472 | 0.733 (0.534-1.007) | 0.0555 | |||||||
| Dominant | 73 (30.93) | 138 (43.13) | 0.0034 | 0.591 (0.415-0.841) | 0.0035 | 0.584 (0.409-0.836) | 0.0033 | |||||
| Recessive | 225 (95.34) | 314 (98.13) | 0.0593 | 2.560 (0.933-3.024) | 0.0680 | 3.005 (1.083-8.339) | 0.0346 | |||||
| rs1056321T>C (HWE=0.082) | ||||||||||||
| TT | 124 (47.88) | 149 (44.88) | 1.00 | 1.00 | ||||||||
| TC | 103 (39.77) | 136 (40.96) | 1.030 (0.740-1.433) | 0.8626 | 1.072 (0.768-1.498) | 0.6826 | ||||||
| CC | 32 (12.36) | 47 (14.16) | 0.926 (0.564-1.519) | 0.7597 | 0.919 (0.557-1.515) | 0.7391 | ||||||
| Additive | 0.7091 | 0.906 (0.717-1.144) | 0.4075 | 0.915 (0.723-1.158) | 0.4591 | |||||||
| Dominant | 135 (52.12) | 183 (55.12) | 0.4684 | 0.886 (0.640-1.228) | 0.4685 | 0.914 (0.658-1.271) | 0.5943 | |||||
| Recessive | 227 (87.64) | 285 (85.84) | 0.5231 | 0.855 (0.528-1.384) | 0.5234 | 0.832 (0.511-1.354) | 0.4592 | |||||
| rs10190853 G>A (HWE=0.322) | ||||||||||||
| GG | 103 (44.98) | 152 (41.87) | 1.00 | 1.00 | ||||||||
| GA | 86 (37.55) | 159 (43.80) | 0.601 (0.429-0.842) | 0.0031 | 0.607 (0.432-0.853) | 0.0041 | ||||||
| AA | 40 (17.47) | 52 (14.33) | 0.855 (0.538-1.359) | 0.5069 | 0.825 (0.516-1.318) | 0.4214 | ||||||
| Additive | 0.2822 | 1.001 (0.794-1.261) | 0.9951 | 0.985 (0.780-1.245) | 0.9001 | |||||||
| Dominant | 126 (55.02) | 211 (58.13) | 0.4575 | 0.881 (0.631-1.230) | 0.4576 | 0.875 (0.624-1.226) | 0.4364 | |||||
| Recessive | 189 (82.53) | 311 (85.67) | 0.3041 | 1.266 (0.807-1.985) | 0.3048 | 1.209 (0.766-1.907) | 0.4155 | |||||
| rs3769768 G>A (HWE=0.709) | ||||||||||||
| GG | 182 (72.51) | 244 (76.25) | 1.00 | 1.00 | ||||||||
| GA | 58 (23.11) | 70 (21.88) | 1.192 (0.808-1.757) | 0.3759 | 1.213 (0.820-1.796) | 0.3341 | ||||||
| AA | 11 (4.38) | 6 (1.88) | 2.637 (0.961-7.237) | 0.0598 | 2.841 (1.026-7.867) | 0.0444 | ||||||
| Additive | 0.1892 | 1.267 (0.918-1.747) | 0.1495 | 1.300 (0.940-1.798) | 0.1132 | |||||||
| Dominant | 69 (27.49) | 76 (23.75) | 0.3082 | 1.217 (0.834-1.777) | 0.3085 | 1.249 (0.852-1.829) | 0.2542 | |||||
| Recessive | 240 (95.62) | 314 (98.13) | 0.0802 | 2.399 (0.875-6.578) | 0.0892 | 2.558 (0.926-7.068) | 0.0700 | |||||
| rs11869256 A>G (HWE=0.223) | ||||||||||||
| AA | 109 (42.91) | 103 (30.47) | 1.00 | 1.00 | ||||||||
| GA | 91 (35.83) | 177 (52.37) | 0.561 (0.399-0.788) | 0.0008 | 0.565 (0.401-0.796) | 0.0011 | ||||||
| GG | 54 (21.26) | 58 (17.16) | 1.016 (0.658-1.569) | 0.9441 | 1.071 (0.690-1.662) | 0.7599 | ||||||
| Additive | 0.0003 | 0.851 (0.678-1.068) | 0.1637 | 0.865 (0.688-1.089) | 0.2167 | |||||||
| Dominant | 145 (57.09) | 235 (69.53) | 0.0018 | 0.583 (0.415-0.819) | 0.0019 | 0.588 (0.417-0.829) | 0.0024 | |||||
| Recessive | 200 (78.74) | 280 (82.84) | 0.2074 | 1.303 (0.863-1.969) | 0.2081 | 1.364 (0.898-2.072) | 0.1452 | |||||
Abbreviations: EOC, epithelial ovarian cancer; HWE, Hardy-Weinberg equilibrium; OR, odds ratios; CI, confidence interval; FIGO, International Federation of Gynaecology and Obstetrics; NA = not applicable.
a χ2 test for genotype distributions between EOC cases and cancer‐free controls.
b Adjusted for age.
Table 2
Stratification analysis of METTL5, METTL16 polymorphisms with EOC susceptibility.
| Variables | rs10190853 G>A | Adjusted OR a | P a | rs3769768 G>A | Adjusted OR a | P a | rs11869256 A>G | Adjusted OR a | P a | |||
|---|---|---|---|---|---|---|---|---|---|---|---|---|
| (cases/controls) | (95% CI) | (cases/controls) | (95% CI) | (cases/controls) | (95% CI) | |||||||
| GG/GA | AA | GG/GA | AA | AA | AG/GG | |||||||
| Age, years | ||||||||||||
| >53 | 86 (311) | 21 (52) | 1.172 (0.595-2.309) | 0.6459 | 110 (314) | 5 (6) | >999.999 (<0.001, >999.999) | 0.9792 | 54 (103) | 61 (235) | 0.440 (0.252-0.769) | 0.0040 |
| ≤53 | 103 (311) | 19 (52) | 1.239 (0.671-2.291) | 0.4935 | 130 (314) | 6 (6) | 1.585 (0.500-5.018) | 0.4338 | 55 (103) | 84 (235) | 0.706 (0.458-1.094) | 0.1194 |
| Metastasis | ||||||||||||
| Yes | 72 (311) | 15 (52) | 1.213 (0.642-2.290) | 0.5519 | 84 (314) | 7 (6) | 4.965 (1.598-15.421) | 0.0056 | 41 (103) | 50 (235) | 0.531 (0.329-0.856) | 0.0094 |
| No | 103 (311) | 22 (52) | 1.213 (0.699-2.108) | 0.4923 | 138 (314) | 3 (6) | 1.309 (0.320-5.359) | 0.7085 | 61 (103) | 85 (235) | 0.612 (0.408-0.917) | 0.0174 |
| Clinical stage | ||||||||||||
| I | 32 (311) | 11 (52) | 0.903 (0.893-4.052) | 0.0954 | 49 (314) | 3 (6) | 4.013 (0.930-17.309) | 0.0624 | 20 (103) | 35 (235) | 0.768 (0.419-1.409) | 0.3944 |
| II | 32 (311) | 8 (52) | 1.454 (0.633-3.340) | 0.3778 | 41 (314) | 4 (6) | 5.725 (1.508-24.731) | 0.0103 | 23 (103) | 22 (235) | 0.416 (0.221-0.780) | 0.0063 |
| III | 75 (311) | 12 (52) | 0.93 (0.474-1.851) | 0.8509 | 85 (314) | 2 (6) | 1.305 (0.257-6.635) | 0.7486 | 37 (103) | 47 (235) | 0.552 (0.337-0.903) | 0.0180 |
| IV | 19 (311) | 3 (52) | 0.919 (0.262-3.224) | 0.8948 | 22 (314) | 1 (6) | 2.643 (0.296-23.601) | 0.3844 | 9 (103) | 14 (235) | 0.681 (0.286-1.626) | 0.3873 |
| Pathological grade | ||||||||||||
| low | 49 (311) | 12 (52) | 1.359 (0.672-2.750) | 0.3933 | 63 (314) | 6 (6) | 5.803 (1.779-18.923) | 0.0036 | 30 (103) | 45 (235) | 0.651 (0.387-1.094) | 0.1048 |
| high | 128 (311) | 24 (52) | 1.076 (0.632-1.831) | 0.7883 | 151 (314) | 5 (6) | 1.852 (0.551-6.227) | 0.3189 | 66 (103) | 89 (235) | 0.596 (0.400-0.887) | 0.0108 |
| Tumor number | ||||||||||||
| single | 51 (311) | 13 (52) | 1.437 (0.720-2.868) | 0.3041 | 76 (314) | 3 (6) | 2.504 (0.593-10.573) | 0.2118 | 36 (103) | 51 (235) | 0.617 (0.346-3.011) | 0.0553 |
| multiple | 89 (311) | 12 (52) | 0.794 (0.406-1.555) | 0.5017 | 104 (314) | 3 (6) | 1.592 (0.389-6.515) | 0.5179 | 44 (103) | 61 (235) | 0.604 (0.384-0.950) | 0.0291 |
| Tumor size | ||||||||||||
| >3 cm | 50 (311) | 15 (52) | 1.682 (0.873-3.238) | 0.1201 | 64 (314) | 5 (6) | 4.453 (1.298-15.271) | 0.0175 | 29 (103) | 35 (235) | 0.524 (0.303-0.907) | 0.0209 |
| ≤3 cm | 120 (311) | 23 (52) | 1.116 (0.651-1.915) | 0.6896 | 155 (314) | 4 (6) | 1.485 (0.409-5.385) | 0.5478 | 71 (103) | 99 (235) | 0.604 (0.410-0.889) | 0.0105 |
| Pregnant times | ||||||||||||
| ≤3 | 107 (311) | 25 (52) | 1.322 (0.777-2.249) | 0.3038 | 140 (314) | 6 (6) | 2.447 (0.767-7.803) | 0.1304 | 55 (103) | 88 (235) | 0.700 (0.463-1.058) | 0.0903 |
| >3 | 82 (311) | 15 (52) | 1.053 (0.561-1.976) | 0.8720 | 100 (314) | 5 (6) | 2.912 (0.861-9.849) | 0.0856 | 54 (103) | 57 (235) | 0.463 (0.298-0.719) | 0.0006 |
| Pausimenia | ||||||||||||
| post-menopause | 136 (311) | 29 (52) | 1.132 (0.671-1.911) | 0.6422 | 167 (314) | 10 (6) | 4.296 (1.464-12.608) | 0.0080 | 83 (103) | 96 (235) | 0.495 (0.333-0.735) | 0.0005 |
| pre-menopause | 53 (311) | 11 (52) | 1.394 (0.660-2.946) | 0.3837 | 73 (314) | 1 (6) | 0.470 (0.056-3.973) | 0.4884 | 26 (103) | 49 (235) | 0.871 (0.502-1.510) | 0.6222 |
| ER expression | ||||||||||||
| negative/mild positive | 28 (311) | 3 (52) | 0.607 (0.177-2.085) | 0.4280 | 33 (314) | 1 (6) | 1.883 (0.216-16.446) | 0.5671 | 15 (103) | 19 (235) | 0.537 (0.261-1.105) | 0.0912 |
| strong positive | 50 (311) | 15 (52) | 1.651 (0.857-3.182) | 0.1341 | 65 (314) | 2 (6) | 1.792 (0.350-9.168) | 0.4839 | 27 (103) | 45 (235) | 0.730 (0.428-1.243) | 0.2460 |
| PR expression | ||||||||||||
| negative/mild positive | 27 (311) | 6 (52) | 1.295 (0.508-3.298) | 0.5883 | 32 (314) | 1 (6) | 1.679 (0.195-14.472) | 0.6374 | 15 (103) | 20 (235) | 0.580 (0.285-1.180) | 0.1328 |
| strong positive | 30 (311) | 6 (52) | 1.204 (0.477-3.043) | 1.0000 | 37 (314) | 1 (6) | 1.322 (0.153-11.406) | 0.7998 | 10 (103) | 31 (235) | 1.359 (0.642-2.875) | 0.4229 |
| PAX8 expression | ||||||||||||
| negative/mild positive | 22 (311) | 5 (52) | 1.312 (0.474-3.632) | 0.6018 | 25 (314) | 0 (6) | - | 13 (103) | 14 (235) | 0.463 (0.210-1.024) | 0.0572 | |
| strong positive | 56 (311) | 6 (52) | 0.631 (0.258-1.541) | 0.3120 | 63 (314) | 2 (6) | 1.667 (0.327-8.490) | 0.5382 | 26 (103) | 39 (235) | 0.657 (0.380-1.136) | 0.1328 |
| Wild p53 expression | ||||||||||||
| negative/mild positive | 53 (311) | 8 (52) | 0.891 (0.400-1.985) | 0.7778 | 61 (314) | 1 (6) | 0.880 (0.103-7.516) | 0.9073 | 22 (103) | 39 (235) | 0.777 (0.438-1.376) | 0.3865 |
| strong positive | 136 (311) | 32 (52) | 1.327 (0.810-2.173) | 0.2607 | 179 (314) | 10 (6) | 3.177 (1.122-8.997) | 0.0296 | 87 (103) | 106 (235) | 0.531 (0.366-0.770) | 0.0008 |
| Mutant p53 expression | ||||||||||||
| Yes | 89 (311) | 21 (52) | 1.362 (0.776-2.393) | 0.2821 | 112 (314) | 3 (6) | 1.507 (0.368-6.175) | 0.5689 | 49 (103) | 68 (235) | 0.608 (0.393-0.942) | 0.0258 |
| No | 100 (311) | 19 (52) | 1.068 (0.598-1.907) | 0.8239 | 127 (314) | 8 (6) | 3.699 (1.243-11.007) | 0.0187 | 60 (103) | 77 (235) | 0.560 (0.370-0.547) | 0.0061 |
| WT1 expression | ||||||||||||
| negative/mild positive | 26 (311) | 10 (52) | 2.225 (1.009-4.909) | 0.0476 | 31 (314) | 1 (6) | 1.867 (0.215-16.201) | 0.5712 | 18 (103) | 17 (235) | 0.405 (0.200-0.819) | 0.0119 |
| strong positive | 66 (311) | 10 (52) | 0.869 (0.418-1.806) | 0.7062 | 75 (314) | 2 (6) | 1.568 (0.307-8.002) | 0.5888 | 37 (103) | 47 (235) | 0.555 (0.340-0.908) | 0.0170 |
| P16 expression | ||||||||||||
| negative/mild positive | 27 (311) | 8 (52) | 1.687 (0.722-3.940) | 0.2270 | 35 (314) | 1 (6) | 1.664 (0.192-14.393) | 0.6434 | 16 (103) | 18 (235) | 0.479 (0.234-0.981) | 0.0443 |
| strong positive | 54 (311) | 11 (52) | 1.182 (0.579-2.417) | 0.6459 | 68 (314) | 2 (6) | 1.649 (0.324-8.402) | 0.5473 | 27 (103) | 46 (235) | 0.738 (0.434-1.255) | 0.2624 |
| ki67 expression | ||||||||||||
| negative/mild positive | 19 (311) | 8 (52) | 2.347 (0.969-5.685) | 0.0589 | 38 (314) | 2 (6) | 3.103 (0.589-16.339) | 0.1816 | 19 (103) | 19 (235) | 0.432 (0.219-0.854) | 0.0157 |
| strong positive | 65 (311) | 13 (52) | 1.173 (0.602-2.282) | 0.6395 | 77 (314) | 1 (6) | 0.716 (0.084-6.082) | 0.7593 | 28 (103) | 59 (235) | 0.920 (0.554-1.527) | 0.7470 |
a Adjusted for age.
Stratification analysis of identified SNPs
The further stratification analysis was applied to screening the connection of three significant risk-associated SNPs (rs10190853 G/A, rs3769768 G/A, rs11869256 A/G) and clinical parameters of EOC (Table 2), including age, metastasis, clinical stage, pathological grade, tumor number, tumor size, pregnancy history, and expression levels of ER, PR, PAX8, wild-type p53, mutant p53, WT1, P16 and ki67. For the METTL5 rs10190853, a significant decreased risk of EOC was revealed among patients with negative/mild positive WT1 expression (adjusted OR=2.225, 95%CI=1.009-4.909, P=0.0476). Besides, the METTL16 rs11869256 decreased EOC risk among patients older than 53 years old (adjusted OR=0.440, 95% CI=0.252-0.769, P=0.004), metastasis (adjusted OR=0.531, 95% CI=0.329-0.856, P=0.0094), no metastasis (adjusted OR=0.612, 95% CI=0.408-0.917, P=0.0174), clinical stage II (adjusted OR=0.416, 95% CI=0.221-0.78, P=0.0063), clinical stage III (adjusted OR=0.552, 95% CI=0.337-0.903, P=0.0180), high pathological grade (adjusted OR=0.596, 95% CI=0.400-0.887, P=0.0108), multiple tumor number (adjusted OR=0.604, 95% CI=0.384-0.950, P=0.0291), tumor size larger than 3 cm (adjusted OR=0.524, 95% CI=0.303-0.907, P=0.0209), tumor size ≤ 3 cm (adjusted OR=0.604, 95% CI=0.410-0.889, P=0.0105), pregnant times more than 3 times (adjusted OR =0.463, 95% CI=0.298-0.719, P=0.0006), post-menopause (adjusted OR=0.495, 95% CI=0.333-0.735, P=0.0005), high wild p53 expression (adjusted OR=0.531, 95% CI=0.366-0.770, P=0.0008), mutant p53 expression (adjusted OR=0.608, 95% CI=0.393-0.942, P=0.0258), without mutant p53 expression (adjusted OR=0.56, 95%CI=0.37-0.547, P=0.0061), negative/mild positive WT1 expression (adjusted OR=0.405, 95% CI=0.200-0.819, P=0.0119), high WT1 expression (adjusted OR=0.555, 95% CI=0.340-0.908, P=0.017), negative/mild positive P16 expression (adjusted OR=0.479, 95% CI=0.234-0.981, P=0.0443), negative/mild positive ki67 expression (adjusted OR=0.432, 95% CI =0.219-0.854, P=0.0157). In contrary, the METTL5 rs3769768 enhanced the risk of EOC in patients with metastasis (adjusted OR=4.965, 95% CI=1.598-15.421, P=0.0056), clinical stage 2 (adjusted OR=5.725, 95% CI=1.508-24.731, P=0.0103), low pathological grade(adjusted OR=5.803, 95%CI=1.779-18.923, P=0.0036), tumor size > 3 cm (adjusted OR=4.453, 95%CI=1.298-15.271, P=0.0175), post-menopause (adjusted OR=4.296, 95% CI=1.464-12.608, P=0.008), high wild p53 expression (adjusted OR=3.177, 95% CI=1.122-8.997, P=0.0296), no mutant p53 expression (adjusted OR=3.699, 95% CI=1.243-11.007, P=0.0187).
Association between inferred haplotypes of the m6A methyltransferases genes polymorphisms and EOC risk
We further evaluated if haplotypes of the METTL5 and METTL16 genes SNPs rs10190853 G>A, rs3769768 G>A, rs3769768 G>A, were linked to EOC risk. As shown in Table 3, the haplotypes GAG was characterized as reference group. The haplotypes AAA (adjusted OR=0.662, 95% CI=0.466-0.941, P=0.021) contributed to reduce the risk of EOC.
Expression quantitative trait loci (eQTL) analyses
We further assessed the potential functional relevance of five SNPs using released data from GTEx (https://www.gtexportal.org/home/index.html) while rs3769767 A>G, rs1056321 T>C, rs10190853 G>A, rs3769768 G>A, rs11869256 A>G were not significantly related to expression of METTL5, METTL16. However, the rs10190853 AA genotype reduced the expression of MYO3B in pituitary, which is a neighboring gene of METTL5 (Figure 1A), and the expression of another adjacent gene UBR3 in thyroid (Figure 1B).
Table 3
Association between inferred haplotypes of the METTL5, METTL16 genes and EOC risk.
| Haplotypesa | Cases (n=406) | Controls (n=610) | Crude OR (95% CI) | P | Adjusted OR (95% CI) | Pb |
|---|---|---|---|---|---|---|
| No.% | No.% | |||||
| GAG | 132 (32.51) | 201 (32.95) | 1.000 | 1.000 | ||
| AAG | 76 (18.72) | 92 (15.08) | 1.059 (0.738-1.521) | 0.754 | 1.034 (0.718-1.489) | 0.859 |
| AGA | 3 (0.74) | 6 (0.98) | 0.641 (0.158-2.600) | 0.534 | 0.696 (0.170-2.845) | 0.614 |
| AGG | 3 (0.74) | 5 (0.82) | 0.769 (0.181-3.263) | 0.722 | 0.944 (0.222-4.018) | 0.938 |
| GGG | 34 (8.37) | 53 (8.69) | 0.823 (0.512-1.321) | 0.419 | 0.833 (0.517-1.343) | 0.454 |
| AAA | 70 (17.24) | 136 (22.30) | 0.660 (0.466-0.936) | 0.020 | 0.662 (0.466-0.941) | 0.021 |
| GAA | 71 (17.49) | 105 (17.21) | 0.867 (0.605-1.243) | 0.437 | 0.865 (0.602-1.243) | 0.433 |
| GGA | 17 (4.19) | 12 (1.97) | 1.817 (0.846-3.903) | 0.126 | 1.942 (0.899-4.195) | 0.091 |
a The haplotypes order was rs3769767, rs1056321, rs10190853, rs3769768, and rs11869256.
b Obtained in logistic regression models with adjustment for ag
Figure 1
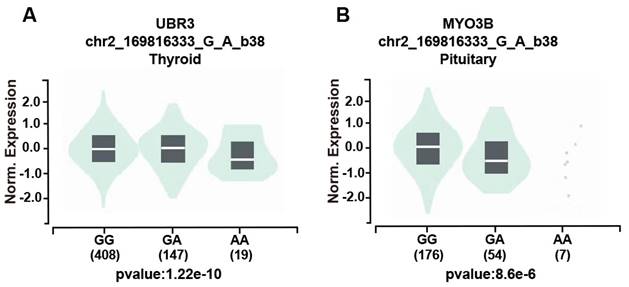
The effect of the rs10190853 gene and its adjacent gene UBR3 and MYO3B polymorphisms according to the GTEx public database. Different genotypes influence the expression of the rs10190853 gene and UBR3 and MYO3B in distinct organs and tissues. (A) The expression of UBR3 with different rs10190853 genotypes was shown in the thyroid. (B) The expression of MYO3B with different rs10190853 genotypes was shown in the pituitary.
Figure 2
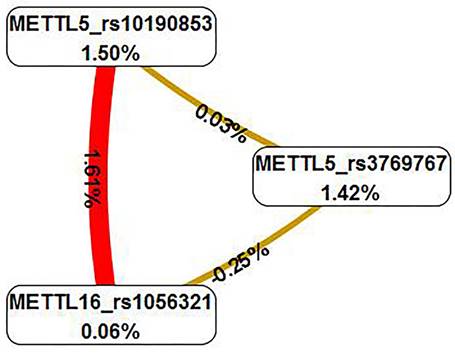
Interaction map for EOC risk. The interaction model describes the percentage of the entropy (information gain) that is explained by each factor or 2-way interaction. Positive entropy (plotted in red) indicates interaction, which can be interpreted as a synergistic or nonadditive relationship; while negative entropy (plotted in yellow-green or green) indicates independence or additivity (redundancy).
Table 4
Best multifactor dimensionality reduction interaction model
| Locus number | Number of the risk factors | Test Accuracy | CVC | OR | 95% CI | P |
|---|---|---|---|---|---|---|
| 1 | METTL5_rs3769767, METTL16_rs1056321, METTL5_rs10190853 | 0.6191 | 10/10 | 2.505 | 0.8889-7.0587 | 0.0793 |
a The model with the maximum testing accuracy and maximum CVC was considered the best.
SNP‑SNP interaction analysis
The multifactor dimensionality reduction analysis was conducted to verify the interaction of SNPs, which presented the interaction model of rs3769767 of the METTL5 gene, rs1056321 of the METTL16 gene, rs10190853 of the METTL5 gene, and a CVC values 10/10, test accuracy=0.6191, OR=2.505, 95% CI=0.8889-7.0587, P=0.0793 (Table 4). The interaction map showed the following interaction: METTL5_rs10190853 × METTL16_rs1056321, with high values of positive entropy or synergism (1.61%, shown in red); low entropy values mean redundancy or even independence (Figure 2).
Discussion
In our case-control study, 288 EOC patients and 361controls in South China were enrolled to reveal the latent connection between METTL5 and METTL16 gene polymorphisms and EOC risk. Three polymorphisms were demonstrated to link with the susceptibility of EOC, namely rs10190853 G>A, rs3769768 G>A, and rs11869256 A>G. Among these polymorphisms, rs10190853 G>A and rs11869256 A>G decreased the risk of EOC, while rs3769768 G>A enhanced the susceptibility of EOC. To our knowledge, it was the first time to explore the underlying relation of m6A methyltransferase gene METTL5 and METTL16 polymorphisms and susceptibility of EOC.
It was widely reported that m6A modification plays a significance role in the progression and prognosis of EOC. During the process of methylation, methyltransferases act as writers to regulate m6A methylation of mRNA[19]. Ribosomal RNA m6A METTL5 might influence the carcinogenesis of renal cancer through modifying the immune microenvironment[20]. Sun et al.[21] revealed that high expression of METTL5 was associated with poor prognosis of lung adenocarcinoma. As yet, no researches have revealed the association between METTL5 and EOC.
METTL16 promoted expression of branched-chain amino acid (BCAA), transaminase 1 (BCAT1) and BCAT2 through m6A-dependent manner and reprogramed BCAA metabolism in acute myeloid leukemia.[22] In 2022, Ye et al.[23] found that METTL16 inhibited ferroptosis to enhance the expression of GPX4, resulting in breast cancer progression. It was reported that METTL16 played a suppressor role in pancreatic adenocarcinoma by METTL16-p21 signaling axis.[23, 24] High expression of METTL16 predicted a poor outcome of soft-tissue sarcomas.[25] To date, only a limited number of studies have been conducted to elucidate the association between METTL16 and EOC, which have revealed compelling evidence suggesting that METTL16 may function as a tumor suppressor in the progression of EOC[10].
Wang et al.[26] reported that METTL5 mutant could lead to craniofacial neural development defects in mouse embryonic stem cell. Bi-allelic variants in METTL5 cause intellectual disability and microcephaly in human[27]. Copy number variation of METTL16 is abundant in bladder cancer patients with mutant TP53[28]. Inactivating frameshift mutation of METTL16 accelerate the tumorigenesis in colorectal cancer[29]. Nevertheless, no research has been exerted to clarify the association of METTL5, METTL16 polymorphisms and EOC. We predicted the location and function of these selected SNPs through online software SNP info. METTL5 rs10190853 G>A and rs3769768 G>A polymorphism were located in chromosome 2, which were predicted to be exon splicing enhancer or silencer, transcription factor binding sites, respectively. METTL16 rs11869256 A>G polymorphism was located in chromosome 17 and was predicted to be transcription factor binding sites. Our study proved that METTL5 rs10190853 GA phenotypes and METTL16 rs11869256 GA phenotypes decreased the risk of EOC, while METTL5 rs3769768 AA phenotypes was linked with enhancive susceptibility of EOC, which were different from the previous researches. It was likely to due to the METTL5 and METTL16 genetic variations function diversely on multiple cancers, and influence the progression of EOC through transcription modification.
P53 is a tumor suppressor involving in metabolism regulation and diverse aspects of differentiation and progression[30]. LGSOC usually express wild p53, while HGSOC is characterized by expression of mutant p53[31]. Abnormal p53 expression was related to poor prognosis of clear cell carcinoma[32]. It was reported that METTL5 could prevent mutant p53 from undergoing ubiquitination-dependent degradation through HSF4b/HSP90B1 pathway to facilitate nasopharyngeal carcinoma tumor progression[33]. There exist no researches conducted to verify the association between METTL5, METTL16 and expression of p53 in EOC patients. Wilms' tumor gene WT1 is a transcriptional regulator targeting genes[34]. WT1 acts as tumor-suppressor as well as oncogene in diverse cancers[35]. It was reported that WT1 could modify E-cadherin and ERK1/2 pathway to enhance the progression of ovarian cancer[36]. As far as we know, no researches have been conducted to reveal the association of METTL5, METTL16 and WT1 expression in EOC. Ki67 is a well-known proliferation marker and could be the target of cancer therapy[37]. It was reported that high expression of ki67 related to poor prognosis of EOC[38]. Our study found that the rs3769768 AA enhanced the EOC risk in patients with strong positive wild p53 expression and no mutant p53 expression. On the contrary, the rs10190853 AA played a decreased role in susceptibility of EOC in patients with negative/mild WT1 expression, which indicated that high expression of WT1 might be a marker for a poor prognosis of EOC. In addition, the rs10190853 AA allele reduced the expression of MYO3B in pituitary in eQTL analysis. It was reported that the polymorphisms of UBR3 and MYO3B were related to saccular intracranial aneurysm in Portugal[39]. UBR3 plays a stimulative role in intervertebral disc degeneration trough increase inflammation[40]. To date, there is a dearth of literature exploring the association between UBR3 and tumor diseases. MYO3B was reported that can facilitate the treatment of trastuzumab in HER2+ breast cancer[41].Up to now, no significant association has been identified between the polymorphism of the METTL5 gene and its neighboring genes UBR3 and MYO3B. We hypothesized that the decreased expression of MYO3B caused by the AA allele in METTL5 rs10190853 in the pituitary may relate to the hormone secretion of EOC. In our study, the rs11869256 AG/GG decreased the risk of EOC in patients with high expression of wild p53 and negative/mild expression of ki67. The MDR analysis presented no specific interaction of METTL5 and METTL16 polymorphism, so that they may affect the EOC independently. As far as we know, it was the first time to discover that METTL5, METTL16 polymorphisms were related to risk of EOC patients with expression of wild p53, WT1 and ki67, which might provide a new target of molecular therapy in EOC.
Following limitations could not be neglected in the present study. First of all, sample size was not adequate enough and larger sample size was required for further analysis. Secondly, the exact molecular mechanism of methyltransferase-like gene influencing the susceptibility of EOC was not explored. Finally, the association between methyltransferase-like gene polymorphisms and prognosis of EOC was not evaluated.
Conclusions
Our study proved that METTL5 rs10190853 GA phenotypes and METTL16 rs11869256 GA phenotypes decreased the risk of EOC, while METTL5 rs3769768 AA phenotypes was associated with increased susceptibility of EOC, indicating that METTL5, METTL16 might be a potential target of molecular therapy and prognosis marker.
Supplementary Material
Supplementary table.
Acknowledgements
This work was supported by grants from The Key R&D Program of Guangzhou (202206010006) and Basic Research Projects jointly funded by Universities/Hospitals (202201020640).
Author contributions
All authors contributed to data analysis, drafting or revising the article, gave final approval of the version to be published, agreed to the submitted journal, and agreed to be accountable for all aspects of the work.
Data availability statement
The data that support the findings of this study are available from the corresponding author upon reasonable request.
Competing Interests
The authors have declared that no competing interest exists.
References
1. Rongshou Z, Siwei Z, Hongmei Z. et al. Cancer incidence and mortality in China, 2016. J Nat Cancer Center. 2022;2:1-9
2. Kimberly DM, Leticia N, Theresa D, Angela BM, Yabroff KR, Ahmedin J. et al. Cancer treatment and survivorship statistics, 2022. CA: Cancer J Clin. 2022;72:409-436
3. A G-M, P H, A L. et al. Newly diagnosed and relapsed epithelial ovarian cancer: ESMO Clinical Practice Guideline for diagnosis, treatment and follow-up. Ann Oncol. 2023;34:833-848
4. Purab P, Kara Nicole S, Karen Held H, Dale Buchanan H. A Review of Principal Studies on the Development and Treatment of Epithelial Ovarian Cancer in the Laying Hen Gallus gallus. Comp Med. 2021;71:271-284
5. Daniel GR. Ovarian cancer: pathology, biology, and disease models. Front Biosci. 2009;14:2089-102
6. Luca F, Giuseppa S, Valentina L. et al. A multidisciplinary approach remains the best strategy to improve and strengthen the management of ovarian cancer (Review). International Journal of Oncology. 2021;59:53
7. Ting S, Ruiyan W, Liang M. The role of m6A RNA methylation in cancer. Biomed Pharmacotherapy. 2019;112:108613
8. Jialu G, Jianfeng Z, Huizhi Z, Jinyi T. RNA m6A methylation regulators in ovarian cancer. Cancer Cell Int. 2021;21:609
9. Li Y, Xin C, Xiang Q. et al. Comprehensive Analysis of the Transcriptome-Wide m6A Methylome in Endometrioid Ovarian Cancer. Front Oncol. 2022;12:844613
10. Li C, Qiao C, Ding H. et al. Clinical Significance of Methyltransferase-like 16 Expression in Epithelial Ovarian Cancer. J Coll Physicians Surge Pak. 2022;32:1576-1580
11. Juan Miguel B, Carlos B-B, Victoria F. et al. A common SNP in the UNG gene decreases ovarian cancer risk in BRCA2 mutation carriers. Molecular Oncology. 2019;13:1110-1120
12. Honglin S, Susan JR, Susanne Krüger K. et al. Association between invasive ovarian cancer susceptibility and 11 best candidate SNPs from breast cancer genome-wide association study. Hum Mol Gen. 2009;18:2297-304
13. Lin A, Zhou M, Hua R, et al. METTL3 polymorphisms and Wilms tumor susceptibility in Chinese children: A five-center case-control study.J Gene Med. 2020; 22: e3255
14. Chen H, Chen Z, Wang M. et al. METTL14 gene polymorphisms influence hepatoblastoma predisposition in Chinese children: Evidences from a seven-center case-control study. Gene. 2022;809:146050
15. Tang J, Lu H, Yang Z. et al. Associations between WTAP gene polymorphisms and neuroblastoma susceptibility in Chinese children. Transl Pediatr. 2021;10:146-52
16. Zhen X, Zhao W, Wang J. et al. Genetic Variations Within METTL16 and Susceptibility to Sudden Cardiac Death in Chinese Populations With Coronary Artery Disease. Am J cardiol. 2023;202:90-99
17. Phelan C, Kuchenbaecker K, Tyrer J. et al. Identification of 12 new susceptibility loci for different histotypes of epithelial ovarian cancer. Nat Genet. 2017;49:680-691
18. Fernández-Torres J, Martínez-Nava GA, Zamudio-Cuevas Y. et al. Multifactor dimensionality reduction reveals a strong gene-gene interaction between STC1 and COL11A1 genes as a possible risk factor of knee osteoarthritis. Mol Bio Rep. 2020;47:2627-34
19. Sendinc E, Shi Y. RNA m6A methylation across the transcriptome. Molecular cell. 2023;83:428-441
20. Wei Z, Chen Y, Zeng Z. et al. The novel m6A writer METTL5 as prognostic biomarker probably associating with the regulation of immune microenvironment in kidney cancer. Heliyon. 2022;8:e12078
21. Sun S, Fei K, Zhang G. et al. Construction and Comprehensive Analyses of a METTL5-Associated Prognostic Signature With Immune Implication in Lung Adenocarcinomas. Frontiers in genetics. 2021;11:617174
22. Han L, Dong L, Leung K. et al. METTL16 drives leukemogenesis and leukemia stem cell self-renewal by reprogramming BCAA metabolism. Cell stem cell. 2023;30:52-68
23. Ye F, Wu J, Zhang F. METTL16 epigenetically enhances GPX4 expression via m6A modification to promote breast cancer progression by inhibiting ferroptosis. Biochem Biophys Res Commun. 2023;638:1-6
24. Xie F, Zheng Y, Fu W. et al. The m6A methyltransferase METTL16 inhibits the proliferation of pancreatic adenocarcinoma cancer cells via the p21 signaling pathway. Frontiers in oncology. 2023;13:1138238
25. Hou M, Guo X, Chen Y. et al. A Prognostic Molecular Signature of N⁶-Methyladenosine Methylation Regulators for Soft-Tissue Sarcoma from The Cancer Genome Atlas Database. Med Sci Monit. 2020;26:e928400
26. Lu W, Yu L, Rongzhi L, Qiuchan X. et al. Mettl5 mediated 18S rRNA N6-methyladenosine (m6A) modification controls stem cell fate determination and neural function. Genes & Diseases. 2022;9:268-74
27. Richard E, Polla D, Assir M. et al. Bi-allelic Variants in METTL5 Cause Autosomal-Recessive Intellectual Disability and Microcephaly. Am J Hum Genet. 2019;105:869-878
28. Xiaoshuai W, Jingwei Y, Jinbao C. et al. Copy number variation analysis of m6A regulators identified METTL3 as a prognostic and immune-related biomarker in bladder cancer. Cancer Medicine. 2021;10:7804-15
29. Yeon S, Jo Y, Choi E. et al. Frameshift Mutations in Repeat Sequences of ANK3, HACD4, TCP10L, TP53BP1, MFN1, LCMT2, RNMT, TRMT6, METTL8 and METTL16 Genes in Colon Cancers. Pathol Oncol Res. 2018;24:617-22
30. Karen HV, Carol P. Blinded by the Light: The Growing Complexity of p53. Cell. 2009;137:413-31
31. Bryce W, Katherine Redd B, Phong L, Carol SL. The Challenges and Prospects of p53-Based Therapies in Ovarian Cancer. Biomolecules. 2023;13:159
32. Köbel M, Kang E, Weir A, Nelson G. et al. p53 and ovarian carcinoma survival: an Ovarian Tumor Tissue Analysis consortium study. J Pathol Clin Res. 2023;9:208-222
33. Chen B, Huang Y, He S. et al. N6-methyladenosine modification in 18S rRNA promotes tumorigenesis and chemoresistance via HSF4b/HSP90B1/mutant p53 axis. Cell Chem Biol. 2023;30:144-58
34. Wen Chin L, Chi C, Tian HC. et al. WT1: The Hinge Between Anemia Correction and Cancer Development in Chronic Kidney Disease. Front Cell Dev Biol. 2022;10:876723
35. Sugiyama H. WT1 (Wilms' tumor gene 1): biology and cancer immunotherapy. Jpn J Clin Oncol. 2010;40:377-87
36. Han Y, Song C, Zhang T. et al. Wilms' tumor 1 ( WT1) promotes ovarian cancer progression by regulating E-cadherin and ERK1/2 signaling. Cell cycle. 2020;19:2662-2675
37. Yang C, Zhang J, Ding M. et al. Ki67 targeted strategies for cancer therapy. Clin Transl Oncol. 2018;20:570-5
38. Liu P, Sun Y, Du J. et al. CD105/Ki67 coexpression correlates with tumor progression and poor prognosis in epithelial ovarian cancer. Int J Gynecol Cancer. 2012;22:586-92
39. Patricia A, Mm S, I S. et al. Genetic Variants Underlying Risk of Intracranial Aneurysms: Insights from a GWAS in Portugal. PloS one. 2015;10:e1033422
40. Zhenhuan J, Qinghua Z, Liang C. et al. UBR3 promotes inflammation and apoptosis via DUSP1/p38 pathway in the nucleus pulposus cells of patients with intervertebral disc degeneration. Hum Cell. 2022;35:792-802
41. Lapin V, Shirdel EA, Wei X, Mason JM, Jurisica I, Mak TW. Kinome-wide screening of HER2+ breast cancer cells for molecules that mediate cell proliferation or sensitize cells to trastuzumab therapy. Oncogenesis. 2014;3:e133
Author contact
![]() Corresponding authors: Yingyi Xu: xuyingyiedu.cn; Lisha Yi: e_yutingcom.
Corresponding authors: Yingyi Xu: xuyingyiedu.cn; Lisha Yi: e_yutingcom.
Citation styles
APA
Zhang, S., Liu, S., Chen, W., Yan, Y., Cai, M., Liu, X., Luo, A., Li, W., Yi, L., Xu, Y. (2024). Gene polymorphisms of METTL5 and METTL16 are related to epithelial ovarian cancer risk in South China: A three-center case-control study. Journal of Cancer, 15(6), 1762-1769. https://doi.org/10.7150/jca.90379.
ACS
Zhang, S.; Liu, S.; Chen, W.; Yan, Y.; Cai, M.; Liu, X.; Luo, A.; Li, W.; Yi, L.; Xu, Y. Gene polymorphisms of METTL5 and METTL16 are related to epithelial ovarian cancer risk in South China: A three-center case-control study. J. Cancer 2024, 15 (6), 1762-1769. DOI: 10.7150/jca.90379.
NLM
Zhang S, Liu S, Chen W, Yan Y, Cai M, Liu X, Luo A, Li W, Yi L, Xu Y. Gene polymorphisms of METTL5 and METTL16 are related to epithelial ovarian cancer risk in South China: A three-center case-control study. J Cancer 2024; 15(6):1762-1769. doi:10.7150/jca.90379. https://www.jcancer.org/v15p1762.htm
CSE
Zhang S, Liu S, Chen W, Yan Y, Cai M, Liu X, Luo A, Li W, Yi L, Xu Y. 2024. Gene polymorphisms of METTL5 and METTL16 are related to epithelial ovarian cancer risk in South China: A three-center case-control study. J Cancer. 15(6):1762-1769.
This is an open access article distributed under the terms of the Creative Commons Attribution License (https://creativecommons.org/licenses/by/4.0/). See http://ivyspring.com/terms for full terms and conditions.