Journal of Cancer
ISSN: 1837-9664
3.2
Impact Factor
ISSN: 1837-9664

 Global reach, higher impact
J Cancer 2017; 8(7):1113-1122. doi:10.7150/jca.17872 This issue Cite
Research Paper
A Combined ULBP2 and SEMA5A Expression Signature as a Prognostic and Predictive Biomarker for Colon Cancer
Secil Demirkol1, Ismail Gomceli2, Murat Isbilen1, Baris Emre Dayanc3, Mesut Tez4, Erdal Birol Bostanci5, Nesrin Turhan6, Musa Akoglu5, Ezgi Ozyerli1, Sevi Durdu1, Ozlen Konu1, Aviram Nissan6, Mithat Gonen8, Ali Osmay Gure1 ![]()
1. Department of Molecular Biology and Genetics, Bilkent University, Cankaya, Ankara, Turkey;
2. Department of Gastroenterological Surgery, Antalya Education and Research Hospital, Antalya, Turkey;
3. Faculty of Medicine, Izmir University of Economics, Izmir, Turkey;
4. Fifth Department of Surgery, Ankara Numune Training and Research Hospital, Ankara, Turkey;
5. Department of Gastroenterological Surgery, Yuksek Ihtisas Training and Research Hospital, Ankara, Turkey;
6. Department of General and Oncological Surgery - Surgery C, The Chaim Sheba Medical Center, Tel Hashomer, Israel;
7. Department of Pathology, Yuksek Ihtisas Training and Research Hospital, Ankara, Turkey;
8. Department of Epidemiology and Biostatistics, Memorial Sloan Kettering Cancer Center, New York, NY, USA.
Received 2016-10-11; Accepted 2017-3-5; Published 2017-4-9
Citation:
Demirkol S, Gomceli I, Isbilen M, Dayanc BE, Tez M, Bostanci EB, Turhan N, Akoglu M, Ozyerli E, Durdu S, Konu O, Nissan A, Gonen M, Gure AO. A Combined ULBP2 and SEMA5A Expression Signature as a Prognostic and Predictive Biomarker for Colon Cancer. J Cancer 2017; 8(7):1113-1122. doi:10.7150/jca.17872. https://www.jcancer.org/v08p1113.htm
Other stylesAbstract
Background: Prognostic biomarkers for cancer have the power to change the course of disease if they add value beyond known prognostic factors, if they can help shape treatment protocols, and if they are reliable. The aim of this study was to identify such biomarkers for colon cancer and to understand the molecular mechanisms leading to prognostic stratifications based on these biomarkers.
Methods and Findings: We used an in house R based script (SSAT) for the in silico discovery of stage-independent prognostic biomarkers using two cohorts, GSE17536 and GSE17537, that include 177 and 55 colon cancer patients, respectively. This identified 2 genes, ULBP2 and SEMA5A, which when used jointly, could distinguish patients with distinct prognosis. We validated our findings using a third cohort of 48 patients ex vivo. We find that in all cohorts, a combined ULBP2/SEMA5A classification (SU-GIB) can stratify distinct prognostic sub-groups with hazard ratios that range from 2.4 to 4.5 (p≤0.01) when overall- or cancer-specific survival is used as an end-measure, independent of confounding prognostic parameters. In addition, our preliminary analyses suggest SU-GIB is comparable to Oncotype DX colon(®) in predicting recurrence in two different cohorts (HR: 1.5-2; p≤0.02). SU-GIB has potential as a companion diagnostic for several drugs including the PI3K/mTOR inhibitor BEZ235, which are suitable for the treatment of patients within the bad prognosis group. We show that tumors from patients with worse prognosis have low EGFR autophosphorylation rates, but high caspase 7 activity, and show upregulation of pro-inflammatory cytokines that relate to a relatively mesenchymal phenotype.
Conclusions: We describe two novel genes that can be used to prognosticate colon cancer and suggest approaches by which such tumors can be treated. We also describe molecular characteristics of tumors stratified by the SU-GIB signature.
Keywords: Colon Cancer, Prognosis, Biomarker.
Introduction
Foreseeing the prognosis of colon cancer patients, especially those with stage II or III disease is critical as it will change treatment decisions. In addition to known prognostic factors, such as stage, mismatch repair proficiency, Kras and Braf mutation status, various prognostic assays based on molecular signatures have been developed as clinical tests (e.g. Oncotype DX colon, ColoPrint). A recent report that evaluated most oncological prognostic tests, including those for colon cancer, highlighted various deficiencies in discovery and validation studies [1]. These include the lack of complete multivariate analyses where all prognostic factors are considered, lack of an evaluation of all survival measures, including overall survival, disease-free survival and response to therapy, and lack of validation in multiple cohorts. These criteria, as well as the possibility of using the test “in house” at minimum cost are considered essential in expediting the utilization of a molecular test in the clinic. We planned this study aiming to address most of these issues utilizing an in silico approach to identify a minimum number of prognostic genes and performed ex vivo as well as in silico validation studies with multiple cohorts. Our results suggest that the joint evaluation mRNA expression of two novel genes, ULBP2 and SEMA5A in colon cancer tumor tissue can identify patients with good, intermediate and bad prognosis, independent of stage, K-ras/B-raf mutation, and mismatch repair status. As prognostic signatures are considered valuable especially if they can predict response to therapy, we searched for therapeutic agents that would be suitable for the treatment of those patients with a predicted bad prognosis. Our results indicate that the PI3K/mTOR inhibitor NVP-BEZ235 is such a drug. At a molecular level, we find that tumors from patients with bad prognosis have decreased EGFR-Y1068 phosphorylation and increased Caspase 7 cleavage, together with up-regulation of inflammatory cytokines; in line with our findings showing such tumors are more mesenchymal, as opposed to epithelial in character.
Methods
Study cohorts
Patient characteristics of the 4 cohorts used in this study are summarized in Table S1 and Table S2. Datasets with gene expression data from 177 and 55 tumor tissues (GSE17536 and GSE17537) were used as discovery cohorts [2]. Median survival times for patients within the GSE17536 and -37 cohorts were 42.2 (0.9-142.6) and 41.7 (0.4-70.5) months respectively. For ex vivo validation of biomarkers of overall survival (OS) we used tumor tissues obtained from a third cohort (Ankara) consisting of 46 patients with a pathological diagnosis of colon cancer, collected at the Department of Gastroenterological Surgery, Yuksek Ihtisas Training and Research Hospital, Ankara, Turkey, following informed consent obtained from all patients. Information regarding overall survival time, follow-up status, age, gender, TNM stage, grade, perineural invasion and vascular invasion were available for all patients. Representative images from tumor sections are shown in Figure S1. Follow up times ranged from 1 to 49 months. Median survival was 23 months for this cohort, as most patients had stage III disease. For genes that associated with OS, association with disease-free survival (DFS) was assessed in silico using the aforementioned datasets in addition to a third: GSE39582, which included data from 566 patients [3].
In silico methods
Microarray data analysis
Gene expression data of tumor datasets were downloaded from GEO (http://www.ncbi.nlm.nih.gov/geo) and GC-RMA normalized without baseline transformation using GeneSpring v12.0. Clinical data related to these were downloaded from ArrayExpress (http://www.ebi.ac.uk/arrayexpress). For cell line gene expression analysis GSE36133 (Cancer Cell Line Encyclpedia) [4] and E-MTAB-783 (Cancer Genome Project) [5] datasets were downloaded from ArrayExpress and RMA normalized using GeneSpring v12.0.
Semisupervised survival analysis tool (SSAT)
This analysis aims the identification of probesets that can stratify patients into 2 groups with significantly different survival times as assessed by the log-rank test when a cut-off value of either 2, 4, 6, 8, 10, 12 or 14 (log2 expression data) is used. Thus, 7 different log-rank tests were performed for each probeset using an R (Bioconductor) based script. For a given probeset, the cut-off value with the lowest p value was used for further analyses. For GSE17536, SSAT could identify 24 of 48 genes that were previously validated as prognostic biomarkers for colon cancer [6]. Among significant genes, those that gave hazard ratios (HR) in opposite direction between two analyses (GSE17536 and GSE17527) were 0%, 5%, and 12.5% for the first 10, 20, and 40 most significant genes, respectively.
Oncotype Dx colon risk group assignment
Recurrence risk was calculated based on the expression of 7 test and 5 control genes, and each sample assigned to either a low or high risk group as previously described [3]
Microarray based microsatellite instability determination
Affymetrix probesets corresponding to a genomic signature that identifies colorectal cancer patients with MSI [7] available in the HGU 133A platform were identified. The median expression values of these probesets were calculated for samples within the GSE41258 human colon cancer dataset for MSI-high or -low, versus MSS subgroups, as the MSI status of samples in this dataset are known. These median values were then used as reference centroids for the classification of samples in GSE26682 (HGU133 Plus 2.0) and GSE17536 (HGU133A) datasets. A correlation based classification was performed using the reference median values (MSI and MSS median values of 46 probesets) and the expression values for each test sample. The difference between MSI and MSS correlation values were used to generate a MSI index value for each sample. A threshold index value (0.45) that gave the maximum accuracy in both platforms was determined based on a ROC analysis. Samples with index values above 0.45 were classified as MSI, or MSS if the value was equal or below this threshold.
TCGA based expression and proteomic analyses
Level 3 RNA seq. and level 3 proteome data for 132 colon cancer primary tumor tissues were downloaded from cancergenome.nih.gov via the TCGA data portal. Tumors were classified according to the SU-GIB signature using median gene expression values as thresholds for both ULBP2 and SEMA5A, yielding 37, 55 and 40 samples with good (G), intermediate (I) and bad (B) prognosis, respectively. ANOVA test was used to identify proteins with significantly different expression between groups, based on the RPPA data. ANOVA based differences in expression of inflammatory cytokines were identified using level 3 RNA-seq. data of TCGA.
RT-PCR
Total RNA was extracted from either snap-frozen tissue using Trizol reagent (Ambion, Foster City, CA, USA) following the manufacturers protocol. Following DNase I treatment using the DNA-free™Kit (Ambion, Foster City, CA, USA), total RNA concentration and purity were measured using Nanodrop spectrophotometer ND-1000 (Thermo Scientific, MA, USA). 500 ng RNA was reverse transcribed into cDNA using Revert-aid first strand cDNA synthesis kit (Thermo Fisher Scientific, Boston, MA, USA) using random primers following the suggested protocol.
All Quantitative-PCR experiments except for ULBP2 were performed using SYBR Green technology (Applied Biosystems, CA, USA). Custom designed Taqman primers & probes were used for quantification of ULBP2 in frozen tissues (Hs00607609_mH). GAPDH and ACTB were used as reference genes (4352934E, 4352935E) [8] [9]. Primers used for SYBR Green experiments are given in Table S3. Q-PCR was performed in a ABI 7500 Real Time PCR System (Applied Biosystems, Carlsbad, CA, USA) using either Taqman universal master mix (Applied Biosystems, Carlsbad, CA, USA) or Power SYBR Green master mix (Applied Biosystems, Carlsbad, CA, USA), according to manufacturer`s protocols. Thermal conditions were 50°C for 2 min for UNG enzyme activity, an initial denaturation stage of 95°C for 10 min., followed by 45 cycles of 95°C 15 sec. denaturation, 60°C 1 min. of annealing and extension. Data was analyzed using ABI 7500 Software v2.0.4 and gene expression normalized to two control genes GAPDH, ACTB for Taqman experiments and three control genes GAPDH, ACTB, 18S for SYBR Green. All experiments were repeated at least 3 times for each reaction. Gene expression was quantified using the 2-ΔΔCT method [10].
Statistical methods
Statistical analyses were performed using Graph Pad Prism 6 (GraphPad Prism 6 Software, San Diego, CA, USA) or SPSS Statistics v.19 (IBM, 2010, Chicago, IL, USA). P values below 0.05 were considered statistically significant. ANOVA tests were used to determine differences among multiple groups when comparing gene expression, or cytotoxicity. Kaplan-Meier plots and the log-rank test were utilized to determine significance in survival differences among prognostic groups. Univariate and multivariate cox proportional hazards regression analysis was performed using SPSS Statistics v.19.
Results
Identifying prognostic biomarkers for colon cancer with cancer-specific (CSS) or overall survival (OS) as end-point measures
We generated an R based tool (semi-supervised survival analysis tool: SSAT) to discover genes whose expression correlated with survival (see Methods). SSAT analysis of two colon cancer datasets, GSE17536 and GSE17527, revealed 400 and 269 genes respectively, which could generate a statistically significant stratification using at least at one of the 7 SSAT defined thresholds. Among these, 64 probesets were common to both datasets, had HRs in the same direction and shared the same threshold value for both cohorts and therefore were studied further. Probesets were ranked from the most to the least significant and 20 with the lowest weighted ranksum values were included in a multivariate model (MVA) that included stage as a confounding factor using GSE17536 cancer-specific survival data (Table S4). The MVA identified 3 probesets/genes as independent prognostic biomarkers of cancer-specific survival (Table S5). The same analysis was then performed using these 3 probesets and stage for GSE17537; which revealed that other than stage, ULBP2 and SEMA5A were independent prognostic biomarkers for colon cancer when all stages were included in the analysis (Figure S2, Figure S3 and Table S5) as well as when only stage 2 and 3 patients were evaluated (Figure S4). ULBP2 and SEMA5A gene expression were also found to be linearly associated with cancer specific survival (Table S6). To generate a combined gene signature for prognosis prediction we used SSAT identified cut-off values and classified SEMA5A-high and ULBP2-low patients as those with good prognosis (G), while the reverse predicted bad (B), and the rest, patients with intermediary (I) prognosis. This “SU-GIB” stratification was a highly significant prognostic classifier for both cohorts (Figure 1), independent of confounding factors (Table 1). To validate these findings ex vivo we used tumor tissue from a third cohort of patients with colon cancer for which overall survival time was available as an end-point measure (Table S1). The median expression value for SEMA5A and ULBP2 mRNA levels, as determined by Q-PCR was used to stratify these patients into good and bad prognosis groups. Similar to our in silico findings, this identified distinct prognostic groups when all stages were included in the analysis (Figure S5), as well as for patients with stage 2 and 3 disease (Figure S6); and the SU-GIB stratification revealed significantly distinct prognostic subgroups when qPCR data was used (Figure 1). Finally, a MVA that included grade, stage, age, gender and the SU-GIB classification showed that the SEMA5A/ULBP2 based stratification could predict prognosis independent of confounding factors (Table 1). The stage independence of SU-GIB classification is preserved when only stage II&III patients were included into analysis (Table S7).
As DNA mismatch repair (MMR) status of colon cancer can be a prognostic factor, we asked if SU-GIB would further stratify patients with and without microsatellite instability (MSI). For this purpose we predicted the MSI status of samples within the GSE17536 dataset and performed SU-GIB stratification for both MSI and MSS samples. This revealed a significant difference between prognostic groups in MSS patients. Although the trend was in the expected direction for the MSI group, log-rank test did not show a significance, probably due to a low sample size (Figure S7). In summary, our results suggest that SU-GIB stratification can predict sub groups of patients with differing prognosis, independent of confounding factors.
SU-GIB and disease-free survival (DFS)
SU-GIB stratification identified 3 significantly distinct prognostic groups when DFS was used as an end-point measure in both GSE17536 and GSE17537 datasets (Figure S8). When MSI and MSS stable groups were analyzed separately a significant stratification for patients especially with MSS tumors could be seen (Figure 2). This was significant for stage 2 patients, but was also evident (albeit not significant) for stage 3 patients (Figure 3). As the GSE39582 dataset contains KRAS and BRAF mutation data, we included this information in a MVA that included additionally SU-GIB and stage. In this model, mutational status was not an independent prognostic predictor among patients with MSS tumors (Table S8).
Figure 1
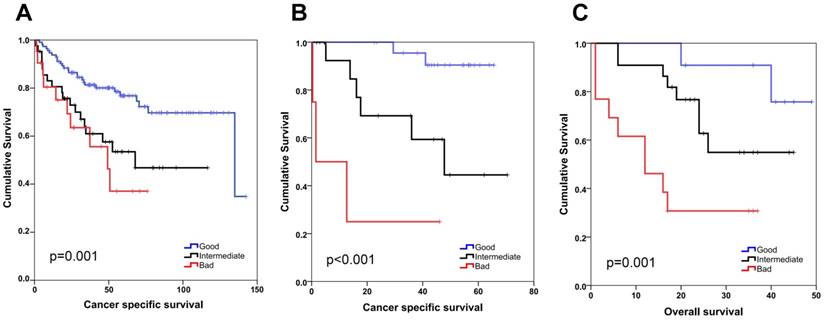
SEMA5A/ULBP2 (SU) gene signature for colon cancer prognostication. Kaplan-Meier graphs based on the SU signature for GSE17536 (A), GSE17537 (B) and the Ankara cohort (C), and their respective log-rank p values are shown. Survival times are in months. A combined score based on ULBP2 and SEMA5A expression that separates patients into good (SEMA5A high, ULBP low), bad (SEMA5A low, ULBP high) and intermediate (patients with both SEMA5A and ULBP2 high or both low) groups results in better stratification of colon cancer patients. ULBP2 and SEMA5A cut-off values were 4 and 6, respectively for in silico analyses. For the Ankara cohort, cut-off values correspond to the median expression value for both genes.
Table 1
Multivariate analysis of clinicopathological parameters and SU-GIB
| GSE17536 - CSS | Hazard Ratio | 95%CI | P* |
|---|---|---|---|
| Grade** | 1.165 | 0.685 - 1.979 | 0.573 |
| Stage† | 5.028 | 3.133 - 8.068 | <0.001 |
| Age (above 65 vs equal to or below 65) | 0.818 | 0.455 - 1.467 | 0.500 |
| Gender (female vs. male) | 1.018 | 0.567 - 1.831 | 0.951 |
| MSI_transcription based (stable vs. instable) | 1.319 | 0.558 - 3.119 | 0.529 |
| SU-GIB# | 2.452 | 1.616 - 3.720 | <0.001 |
| GSE17537 - CSS | Hazard ratio | 95% CI | P* |
| Stage† | 13.662 | 2.769 - 67.400 | 0.001 |
| Age (equal to or below 65 vs. above 65) | 1.370 | 0.292 - 6.434 | 0.690 |
| Gender (female vs. male) | 0.924 | 0.183 - 4.668 | 0.924 |
| SU-GIB# | 4.502 | 1.557 - 13.017 | 0.005 |
| Ankara Cohort - OS | Hazard ratio | 95% CI | P* |
| Grade** | 1.171 | 0.409 - 3.358 | 0.769 |
| Stage‡ | 4.481 | 1.597 - 12.574 | 0.004 |
| Age (above 65 vs equal to or below 65) | 2.300 | 0.857 - 6.174 | 0.098 |
| Gender (female vs. Male) | 1.062 | 0.407 - 2.775 | 0.902 |
| SU-GIB# | 3.481 | 1.514 - 8.004 | 0.003 |
*Cox proportional hazards regression
**Grade: Treated as a continuous variable; Poorly differentiated (1), moderately differentiated (2), well differentiated (3)
†Stage: Treated as a continuous variable (1, 2, 3, 4)
‡Stage: Treated as a continuous variable (1: stage 1, 2: stage 3A and 3B, 3: stage 3C and 4:stage 4)
# SU-GIB: Treated as a continuous variable (1:Good, 2:Intermediate, 3:Bad)
Figure 2
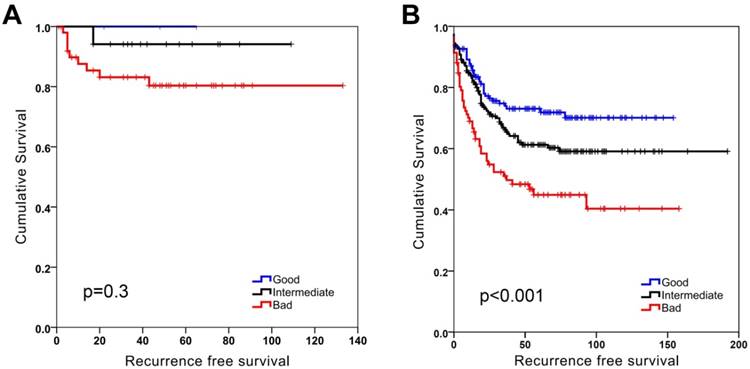
SU-GIB can predict recurrence-free survival especially for microsatellite stable patients in GSE39582. Kaplan-Meier graphs of microsatellite instable (MSI, A) and stable (MSS, B) patients stratified independently using SU-GIB, and log-rank p values are shown. Cut-off values for both genes were the most significant within the 25th and 75th interquartile range.
SU-GIB prediction compared to other molecular classifiers
Among several prognostic molecular classifiers for colon cancer, Oncotype DX colon cancer (Oncotype) developed to predict recurrence [6], is one that can be applied to microarray expression data [3]. We, therefore, tested how the SU-GIB classification would compare to the Oncotype score for colon cancer patients with stage II or III disease. A MVA that included age, gender, stage, tumor grade, MSI status and the prognostic tests revealed that both SU-GIB or Oncotype were independent prognostic classifiers for DFS in cohorts GSE17536 and GSE39582 (Table S9). When SU-GIB and Oncotype were both included in the MVA for GSE39582, SU-GIB was still an independent significant prognostic parameter when Oncotype was not, suggesting that the two tests identify mostly overlapping prognostic sub-groups (Table S10). We also asked if the SU-GIB classifier could stratify colon cancer patient groups as identified by Marisa et al., which is a functional classification with 6 molecularly distinct subtypes (C1-6). We find that SU-GIB can distinguish 3 groups within all categories. However, C1 (DMMR) and C5 (CINwntup) contained the largest number for G tumors, whereas the CSC group (C2) contained the largest number of B samples.
Overall, we find that the SU-GIB classification is as powerful as Oncotype in predicting patients with recurrence and could be useful even for colon cancer subtypes sub-grouped based on given gene expression signatures.
Molecular characteristics of G, I and B tumors
The Cancer Genome Atlas (TCGA) database contains protein as well as RNA based expression data for tumors. We, therefore, asked if the SU defined prognostic groups differed in terms of signaling pathways as could be determined by an analysis of the TCGA reverse-phase protein expression data (RPPA). When tumors corresponding to SU-G, I and B groups were compared, we found that “G” tumors showed significantly increased EGFR Y1068, Y992 and Shc Y317 phosphorylation, while cleaved (activated) Caspase 7 levels were increased in “B” tumors (Figure 4 and S9). As Caspase 7 activation promotes NFkB target activation [11], we asked if inflammatory cytokines were transcriptionally upregulated in such tumors. Indeed, several inflammatory cytokines, including IL6, IL1β, TGFβ1, TGFβ3, IL1R2, and TNFα were upregulated among B tumors (Figure 5 and S10). Inflammation has been associated with epithelial-to-mesenchymal transition (EMT) in several tumors including colon cancer [12]. When tumors with G, I and B genotypes as determined for the GSE36582 dataset were analyzed for Vimentin and E-cadherin expression (mesenchymal and epithelial markers, respectively), we observed that the majority of “G” tumors are epithelial in nature while “B” tumors are mostly mesenchymal when “I” tumors show an intermediary phenotype (Figure S11). We, therefore, conclude that the SU-GIB classification identifies tumor subgroups that differ in terms of EGFR signaling, inflammation and EMT-related characteristics.
Figure 3
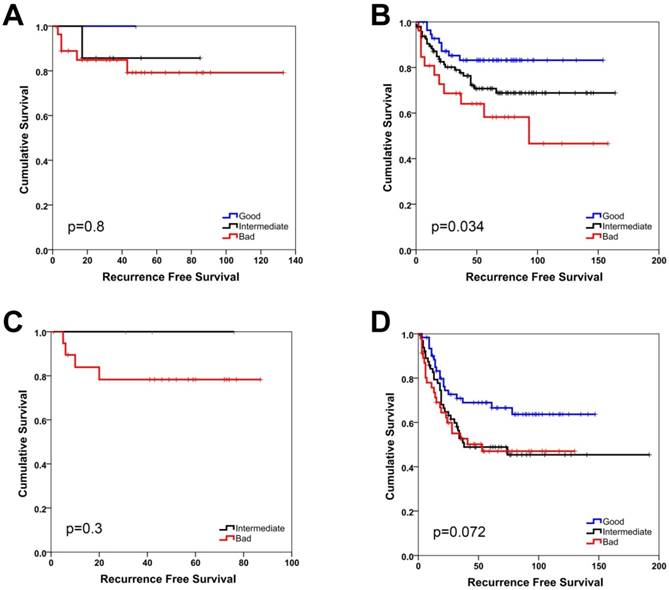
SU-GIB can predict recurrence-free survival for micosatellite stable patients with stage 2 or 3 disease in GSE39582. Kaplan-Meier graphs and log-rank p values are shown for stage 2 (A, B) and 3 (C, D) patients with microsatellite instable (A, C) and stable (B, D) tumors. Cut-off values for both genes were the most significant within the 25th and 75th interquartile range.
Figure 4
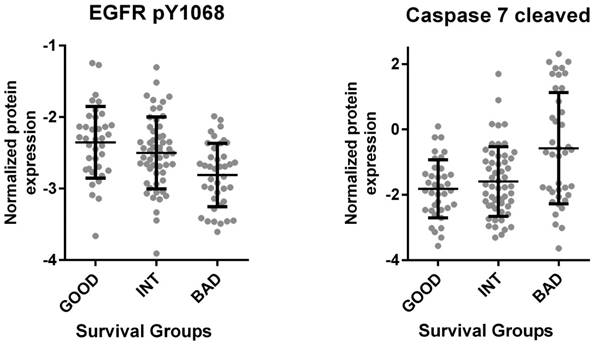
TCGA based proteome analysis of colon cancer tumor tissue reveals increased EGFR phosphorylation and decreased Caspase 7 cleavage in the good prognosis group. RNA seq. and proteome data for 132 colon cancer primary tumor tissues downloaded from “cancergenome.nih.gov” via the TCGA data portal classified according to the SU signature (bad survivors: 40, good survivors: 37, intermediate survivors: 55) revealed increased EGFR 1068 phosphorylation among patients with better prognosis (p<0.001, 1-way Anova) (left). The same analysis showed increased Caspase 7 cleavage in patients within the worse survival group (p<0.0001) (right). Caspase 7 cleavage was directly correlated with ULBP2 and inversely with SEMA5A expression (p<0.001 for both genes by Pearson's r). The mean and standard deviation for each group are indicated.
Figure 5
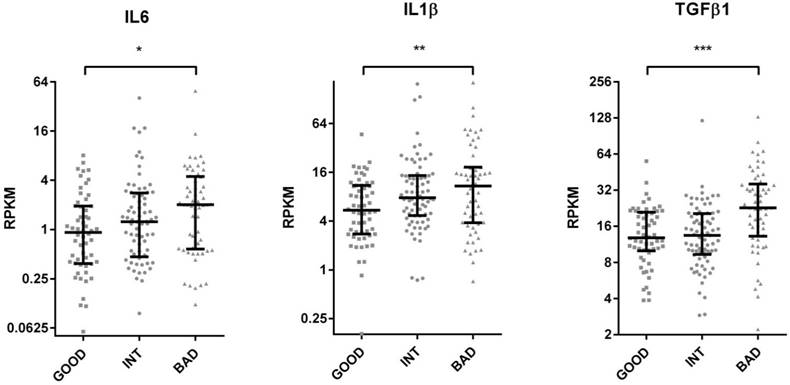
TCGA based RNA seq. analysis of colon cancer tumor tissue reveals increased inflammatory cytokine gene expression in the bad prognosis group. TCGA colon tumor samples were stratified into GIB groups using median expression values as cut-offs for ULBP2 and SEMA5A. RPKM values of IL6, IL1B, TGFB1 are plotted for “good”, “intermediate” and “bad” groups. T-test p values between “good” and “bad” groups. *p < 0.05, **p <0.01, ***p <0.0001. RPKM: reads per kilobase per million mapped reads. The median and inter-quartile ranges for each group are indicated.
SU-GIB as a potential predictor of drug responsiveness
As prognostic classifiers are especially valuable if they can also predict response to therapy we aimed to identify drugs that would be suitable for the treatment of especially the bad prognosis group as identified by SU-GIB. For this purpose, we correlated IC50 values of all drugs tested for colon cancer cell lines in the CGP database [5] with SEMA5A and ULBP2 expression, and identified 13 drugs whose IC50 values showed significant direct and inverse correlations with SEMA5A and ULBP2 expression, respectively (Table S11). Among these drugs, the most significant correlation with both genes in the expected direction was for the PI3K/mTOR inhibitor NVP-BEZ235 (Figure 6), suggesting that the SU-GIB stratification can possibly be utilized as a companion diagnostic test of sensitivity for a variety of drugs.
Figure 6
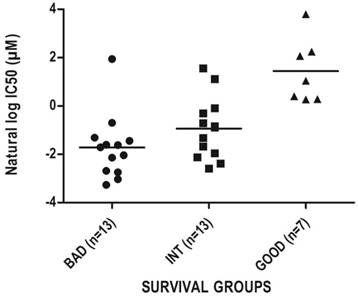
Chemosensitivity profiles of colon cancer cell lines corresponding to SU-G, -I and -B phenotypes. In silico analysis of colon cancer cell lines as classified by the SU signature into G, I or B phenotypes for NVP-BEZ235 cytotoxicity based on CGP data. Cut-off values used to generate a SU-GIB stratification were either the SSAT generated (SEMA5A) or the median expression values (ULBP2).
Discussion
Despite the availability of a large number of molecular tests capable of determining prognosis of colon cancer patients, very few have progressed beyond diagnostic and initial validation studies. An extensive report by the US Department of Health and Human Services which reviewed prognostic tests for cancer highlighted critical aspects that would have to be considered in the design of future discovery and validation studies, to help speed their introduction into routine clinical practice [1]. As the report emphasized the use of different patient cohorts, we designed this study to include multiple cohorts for both in silico, as well as ex vivo validation. The same report stresses the importance of performing MVAs that not only include all confounding factors but also utilize OS and/or CSS as end measures, in addition to DFS. We therefore utilized OS/CSS in our discovery method, subsequently validating our gene signature for DFS as well. Our results suggest that the SU-GIB stratification can be developed as a clinical prognostic test for colon cancer, especially since the strength of the test is comparable to that of an in silico adapted version of Oncotype DX colon. Obviously extensive validation studies are required to define the best patient group that would benefit from the SU-GIB test, as has been done previously for others [13, 14]. This would need to be followed by studies that would assess if treatment decisions can be altered by the SU-GIB test, which is considered a major criterion for clinical usability [15]. The in silico predictions for MSI status and Oncotype scores performed in this study are approximations at best, and actual test results of these would need to be included in validation studies.
To our knowledge, this is the first report to associate SEMA5A and ULBP2 expression with clinical outcome in colon cancer. Semaphorins were first identified as axon guidance molecules involved in regulation of neural connections [16]. Type 5 semaphorins are transmembrane proteins present in both invertebrates and vertebrates[17]. In cancer, their upregulation has been related to both good and bad prognosis [18]. For example Sema5a transfection to pancreatic cancer cell lines resulted in higher cell invasion in vitro, and injection of such cells to nude mice enhanced tumorgenicity and tumor growth in vivo [19]. Similarly, SEMA5A has been shown to promote in vitro migration and invasion of gastric cancer cell lines [20]. On the other hand, SEMA5A has been reported to impede glioma cell motility [21], and has been associated with better prognosis in women with non-small cell lung cancer [22]. According to the Human Protein Atlas, SEMA5A expression occurs mostly in epithelial cells (www.proteinatlas.org), possibly indicating that this is an epithelial cell marker for colon cancer. On the other hand, analysis of ULBP2 expression in the same database reveals that it occurs more often in fibroblasts, compared to surrounding cells in various organs, and therefore in cells that are more mesenchymal in nature. ULBP2, a NKG2D ligand, is highly expressed in transformed cells [23] and is thought to provide a ligand for NK cells, facilitating tumor cell death [24-26]. The reason up-regulation of ULBP2 is related to a worse outcome could be because secretion or cleavage of this protein is related to reduced NK mediated tumor lysis [27]. In this line, an increase in expression of the tumor-associated or the secreted form of ULBP2 has been associated with an unfavorable outcome for several cancers including melanoma, non-small cell lung carcinoma and ovarian carcinoma [28-30]. Hence, the known molecular characteristics of these two genes help understand how they might affect prognosis in colon cancer. Our findings show that patients with a better outcome have increased phosphorylation of EGFR at Tyrosine 1068. The autophosphorylation of this residue is necessary for Grb2-EGFR binding and is strongly inhibited by Gefinitib [31, 32]. It is somewhat surprising then, that a PI3K/mTOR inhibitor is effective preferentially on tumors from patients with a worse prognosis, when both PI3K and mTOR are activated downstream to EGFR. However, our analysis of the GSE39582 database, which contains mutation data, shows that tumors from only 20% of SU-G patients contain Kras or Braf mutations, while tumors from B patients are mutated at a rate of 60%. This suggests that most patients with EGFR Tyr 1068 phosphorylation might not harbor Kras/Braf mutations; and that the PI3K-mTOR inhibitor BEZ235 might be more effective on tumors with Kras/Braf mutations, rather than those with EGFR autophosphorylation. Several reports indicate an inverse association of EGFR/Kras/MAPK and PI3K activity and caspase 7 activation by its cleavage [33, 34], similar to our findings. Caspase 7 activation is involved in inflammation [35] and enhances NFkB activity [11]. It is therefore, not surprising that we find several inflammatory cytokines upregulated among SU-B tumors. Inflammation, in turn, is closely associated with epithelial to mesenchymal transition [36]. Our results show that SU-B tumors are significantly more mesenchymal in their phenotype compared to SU-G tumors, as assessed by Vimentin and E-cadherin expression, two genes which are considered reliable markers of mesenchymal and epithelial cells, respectively [37]. In summary, our data shows that the SU-GIB stratification not only defines distinct prognostic sub-groups but also functionally distinct colon cancer sub-types. Further validation of this signature, especially in prospectively studied cohorts, and further characterization of SU-GIB stratified tumors could reveal various novel options for treatment and diagnosis of colon cancer.
Supplementary Material
Supplementary figures and tables.
Abbreviations
OS, overall survival; DSS, disease-specific survival; DFS, disease-free survival; SSAT, semi-supervised survival analysis tool; RMA, robust multi-array average; TCGA, The Cancer Genome Atlas; SU-GIB, SEMA5A/ULBP2 expression based good-intermediate-bad prognosis classification; MSI, microsatellite instable; MSS, microsatellite stable; MVA, multivariate analysis; R, Bioconductor.
Acknowledgements
We thank Drs. Koray D. Kaya, Sukru Atakan and Alper Poyraz for helpful guidance and discussions.
Funding support
TUBITAK 112S304 to AOG; TUBITAK BIDEB to SD, MI, BED, EO and SD(2); NIH/NCI Cancer Center Support Grant P30 CA008748 to MG.
Competing Interests
The authors have declared that no competing interest exists.
References
1. Meleth S, Reeder-Hayes K, Ashok M, Clark R, Funkhouser W, Wines R. et al. Technology Assessment of Molecular Pathology Testing for the Estimation of Prognosis for Common Cancers Technology Assessment of Molecular Pathology Testing for the Estimation of Prognosis for Common Cancers. Rockville (MD): Agency for Healthcare Research and Quality of the U.S. Department of Health and Human Services. 2014
2. Smith JJ, Deane NG, Wu F, Merchant NB, Zhang B, Jiang A. et al. Experimentally derived metastasis gene expression profile predicts recurrence and death in patients with colon cancer. Gastroenterology. 2010;138:958-68
3. Marisa L, de Reynies A, Duval A, Selves J, Gaub MP, Vescovo L. et al. Gene expression classification of colon cancer into molecular subtypes: characterization, validation, and prognostic value. PLoS medicine. 2013;10:e1001453
4. Barretina J, Caponigro G, Stransky N, Venkatesan K, Margolin AA, Kim S. et al. The Cancer Cell Line Encyclopedia enables predictive modelling of anticancer drug sensitivity. Nature. 2012;483:603-7
5. Garnett MJ, Edelman EJ, Heidorn SJ, Greenman CD, Dastur A, Lau KW. et al. Systematic identification of genomic markers of drug sensitivity in cancer cells. Nature. 2012;483:570-5
6. O'Connell MJ, Lavery I, Yothers G, Paik S, Clark-Langone KM, Lopatin M. et al. Relationship between tumor gene expression and recurrence in four independent studies of patients with stage II/III colon cancer treated with surgery alone or surgery plus adjuvant fluorouracil plus leucovorin. J Clin Oncol. 2010;28:3937-44
7. Tian S, Roepman P, Popovici V, Michaut M, Majewski I, Salazar R. et al. A robust genomic signature for the detection of colorectal cancer patients with microsatellite instability phenotype and high mutation frequency. J Pathol. 2012;228:586-95
8. Li Z, Tian T, Lv F, Chang Y, Wang X, Zhang L. et al. Six1 promotes proliferation of pancreatic cancer cells via upregulation of cyclin D1 expression. PLoS ONE. 2013;8:e59203
9. Lejmi E, Leconte L, Pedron-Mazoyer S, Ropert S, Raoul W, Lavalette S. et al. Netrin-4 inhibits angiogenesis via binding to neogenin and recruitment of Unc5B. Proc Natl Acad Sci U S A. 2008;105:12491-6
10. Livak KJ, Schmittgen TD. Analysis of relative gene expression data using real-time quantitative PCR and the 2(-Delta Delta C(T)) Method. Methods. 2001;25:402-8
11. Erener S, Petrilli V, Kassner I, Minotti R, Castillo R, Santoro R. et al. Inflammasome-activated caspase 7 cleaves PARP1 to enhance the expression of a subset of NF-kappaB target genes. Mol Cell. 2012;46:200-11
12. Wang H, Wang HS, Zhou BH, Li CL, Zhang F, Wang XF. et al. Epithelial-mesenchymal transition (EMT) induced by TNF-alpha requires AKT/GSK-3beta-mediated stabilization of snail in colorectal cancer. PLoS ONE. 2013;8:e56664
13. Yothers G, O'Connell MJ, Lee M, Lopatin M, Clark-Langone KM, Millward C. et al. Validation of the 12-gene colon cancer recurrence score in NSABP C-07 as a predictor of recurrence in patients with stage II and III colon cancer treated with fluorouracil and leucovorin (FU/LV) and FU/LV plus oxaliplatin. J Clin Oncol. 2013;31:4512-9
14. You YN, Rustin RB, Sullivan JD. Oncotype DX((R)) colon cancer assay for prediction of recurrence risk in patients with stage II and III colon cancer: A review of the evidence. Surgical oncology. 2015;24:61-6
15. Srivastava G, Renfro LA, Behrens RJ, Lopatin M, Chao C, Soori GS. et al. Prospective multicenter study of the impact of oncotype DX colon cancer assay results on treatment recommendations in stage II colon cancer patients. The oncologist. 2014;19:492-7
16. He Z, Wang KC, Koprivica V, Ming G, Song HJ. Knowing how to navigate: mechanisms of semaphorin signaling in the nervous system. Sci STKE. 2002;2002:re1
17. Bahri SM, Chia W, Yang X. Characterization and mutant analysis of the Drosophila sema 5c gene. Dev Dyn. 2001;221:322-30
18. Tamagnone L. Emerging role of semaphorins as major regulatory signals and potential therapeutic targets in cancer. Cancer Cell. 2012;22:145-52
19. Sadanandam A, Varney ML, Singh S, Ashour AE, Moniaux N, Deb S. et al. High gene expression of semaphorin 5A in pancreatic cancer is associated with tumor growth, invasion and metastasis. International journal of cancer Journal international du cancer. 2010;127:1373-83
20. Pan G, Zhu Z, Huang J, Yang C, Yang Y, Wang Y. et al. Semaphorin 5A promotes gastric cancer invasion/metastasis via urokinase-type plasminogen activator/phosphoinositide 3-kinase/protein kinase B. Dig Dis Sci. 2013;58:2197-204
21. Li X, Law JW, Lee AY. Semaphorin 5A and plexin-B3 regulate human glioma cell motility and morphology through Rac1 and the actin cytoskeleton. Oncogene. 2012;31:595-610
22. Lu TP, Tsai MH, Lee JM, Hsu CP, Chen PC, Lin CW. et al. Identification of a novel biomarker, SEMA5A, for non-small cell lung carcinoma in nonsmoking women. Cancer Epidemiol Biomarkers Prev. 2010;19:2590-7
23. Groh V, Rhinehart R, Secrist H, Bauer S, Grabstein KH, Spies T. Broad tumor-associated expression and recognition by tumor-derived gamma delta T cells of MICA and MICB. Proc Natl Acad Sci U S A. 1999;96:6879-84
24. Cosman D, Mullberg J, Sutherland CL, Chin W, Armitage R, Fanslow W. et al. ULBPs, novel MHC class I-related molecules, bind to CMV glycoprotein UL16 and stimulate NK cytotoxicity through the NKG2D receptor. Immunity. 2001;14:123-33
25. Ohashi M, Eagle RA, Trowsdale J. Post-translational modification of the NKG2D ligand RAET1G leads to cell surface expression of a glycosylphosphatidylinositol-linked isoform. J Biol Chem. 2010;285:16408-15
26. Hayakawa Y, Kelly JM, Westwood JA, Darcy PK, Diefenbach A, Raulet D. et al. Cutting edge: tumor rejection mediated by NKG2D receptor-ligand interaction is dependent upon perforin. J Immunol. 2002;169:5377-81
27. Waldhauer I, Steinle A. Proteolytic release of soluble UL16-binding protein 2 from tumor cells. Cancer Res. 2006;66:2520-6
28. Yamaguchi K, Chikumi H, Shimizu A, Takata M, Kinoshita N, Hashimoto K. et al. Diagnostic and prognostic impact of serum-soluble UL16-binding protein 2 in lung cancer patients. Cancer science. 2012;103:1405-13
29. Nuckel H, Switala M, Sellmann L, Horn PA, Durig J, Duhrsen U. et al. The prognostic significance of soluble NKG2D ligands in B-cell chronic lymphocytic leukemia. Leukemia. 2010;24:1152-9
30. Rothe A, Jachimowicz RD, Borchmann S, Madlener M, Kessler J, Reiners KS. et al. The bispecific immunoligand ULBP2-aCEA redirects natural killer cells to tumor cells and reveals potent anti-tumor activity against colon carcinoma. International journal of cancer Journal international du cancer. 2014;134:2829-40
31. Batzer AG, Rotin D, Urena JM, Skolnik EY, Schlessinger J. Hierarchy of binding sites for Grb2 and Shc on the epidermal growth factor receptor. Mol Cell Biol. 1994;14:5192-201
32. Phuchareon J, McCormick F, Eisele DW, Tetsu O. EGFR inhibition evokes innate drug resistance in lung cancer cells by preventing Akt activity and thus inactivating Ets-1 function. Proc Natl Acad Sci U S A. 2015;112:E3855-63
33. Chen G, Kronenberger P, Teugels E, Umelo IA, De Greve J. Targeting the epidermal growth factor receptor in non-small cell lung cancer cells: the effect of combining RNA interference with tyrosine kinase inhibitors or cetuximab. BMC medicine. 2012;10:28
34. Bai H, Li H, Li W, Gui T, Yang J, Cao D. et al. The PI3K/AKT/mTOR pathway is a potential predictor of distinct invasive and migratory capacities in human ovarian cancer cell lines. Oncotarget. 2015;6:25520-32
35. Lamkanfi M, Kanneganti TD. Caspase-7: a protease involved in apoptosis and inflammation. The international journal of biochemistry & cell biology. 2010;42:21-4
36. Lopez-Novoa JM, Nieto MA. Inflammation and EMT: an alliance towards organ fibrosis and cancer progression. EMBO molecular medicine. 2009;1:303-14
37. Lee JM, Dedhar S, Kalluri R, Thompson EW. The epithelial-mesenchymal transition: new insights in signaling, development, and disease. J Cell Biol. 2006;172:973-81
Author contact
![]() Corresponding author: agureedu.tr
Corresponding author: agureedu.tr
Citation styles
APA
Demirkol, S., Gomceli, I., Isbilen, M., Dayanc, B.E., Tez, M., Bostanci, E.B., Turhan, N., Akoglu, M., Ozyerli, E., Durdu, S., Konu, O., Nissan, A., Gonen, M., Gure, A.O. (2017). A Combined ULBP2 and SEMA5A Expression Signature as a Prognostic and Predictive Biomarker for Colon Cancer. Journal of Cancer, 8(7), 1113-1122. https://doi.org/10.7150/jca.17872.
ACS
Demirkol, S.; Gomceli, I.; Isbilen, M.; Dayanc, B.E.; Tez, M.; Bostanci, E.B.; Turhan, N.; Akoglu, M.; Ozyerli, E.; Durdu, S.; Konu, O.; Nissan, A.; Gonen, M.; Gure, A.O. A Combined ULBP2 and SEMA5A Expression Signature as a Prognostic and Predictive Biomarker for Colon Cancer. J. Cancer 2017, 8 (7), 1113-1122. DOI: 10.7150/jca.17872.
NLM
Demirkol S, Gomceli I, Isbilen M, Dayanc BE, Tez M, Bostanci EB, Turhan N, Akoglu M, Ozyerli E, Durdu S, Konu O, Nissan A, Gonen M, Gure AO. A Combined ULBP2 and SEMA5A Expression Signature as a Prognostic and Predictive Biomarker for Colon Cancer. J Cancer 2017; 8(7):1113-1122. doi:10.7150/jca.17872. https://www.jcancer.org/v08p1113.htm
CSE
Demirkol S, Gomceli I, Isbilen M, Dayanc BE, Tez M, Bostanci EB, Turhan N, Akoglu M, Ozyerli E, Durdu S, Konu O, Nissan A, Gonen M, Gure AO. 2017. A Combined ULBP2 and SEMA5A Expression Signature as a Prognostic and Predictive Biomarker for Colon Cancer. J Cancer. 8(7):1113-1122.
This is an open access article distributed under the terms of the Creative Commons Attribution (CC BY-NC) license (https://creativecommons.org/licenses/by-nc/4.0/). See http://ivyspring.com/terms for full terms and conditions.