Journal of Cancer
ISSN: 1837-9664
3.2
Impact Factor
ISSN: 1837-9664

 Global reach, higher impact
J Cancer 2017; 8(7):1153-1161. doi:10.7150/jca.17986 This issue Cite
Research Paper
Overexpression of Mitochondrial GTPase MFN2 Represents a Negative Prognostic Marker in Human Gastric Cancer and Its Inhibition Exerts Anti-Cancer Effects
Chia-Lang Fang1, 2, Ding-Ping Sun3, 4, Han-Kun Chen3, Chih-Chan Lin5, Shih-Ting Hung5, Yih-Huei Uen6 ![]() , Kai-Yuan Lin5, 7
, Kai-Yuan Lin5, 7 ![]()
1. Department of Pathology, School of Medicine, College of Medicine, Taipei Medical University, Taipei, Taiwan;
2. Department of Pathology, Wan Fang Hospital, Taipei Medical University, Taipei, Taiwan;
3. Department of Surgery, Chi Mei Medical Center, Tainan, Taiwan;
4. Department of Nutrition, Chia Nan University of Pharmacy and Science, Tainan, Taiwan;
5. Department of Medical Research, Chi Mei Medical Center, Tainan, Taiwan;
6. The Superintendent's Office, Chi Mei Hospital Chiali, Tainan, Taiwan;
7. Department of Biotechnology, Chia Nan University of Pharmacy and Science, Tainan, Taiwan.
Received 2016-10-18; Accepted 2017-1-12; Published 2017-4-9
Citation:
Fang CL, Sun DP, Chen HK, Lin CC, Hung ST, Uen YH, Lin KY. Overexpression of Mitochondrial GTPase MFN2 Represents a Negative Prognostic Marker in Human Gastric Cancer and Its Inhibition Exerts Anti-Cancer Effects. J Cancer 2017; 8(7):1153-1161. doi:10.7150/jca.17986. https://www.jcancer.org/v08p1153.htm
Other stylesAbstract
Background: As one of the most common malignancies in the world, little is known about the molecular mechanism underlying gastric cancer (GC) and its progression. In this study, we aimed to investigate the clinical impact of the mitochondrial GTPase mitofusin 2 (MFN2) in GC.
Methods: Immunohistochemistry was used to examine the expression levels of MFN2 in gastric tissues obtained from 141 patients with GC. The correlations between MFN2 protein level and clinicopathologic parameters, as well as the significance of MFN2 protein level for overall and disease-free survival were assessed. siRNA technology was used to study the effect of MFN2 knockdown on cell proliferation and invasion.
Results: The overexpression of MFN2 was positively associated with depth of invasion (P = 0.0430), stage (P = 0.0325) and vascular invasion (P = 0.0077). Patients with high expression levels of MFN2 had a significantly lower overall survival rate and disease-free survival rate compared with those with low expression levels (P = 0.003 and 0.001, respectively). Multivariate Cox regression analysis showed that the overexpression of MFN2 was an independent prognostic marker for inferior overall survival and disease-free survival (P = 0.015 and 0.025, respectively). In addition, studies conducted in GC cells indicated that knockdown of MFN2 suppressed cell proliferation and invasion.
Conclusions: Overexpression of MFN2 can be used as a marker to predict the outcome of patients with GC. Furthermore, targeting MFN2 might provide a new therapeutic modality for the treatment of GC.
Keywords: gastric cancer, MFN2, prognosis.
Introduction
Gastric cancer is the third most common cause of cancer-related death, and has been attributed to more than 2000 deaths per year in Taiwan (http://www.mohw.gov.tw/CHT/DOS/Statistic.aspx?f_list_no=312&fod_list_no=6201) [1]. The overall prognosis of patients with GC has not improved because of poor understanding of the pathogenesis and the lack of specific target gene therapies [2,3]. Thus, identifying potential novel biomarkers for GC would clearly be of great benefit. In recent decades, several studies have suggested that genetic alterations may play a role in GC carcinogenesis [4]. Some genes and their expressed proteins have been investigated in studying the mechanism of GCs and searching for prognostic markers [5-10].
Mitochondria, which control many vital cellular functions, are dynamic organelles that are continuously undergoing fission and fusion [11]. The balance between mitochondrial fission and fusion affects the morphology and function of mitochondria [12]. The mitofusin‑2 (MFN2) gene, which was originally identified in the vascular smooth muscle cells of spontaneously hypertensive rats, encodes a mitochondrial GTPase anchored on the mitochondrial outer membrane and plays an essential role in mitochondrial fusion, thus regulating mitochondrial morphology and function [13-15]. The function of MFN2 in cancer development and progression has recently been investigated. Previous studies have shown that the expression of MFN2 is significantly lower in various malignancies, including liver cancer, bladder cancer and GC [16-18]. Wang et al. showed that ectopic MFN2 expression in HepG2 liver cancer cells can induce apoptosis by increasing Ca2+ influx into the mitochondria from the endoplasmic reticulum. The data provided by Jin et al. demonstrated that ectopic expression of MFN2 in T24 bladder cancer cells caused cell cycle arrest in G1/S phases and caspase-3-mediated apoptosis, leading to the inhibition of cell proliferation. Another study performed by Zhang et al. showed that augmented MFN2 in AGS gastric cancer cells weakened cell migration and invasion through MMP-2 and MMP-9 downregulation. These findings indicate an anti-tumor role of MFN2. However, in contrast to these studies, Lou et al. found that MFN2 was overexpressed in lung cancer [19]. It was also shown that knockdown of MFN2 halted cell proliferation and invasion. Collectively, these studies suggested that the role of MFN2 in cancer development and progression seems to be more complicated than expected and should be explored in detail.
Recently, MFN2 has become a focal point in tumor research with reports suggesting that MFN2 may contribute to clinical outcomes. Studies by Wang and Feng have reported that MFN2 expression in liver cancer was significantly associated with unfavorable clinicopathologic parameters, including tumor size and stage, as well as with poor overall survival [16,20]. Thus, MFN2 is a promising diagnostic and prognostic marker for liver cancer patients. However, according to Zhang's study, MFN2 expression was not significantly associated with the outcomes of GC patients [18]. Taken together, the prognostic value of MFN2 is still inconclusive and requires further investigation.
To clarify the role and clinical impact of MFN2 in human GC, a patient cohort was enrolled to examine the expression of MFN2 in gastric tissues, investigate the correlations between MFN2 expression and clinicopathologic parameters, and evaluate the significance of MFN2 in predicting the prognosis for patients with GC.
Materials and methods
Patients and specimens
The patient cohort comprised 141 consecutive GC cases from 1998 through 2011 with documented pathologic and clinical factors as well as clinical outcomes. Non-tumor tissue was obtained from grossly normal gastric mucosa, separate from the tumor, in the resected gastric specimen. Clinicopathologic parameters of GCs were determined according to the American Joint Committee on Cancer (AJCC) classification. The follow-up duration for disease-free survival was defined as the period between the operation date and the day of relapse, according to the patient's chart. For each patient, we analyzed a pair of tumor and non-tumor gastric tissues to determine the MFN2 expression. The tissue acquisition protocol for the immunohistochemical and immunoblotting study was approved by the institutional review board at Wan Fang Hospital, Taipei, Taiwan (Approval No. 99049). Written informed consent was obtained from each participant before tissue acquisition.
Immunohistochemical analysis
Paraffin-embedded tissue blocks were sliced into 5-μm sections at and transferred onto microscope slides (Muto Pure Chemicals Co. Ltd., Tokyo, Japan). Normal kidney was used as a positive control for MFN2. Deparaffinized sections were incubated in citrate buffer (pH 6.0) for 40 min at 95˚C for antigen retrieval. Primary antibody (mouse monoclonal anti-MFN2 antibody, Santa Cruz, Dallas, TX) at a dilution of 1:100 was applied to the sections for 2 h at room temperature. Detection of the immunoreactive staining was conducted using the avidin-biotin-peroxidase complex method according to the manufacturer's instructions (Dako REAL EnVision Detection System, Glostrup, Denmark). After the sections were incubated with diaminobenzidine for 5 min, they were counterstained with hematoxylin and mounted in Dako Faramount Aqueous Mounting Medium for microscopic interpretation. Immunoreactivity was assessed semiquantitatively and scored as follows: 0, no staining; 1, weak and focal staining in < 25% of the tissue; 2, moderate staining in 25%-50% of the tissue; and 3, strong staining in > 50% of the tissue. Sections with a score of 0 or 1 exhibited low expression of MFN2, and those with a score of 2 or 3 were defined as exhibiting high expression or overexpression of MFN2. Clinical data collection and immunohistochemical analysis were performed independently of each other in an investigator-blinded study.
Cell culture
A human normal gastric cell line (Hs738.St/Int) was obtained from the American Type Culture Collection (ATCC, Manassas, VA, Cat. No. CRL-7869). Two GC cell lines (AGS, NCI-N87, TMC-1 and TSGH 9201) were obtained from the Bioresource Collection and Research Center (BCRC, Hsinchu, Taiwan, Cat. No. BCRC 60102, 60217, 60379, and 60146, respectively). The GC cell lines SK-GT-2 and HGC-27 were obtained from the European Collection of Cell Cultures (ECACC, Salisbury, UK), and the GC cell line 23132/87 was obtained from Creative Bioarray (Shirley, NY). Cells were cultured in DMEM (Hs738.St/Int), F-12K (AGS), RPMI-1640 (NCI-N87, TMC-1, TSGH 9201, SK-GT-2 and HGC-27) and MEM (23132/87) supplemented with 10% fetal bovine serum (FBS), 100 units/mL penicillin G, 100 μg/mL streptomycin sulfate, and 250 ng/mL amphotericin B.
Total protein preparation
Total proteins were extracted using the RIPA Protein Extraction Reagent (Pierce Biotechnology, Rockford, IL) according to the manufacturer's instructions. The samples were stored at -80°C until used. The protein concentration was determined using a BCA Protein Assay Kit (Pierce Biotechnology) with bovine serum albumin as a standard.
Immunoblotting
Denatured protein samples were subjected to 10% SDS-PAGE. The proteins were transferred to nitrocellulose membranes, and blocked blots were incubated with anti-MFN2 monoclonal antibody (1:100 dilution) at room temperature for 1 h. GAPDH was used as an internal control for equal protein loading. The blots were further incubated with secondary antibodies conjugated with peroxidase (Sigma) for 45 min at room temperature. They were then incubated with Western Lighting ECL Ultra Chemiluminescence Substrate (PerkinElmer, Waltham, MA), and exposed to a Fuji medical X-ray film (Fuji Photo Film Co., Tokyo, Japan). Image processing was performed using the Fuji Image Gauge software.
siRNA treatment
For siRNA treatment, SK-GT-2 cells were transfected with siRNAs (two MFN2-siRNAs, MFN2_Hs02_00330014 and MFN2_Hs02_00330014; and one control; all purchased from Sigma), and the knockdown efficiency was examined by immunoblotting.
Colony formation assay
Five hundred cells were seeded into 6-well plates and cultured for 12 days. Individual colonies (> 50 cells/colony) were fixed, stained in a solution of 1% crystal violet in methanol, and counted. The plates were scanned with a Scanjet 2200c scanner (HP, Palo Alto, CA). After scanning, methanol was added, and the plates were shaken at room temperature to solubilize the crystal violet. The optical density (OD540) was measured to quantify the number of colony formed. The assay was performed three times, and the results are presented as the mean ± the standard deviation (SD).
In vitro invasion assay
The cell invasion capability was examined using a Cell Invasion Assay Kit (Merck Millipore, Darmstadt, Germany) following the manufacturer's instructions. Complete media were first added to 24-well plates. The cells (2 × 10⁵) in serum-free media were added to ECMatrix-layered cell culture inserts (containing polycarbonate membranes with an 8 μm pore size) and cultured for 24 h. Before staining, the cells on the upper surface were removed. Inserts were then dipped in the Staining Solution to stain invaded cells on the lower surface of the membranes and photographed (100× magnification, with Leica DMIRB microscope).
Statistical analysis
Paired t tests were used to assess the difference in MFN2 expression between tumor and non-tumor tissues for each patient. We examined several clinicopathologic parameters: age, gender, depth of invasion, nodal status, distant metastasis, stage, degree of differentiation, and vascular permeation. The correlation between MFN2 expression and each clinicopathologic parameter was examined using the χ2 test. The time-to-event endpoints for all clinicopathologic parameters were plotted using the Kaplan-Meier method, and the degree of significance was calculated using the univariate log-rank test. P < 0.05 was considered statistically significant. Parameters that emerged as significant (P < 0.05) in the univariate analysis were entered as variables in the multivariate Cox regression model, and the hazard ratio (HR) and independence of prognostic impact were determined in a stepwise backward fashion. All data were analyzed using SPSS software version 24.0 (IBM, New York, NY).
Results
Demographics
This study enrolled 141 patients with GC; 90 of the 141 patients were male, and 51 were female (Table 1). The patients' ages ranged from 32 to 96 years at first diagnosis (mean 69.2 years). Based on the AJCC classification, 26 patients were at stage I, 37 were at stage II, 59 were at stage III, and 19 were at stage IV. The follow-up period for all patients ranged from 5 to 4118 days (mean 933 days). Eighty-eight patients died during follow-up.
MFN2 expression was upregulated and associated with several clinicopathologic parameters in GC
We used immunohistochemical analysis to investigate the expression of MFN2 in tissues obtained from our study patients (Figure 1A, 1B and 1C). MFN2 expression was significantly higher in tumor tissues than in non-tumor tissues (P < 0.001). Overexpression of MFN2 (scores of 2 or 3) was observed in 61 (43.3%) patients in the cohort. Immunoblotting analysis demonstrated that the expression of MFN2 was substantially increased in gastric cancer cells compared with that in normal cells (Figure 1D). As shown in Table 2, overexpression of MFN2 was associated with depth of invasion, stage and vascular invasion (P = 0.0430, 0.0325 and 0.0077, respectively). Representative images of MFN2 expression for the different parameters are shown in Figure 1E. In contrast, other clinicopathologic parameters were not meaningfully correlated with the MFN2 protein level (Table 2).
Table 1
Demographic data and survival in different stages of GC according to the AJCC classification
| Stage I (n = 26) | Stage II (n = 37) | Stage III (n = 59) | Stage IV (n = 19) | Total (n = 141) | |
|---|---|---|---|---|---|
| Gender | |||||
| Male | 15 | 23 | 40 | 12 | 90 |
| Female | 11 | 14 | 19 | 7 | 51 |
| Age (years)* | 67.2 (12.2) | 74.9 (12.1) | 70.1 (13.5) | 58.3 (14.8) | 69.2 (13.9) |
| Follow-up period (days) * | 1560.5 (1147.4) | 1035.9 (835.1) | 777.1 (768.2) | 356.5 (278.2) | 932.8 (894.5) |
| Survival | |||||
| Yes | 18 | 19 | 14 | 2 | 53 |
| No | 8 | 18 | 45 | 17 | 88 |
*Age and follow-up period are expressed as the mean (SD)
Table 2
MFN2 expression in GC and its correlation with clinicopathologic parameters
| Variable | n | MFN2 expression | P* | |
|---|---|---|---|---|
| Score = 0 or 1 (n = 80) | Score = 2 or 3 (n = 61) | |||
| Age (yr) | 0.2535 | |||
| ≥ 66 | 92 | 49 | 43 | |
| < 66 | 49 | 31 | 18 | |
| Gender | 0.2784 | |||
| Male | 90 | 48 | 42 | |
| Female | 51 | 32 | 19 | |
| Lauren classification | 0.5924 | |||
| Intestinal | 96 | 53 | 43 | |
| Diffuse | 45 | 27 | 18 | |
| Depth of invasion | 0.0430 | |||
| T1 + T2 | 35 | 25 | 10 | |
| T3 + T4 | 106 | 55 | 51 | |
| Nodal status | 0.2060 | |||
| N0 | 45 | 29 | 16 | |
| N1 + N2 + N3 | 96 | 51 | 45 | |
| Distant metastasis | 0.3755 | |||
| Absent | 122 | 71 | 51 | |
| Present | 19 | 9 | 10 | |
| Stage | 0.0325 | |||
| I + II | 63 | 42 | 21 | |
| III + IV | 78 | 38 | 40 | |
| Degree of differentiation | 0.8342 | |||
| Poor | 61 | 34 | 27 | |
| Well to moderate | 80 | 46 | 34 | |
| Vascular invasion | 0.0077 | |||
| Absent | 42 | 31 | 11 | |
| Present | 99 | 49 | 50 | |
* All statistical tests were two-tailed. Significance level: P < 0.05.
Overexpression of MFN2 is a prognostic marker for GC
Correlations of the clinical outcomes with MFN2 expression are shown in Figure 2. Overexpression of MFN2 was significantly associated with inferior overall survival and disease-free survival (Figure 2A and 2B, P = 0.003 and 0.001, respectively). The five-year overall survival rate in patients with high expression levels of MFN2 was 16.8%, whereas that in patients with low expression levels was 46.8%. The five-year disease-free survival rate in patients with high expression levels of MFN2 was 33.2%, whereas that in patients with low expression levels was 61.6%. Because the tumor stage is a critical prognostic marker of GC, low-stage (stage I and II) and high-stage GC (stage III and IV) were independently used to determine the effect of MFN2 overexpression on patient prognosis. We found that in both low-stage and high-stage GC, a shorter disease-free survival was significantly associated with overexpression of MFN2 (Figure 2C and 2D, P = 0.003 and 0.046, respectively).
The results of the univariate analysis of the prognostic markers of GC are presented in Table 3. Disease-free survival was significantly correlated with each of the following: overexpression of MFN2 (P = 0.006), Lauren classification (P = 0.025), depth of invasion (P = 0.001), nodal status (P < 0.001), distant metastasis (P < 0.001), stage (P < 0.001), degree of differentiation (P = 0.002), and vascular invasion (P < 0.001). The association between MFN2 overexpression and survival was significant even after controlling for other well-known prognostic markers in the multivariate analysis (Table 4). In multivariate analysis, overexpression of MFN2 (HR = 1.792, 95% Confidence Interval (CI) = 1.074 to 2.989, P = 0.025) and distant metastasis (HR = 7.605, 95% CI = 3.299 to 17.528, P < 0.001) were prognostically independent.
Figure 1
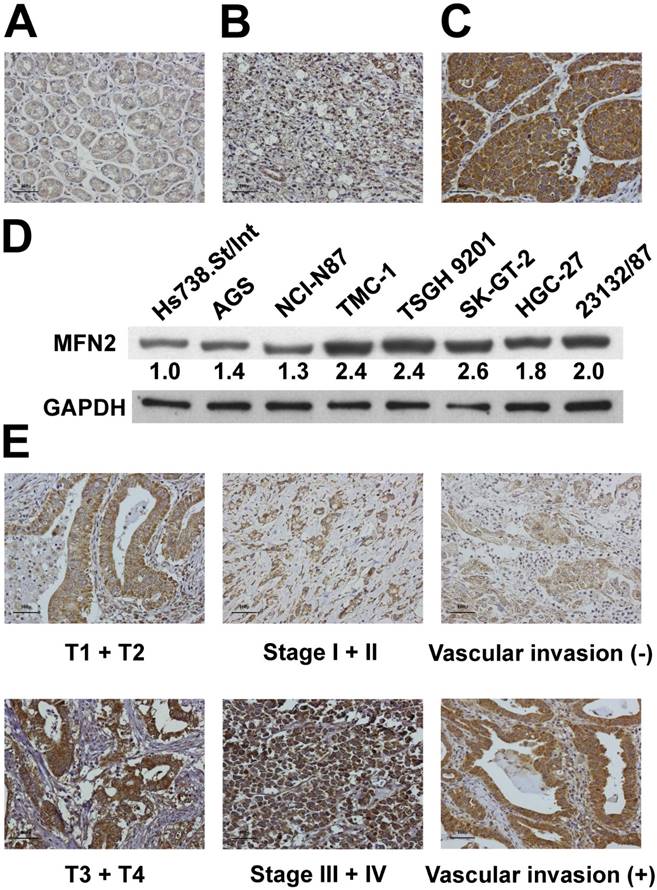
Expression of MFN2 in gastric tissues and cells. MFN2 protein expression was significantly increased in GC tissues (A-C) and cells (D). Panel A shows a sample of non-tumor tissue without MFN2 expression; Panel B shows a tumor specimen with low MFN2 expression; Panel C shows a tumor specimen with high MFN2 expression. (E) The representative MFN2 staining for different parameters.
Figure 2
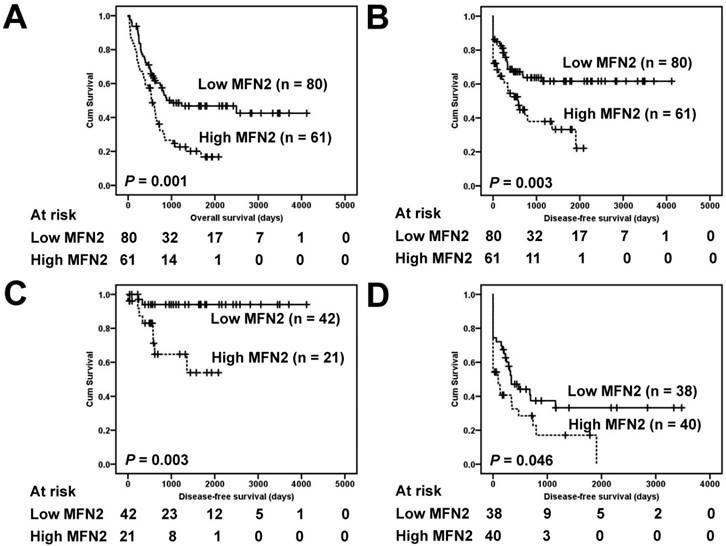
Survival analysis of GC patients stratified by MFN2 immunoreactivity. Panel A shows the overall survival. Patients with high MFN2 expression had a 5-year overall survival rate of 16.8% compared with 46.8% for patients with low MFN2 expression. Panel B shows the disease-free survival. Patients with high MFN2 expression had a 5-year disease-free survival rate of 33.2% compared with 61.6% for patients with low MFN2 expression. Panel C shows the disease-free survival in low-stage GC (stages I and II). Patients with high MFN2 expression had a 5-year disease-free rate of 53.9% compared with 94.0% for patients with low MFN2 expression. Panel D shows the disease-free survival in high-stage GC (stages III and IV). Patients with high MFN2 expression had a 5-year disease-free rate of 17.1% compared with 33.2% for patients with low MFN2 expression. All statistical tests were two-tailed. Significance level: P < 0.05.
Impaired cell proliferation and invasion after MFN2 knockdown in GC cells
Based on their endogenous high expression levels of MFN2, SK-GT-2 GC cells were selected to investigate the role of MFN2 in modulating cell proliferation (Figure 1D). SK-GT-2 cells were transfected with MFN2-siRNA to generate MFN2-knockdown SK-GT-2 cells (Figure 3A). As shown in Figure 3B, the ability of SK-GT-2 cells to form colonies was compromised by MFN2 knockdown compared with corresponding control cells. These results suggested that MFN2 knockdown suppresses the ability of GC cells to proliferate in vitro.
Furthermore, according to the results of the clinicopathologic correlation study—which showed that MFN2 overexpression was closely associated with depth of invasion and vascular invasion—the effect of MFN2 knockdown on the invasiveness of SK-GT-2 GC cells was examined. In the cell invasion assay, MFN2 knockdown significantly suppressed SK-GT-2 cell invasion compared with control cells (Figure 3C).
Table 3
Univariate analysis of prognostic markers in 141 patients with GC
| Variable | HR (95 % CI)* | P* |
|---|---|---|
| MFN2 Low expression High expression | 2.030 (1.225-3.363) | 0.006 |
| Lauren classification Intestinal Diffuse | 1.784 (1.076-2.958) | 0.025 |
| Depth of invasion T1 + T2 T3 + T4 | 4.025 (1.729-9.371) | 0.001 |
| Nodal status N0 N1 + N2 + N3 | 6.812 (2.916-15.915) | < 0.001 |
| Distant metastasis Absent Present | 13.312 (6.038-29.349) | < 0.001 |
| Stage I + II III + IV | 6.672 (3.365-13.229) | < 0.001 |
| Degree of differentiation Poor Well to moderate | 0.456 (0.275-0.756) | 0.002 |
| Vascular invasion Absent Present | 5.640 (2.417-13.164) | < 0.001 |
* All statistical tests were two-tailed. Significance level: P < 0.05. HR = hazard ratio; CI = confidence interval.
Table 4
Multivariate analysis of prognostic markers in 141 patients with GC
| Variable | HR (95 % CI)* | P* |
|---|---|---|
| MFN2 Low expression High expression | 1.792 (1.074-2.989) | 0.025 |
| Lauren classification Intestinal Diffuse | 0.738 (0.339-1.603) | 0.442 |
| Depth of invasion T1 + T2 T3 + T4 | 1.176 (0.442-3.130) | 0.745 |
| Nodal status N0 N1 + N2 + N3 | 1.791 (0.545-5.881) | 0.337 |
| Distant metastasis Absent Present | 7.605 (3.299-17.528) | < 0.001 |
| Stage I + II III + IV | 2.420 (0.858-6.826) | 0.095 |
| Degree of differentiation Poor Well to moderate | 0.628 (0.286-1.381) | 0.247 |
| Vascular invasion Absent Present | 2.053 (0.799-5.272) | 0.135 |
* All statistical tests were two-tailed. Significance level: P < 0.05.
Discussion
Surgical resection is generally considered the best therapy to improve patient prognosis when patients are successfully diagnosed with GC at the early stages [21]. However, most GC cases are diagnosed at a locally advanced stage. To develop novel strategies to prevent and treat GC, a deeper understanding of the molecular mechanisms underlying the development and progression of GC is urgently needed. In particular, exploring novel genes or biomarkers that are altered during GC progression can be valuable tools as either prognostic markers or therapeutic targets. In this study, we investigated the role of MFN2 (which was previously and extensively explored in mitochondrial morphology and function) in GC. Our results indicated that MFN2 was overexpressed in GC samples compared to adjacent normal gastric tissues. In addition, abrogation of MFN2 in SK-GT-2 human GC cells hindered cell proliferation and impaired the invasive ability.
An emerging role of mitochondria in carcinogenesis is supported by an increasing body of evidence [22]. Mitochondrial dysfunction has been shown to promote the development of several human malignancies [23]. The expression of the mitochondrial GTPase MFN2 in human cancers varies according to cancer type. The survey of a public human protein atlas database indicated that MFN2 protein levels are decreased in a number of human cancers, including liver cancer and bladder cancer, whereas it is elevated in lung cancer [17, 19, 24-26]. The only published study conducted in GC demonstrated that MFN2 was downregulated in human GC tissues and that MFN2 overexpression in GC cells delayed cell proliferation and invasion, which is inconsistent with our results [18]. However, only 90 GC specimens were used in that study, while we used 141 specimens to quantify MFN2 expression level. Therefore, the overexpression of MFN2 in our study was more convincing because of the larger sample size. To further confirm the immunohistochemical results, immunoblotting and RNA interference were performed to examine the expression of MFN2 in normal and GC cells as well as determine the effect of MFN2 knockdown on GC cell proliferation. The results showed that MFN2 expression was higher in GC cells than in normal gastric cells. In addition, MFN2 knockdown hindered the ability of GC cells to proliferate.
The correlation between MFN2 expression and local and vascular invasion was investigated in several cancers. A study by Wang et al. performed in liver cancer showed that vascular invasion was not significantly correlated with the level of MFN2. Similar results obtained from GC also revealed that MFN2 level was not significantly correlated with local and vascular invasion, although overexpression of MFN2 significantly impaired GC cell invasion by downregulating MMP-2 and MMP-9. In contrast, our statistical analysis indicated that overexpression of MFN2 in GC tissues was significantly correlated with local and vascular invasion. The data from the in vitro cell invasion assay further support this correlation. To the best of our knowledge, this study demonstrated for the first time the positive correlation between MFN2 expression and invasion. However, an explanation of this relationship between MFN2 overexpression and vascular invasion remains unclear and warrants further investigation.
Precise prediction of the risk of recurrence of GC would assist in minimizing the adverse effects and maximizing the therapeutic effect of the treatment. The clinically available prognostic marker for determining the outcomes of GC patients mainly relies on the AJCC stage [27]. However, the prognosis varies even among patients at the same disease stage; hence, useful prognostic markers are urgently needed to refine the risk stratification for the prognosis of patients with GC. Recently, mitochondrial markers have been intensively studied. The role of MFN2 in tumor prognosis is still uncertain. It was shown that MFN2 expression in liver cancer was significantly associated with unfavorable clinicopathologic parameters, as well as with poor overall survival [16, 20]. The only study conducted in GC indicated that the expression level of MFN2 did not correlate with patient survival and had no prognostic impact on GC [18]. However, the results of this study showed that MFN2 overexpression was inversely correlated with patient survival. The reason for the difference between the previous report and our study may be attributed to fewer patients (90 and 141 patients, respectively) and the shorter follow-up time (1400 days and 4000 days, respectively). Our study is the first to report that overexpression of MFN2 is an independent prognostic marker for GC. Overexpression of MFN2 appears to be a useful marker to predict outcomes in patients with GC who have undergone surgical resection of the tumor. Thus, patients with GC who display overexpression of MFN2 should be followed up carefully.
Figure 3
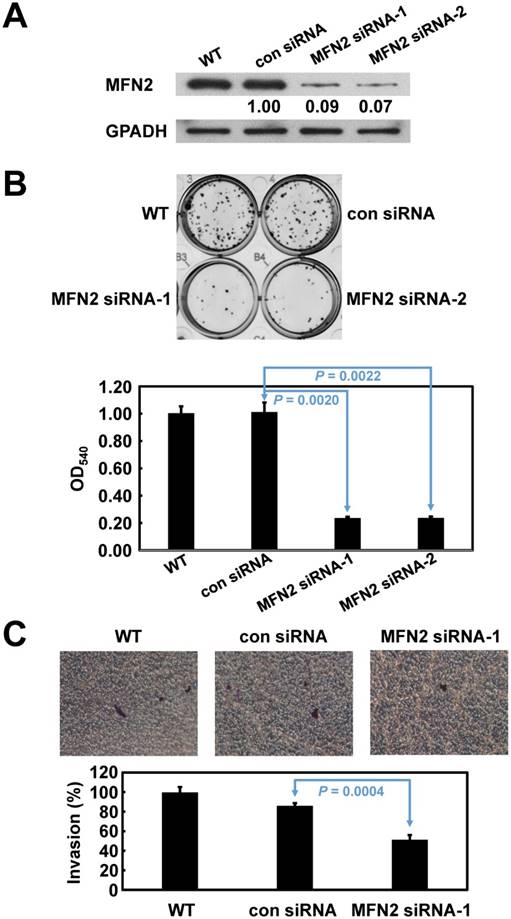
Verification of MFN2 knockdown in SK-GT-2 cells, and the effect of MFN2 knockdown on cell proliferation and invasion. The immunoblotting results (A) indicate that MFN2 was efficiently knocked down by siRNA treatment. (B) Inhibition of MFN2 expression suppressed cell proliferation. The histogram represents OD540 (presented as the mean ± SD). Significance level: P < 0.05. (C) Silencing MFN2 expression repressed cell invasion. The histogram represents the number of invaded cells (presented as the mean ± SD). Significance level: P < 0.05.
In summary, this study provides evidence for the clinical significance of MFN2 overexpression in patients with GC. Our findings indicate that targeting MFN2 might provide a new therapeutic modality for the treatment of GC.
Acknowledgements
This study was support by the research grant (No. 104CM-TMU-14) from Chi Mei Medical Center, Tainan, Taiwan.
Competing Interests
The authors have declared that no competing interest exists.
References
1. Torre LA, Braf F, Siegel RL. et al. Global cancer statistics, 2012. CA Cancer J Clin. 2015;65:87-108
2. Fuchs CS, Mayer RJ. Gastric carcinoma. N Engl J Med. 1995;333:32-41
3. Hartgrink HH, Jansen EPM, van Grieken NCT. et al. Gastric cancer. Lancet. 2009;374:477-90
4. Jin ZL, Jiang WH, Wang LW. Biomarkers for gastric cancer: progression in early diagnosis and prognosis. Oncol Lett. 2015;9:1502-8
5. Lin KY, Fang CL, Chen Y. et al. Overexpression of nuclear protein kinase CK2 β subunit and prognosis in human gastric carcinoma. Ann Surg Oncol. 2010;17:1695-702
6. Lin KY, Wang LH, Hseu YC. et al. Clinical significance of increased guanine nucleotide exchange factor Vav3 expression in human gastric cancer. Mol Cancer Res. 2012;10:750-9
7. Fang CL, Hseu YC, Lin YF. et al. Clinical and prognostic association of transcription factor SOX4 in gastric cancer. PLOS ONE. 2012;7:e52804
8. Lin SC, Chen WY, Lin KY. et al. Clinicopathological correlation and prognostic significance of protein kinase Cα overexpression in human gastric carcinoma. PLOS ONE. 2013;8:e56675
9. Uen YH, Lin KY, Sun DP. et al. Comparative proteomics, network analysis and post-translational modification identification reveal differential profiles of plasma Con A-bound glycoprotein biomarkers in gastric cancer. J Proteomics. 2013;83:197-213
10. Lin CC, Fang CL, Sun DP. et al. High expression of mitochondrial intermembrane chaperone TIMM9 represents a negative prognostic marker in gastric cancer. J Formos Med Assoc. 2016 [Epub ahead of print]
11. De Brito OM, Scorrano L. Mitofusin 2: a mitochondria-shaping protein with signaling roles beyond fusion. Antioxid Redox Signal. 2008;10:621-33
12. Bereiter-Hahn J, Vöth M. Dynamics of mitochondria in living cells: shape changes, dislocations, fusion, and fission of mitochondria. Microsc Res Tech. 1994;27:198-219
13. Chen G, Liu N, Zhou A. et al. The role of hypertension-related gene in aortic vascular smooth muscle cells from mice and rats. Chin Med J (Engl). 2001;114:833-6
14. Chen H, Detmer SA, Ewald AJ. et al. Mitofusins Mfn1 and Mfn2 coordinately regulate mitochondrial fusion and are essential for embryonic development. J Cell Biol. 2003;160:189-200
15. Eura Y, Ishihara N, Oka T. et al. Identification of a novel protein that regulates mitochondrial fusion by modulating mitofusin (Mfn) protein function. J Cell Sci. 2006;119:4913-25
16. Wang W, Xie Q, Zhou X. et al. Mitofusin-2 triggers mitochondria Ca2+ influx from the endoplasmic reticulum to induce apoptosis in hepatocellular carcinoma cells. Cancer Lett. 2015;358:47-58
17. Jin B, Fu G, Pan H. et al. Anti-tumour efficacy of mitofusin-2 in urinary bladder carcinoma. Med Oncol. 2011;28(Suppl 1):S373-80
18. Zhang GE, Jin HL, Lin XK. et al. Anti-tumor effects of Mfn2 in gastric cancer. Int J Mol Sci. 2013;14:13005-21
19. Lou Y, Li R, Liu J. et al. Mitofusin-2 over-expresses and leads to dysregulation of cell cycle and cell invasion in lung adenocarcinoma. Med Oncol. 2015;32:132
20. Feng X, Zhu K, Liu J. et al. The evaluative value of Sema3C and MFN2 co-expression detected by immunohistochemistry for prognosis in hepatocellular carcinoma patients after hepatectomy. Onco Targets Ther. 2016;9:3213-21
21. Oliveira FJ, Ferrao H, Furtado E. et al. Early gastric cancer: Report of 58 cases. Gastric Cancer. 1998;1:51-6
22. Birch-Machin MA. The role of mitochondria in ageing and carcinogenesis. Clin Exp Dermatol. 2006;31:548-52
23. Ma Y, Bai RK, Trieu R. et al. Mitochondrial dysfunction in human breast cancer cells and their transmitochondrial cybrids. Biochim Biophys Acta. 2010;1797:29-37
24. Wang WL, Lu JJ, Zhu F. et al. Proapoptotic and anti-proliferative effects of mitofusin-2 via Bax signaling in hepatocellular carcinoma cells. Med Oncol. 2012;29:70-6
25. Wang W, Zhou D, Wei J. et al. Hepatitis B virus X protein inhibits p53-mediated upregulation of mitofusin-2 in hepatocellular carcinoma cells. Biochem Biophys Res Commun. 2012;421:355-60
26. Wang W, Zhu F, Wang S. et al. HSG provides antitumor efficacy on hepatocellular carcinoma both in vitro and in vivo. Oncol Rep. 2010;24:183-8
27. Edge SB, Compton CC. The American Joint Committee on Cancer: The 7th edition of the AJCC cancer staging manual and the future of TNM. Ann Surg Oncol. 2010;17:1471-4
Author contact
![]() Corresponding authors: Yih-Huei Uen, MD. The Superintendent's Office, Chi Mei Hospital Chiali, 606, Shin-Hwa Road, Chiali District, Tainan, 722, Taiwan. Phone: 886-6-2812811, Fax: 886-6-2832639, Email: 840221chimei.org.tw Kai-Yuan Lin, PhD. Department of Medical Research, Chi Mei Medical Center, 901, Chunghua Road, Yungkang District, Tainan, 710, Taiwan. Phone: 886-6-281-2811, Fax: 886-6-2832639, Email: d970712chimei.org.tw.
Corresponding authors: Yih-Huei Uen, MD. The Superintendent's Office, Chi Mei Hospital Chiali, 606, Shin-Hwa Road, Chiali District, Tainan, 722, Taiwan. Phone: 886-6-2812811, Fax: 886-6-2832639, Email: 840221chimei.org.tw Kai-Yuan Lin, PhD. Department of Medical Research, Chi Mei Medical Center, 901, Chunghua Road, Yungkang District, Tainan, 710, Taiwan. Phone: 886-6-281-2811, Fax: 886-6-2832639, Email: d970712chimei.org.tw.
Citation styles
APA
Fang, C.L., Sun, D.P., Chen, H.K., Lin, C.C., Hung, S.T., Uen, Y.H., Lin, K.Y. (2017). Overexpression of Mitochondrial GTPase MFN2 Represents a Negative Prognostic Marker in Human Gastric Cancer and Its Inhibition Exerts Anti-Cancer Effects. Journal of Cancer, 8(7), 1153-1161. https://doi.org/10.7150/jca.17986.
ACS
Fang, C.L.; Sun, D.P.; Chen, H.K.; Lin, C.C.; Hung, S.T.; Uen, Y.H.; Lin, K.Y. Overexpression of Mitochondrial GTPase MFN2 Represents a Negative Prognostic Marker in Human Gastric Cancer and Its Inhibition Exerts Anti-Cancer Effects. J. Cancer 2017, 8 (7), 1153-1161. DOI: 10.7150/jca.17986.
NLM
Fang CL, Sun DP, Chen HK, Lin CC, Hung ST, Uen YH, Lin KY. Overexpression of Mitochondrial GTPase MFN2 Represents a Negative Prognostic Marker in Human Gastric Cancer and Its Inhibition Exerts Anti-Cancer Effects. J Cancer 2017; 8(7):1153-1161. doi:10.7150/jca.17986. https://www.jcancer.org/v08p1153.htm
CSE
Fang CL, Sun DP, Chen HK, Lin CC, Hung ST, Uen YH, Lin KY. 2017. Overexpression of Mitochondrial GTPase MFN2 Represents a Negative Prognostic Marker in Human Gastric Cancer and Its Inhibition Exerts Anti-Cancer Effects. J Cancer. 8(7):1153-1161.
This is an open access article distributed under the terms of the Creative Commons Attribution (CC BY-NC) license (https://creativecommons.org/licenses/by-nc/4.0/). See http://ivyspring.com/terms for full terms and conditions.