Journal of Cancer
ISSN: 1837-9664
3.2
Impact Factor
ISSN: 1837-9664

 Global reach, higher impact
J Cancer 2017; 8(12):2191-2204. doi:10.7150/jca.19128 This issue Cite
Research Paper
Simultaneous Quantification of Serum Multi-Phospholipids as Potential Biomarkers for Differentiating Different Pathophysiological states of lung, stomach, intestine, and pancreas
Yumei Guo1#, Junling Ren1#, Xiaoou Li2, Xiaofeng Liu2, Ning Liu3, Yanmin Wang4, Zhili Li1, ![]()
1. Department of Biophysics and Structural Biology, Institute of Basic Medical Sciences, Chinese Academy of Medical Sciences & School of Basic Medicine, Peking Union Medical College, Beijing, PR China
2. Department of Laboratory, Tumor Hospital of Jilin Province, Changchun, PR China
3. Central Laboratory, Jilin University Second Hospital, Changchun, PR China
4. Department of Clinical Laboratory, Heze Municipal Hospital, Shandong, PR China
#Both authors contributed equally to this work.
Received 2017-1-10; Accepted 2017-4-22; Published 2017-7-15
Citation:
Guo Y, Ren J, Li X, Liu X, Liu N, Wang Y, Li Z. Simultaneous Quantification of Serum Multi-Phospholipids as Potential Biomarkers for Differentiating Different Pathophysiological states of lung, stomach, intestine, and pancreas. J Cancer 2017; 8(12):2191-2204. doi:10.7150/jca.19128. https://www.jcancer.org/v08p2191.htm
Other stylesAbstract
Background: Aberrant lipid metabolism is closely associated with cancer.
Materials & Methods: Serum levels of sphingomyelins (SM) (34:1), phosphatidylcholine (PC) (34:2), PC(34:1), PC(36:4), PC(36:3), and PC(36:2) in 1449 serum samples (including 599 normal controls, 69 patients with benign lung diseases (BLDs), 61 with benign colorectal diseases, 54 with benign gastric diseases, 67 with benign pancreatic diseases, and 246 with lung cancer (LC), 144 with colorectal cancer, 94 with gastric cancer, 115 with pancreatic cancer) were quantified simultaneously based on their respective calibration equations with correlation coefficient of >0.98.
Results: Receiver operating characteristic (ROC) analysis indicated that 18 panels obtained from these six phospholipids have high diagnostic ability to differentiate between different pathophysiological states. For example, a combination of SM(34:1), PC(34:2), PC(34:1), PC(36:3), and PC(36:2) to differentiating male patients with early stage LC from male normal controls plus male BLDs with a value under ROC curve (AUC) of 0.957, a sensitivity of 88.9%, and a specificity of 90.8%. SM(34:1) and PC(34:1) to differentiating female patients with early stage LC from female normal controls plus female BLDs with an AUC of 0.903, a sensitivity of 90.0%, and a specificity of 77.5%.
Conclusion: Change trends of these six phospholipids were significantly correlated with gender, physiological states, and cancer stages.
Keywords: phospholipids, lung cancer, colorectal cancer, gastric cancer, pancreatic cancer, CBDInanoESI-FTICR MS, early diagnosis.
Introduction
Cancer is the second leading cause of deaths worldwide [1]. Lung cancer is the most frequently diagnosed cancer and the leading cause of cancer death in men; colorectal cancer is the third most commonly diagnosed cancer in males and the second in females; gastric cancer is followed by a high incidence and mortality rates [1]; and pancreatic cancer is usually diagnosed at a late stage with high mortality worldwide with over 330,000 deaths annually [2]. The high mortality of cancers is partly ascribed to late diagnosis and poor prognosis [1]. Computer tomography and magnetic resonance imaging are reliable techniques commonly used to detect cancers. The former poses uncertain risk to patients with poor specificity despite its high sensitivity [3] and the latter is not suitable for some patients with metallic foreign-body, such as cardiac pacemaker. Currently, many commonly used serum tumor markers usually limit to late stage with low sensitivity and specificity [4, 5]. General approaches to screening cancer and early diagnosis remain challenges. Therefore, it is necessary to find timely and accurately methods for early differentiation of pathophysiological states.
Phospholipids, as one of the major components of cell membrane, participate in various biological functions [6], and alter in various human cancers [7-10]. Sphingomyelins (SMs) are associated with membrane fluidity [11], and SMs and their metabolic products can regulate cancer cell apoptosis [12]. Phosphatidylcholines (PCs) are the most abundant bilayer-forming phospholipid of eukaryotic membranes [13], and it is found that PCs can contribute to proliferative growth in cancer cells [14] and that abnormal metabolism of SMs and PCs are also correlated with various cancers [15-19] as well as with gender [20].
Direct-infusion mass spectrometry can rapidly perform analysis of biological samples, while carryover effect in metabolites analysis has limited its application for biomarker discovery and clinical diagnostics. Recently, the TriVersa NanoMate®, a chip-based direct-infusion nanoelectrospray ionization (CBDInanoESI) technique coupled with a Fourier transform ion cyclotron resonance mass spectrometer (FTICR MS) has shown a comparative advantage of analysis of the targeted compounds in biological sample, along with short analytical time, low sample consumption, high sensitivity, and less carryover effects [21-24].
In this study, a high-throughput quantitative method of multiple targeted phospholipids (i.e., SM(34:1), PC(34:2), PC(34:1), PC(36:4), PC(36:3), and PC(36:2)) was developed based on the CBDInanoESI-FTICR MS. Their levels in 1449 serum samples from 599 normal controls, 251 patients with benign diseases (i.e., lung, bowel, stomach, and pancreas), and 599 corresponding cancer patients were obtained on the basis of their respective calibration equations with correlation coefficient of >0.98. The experimental results indicate that the levels of SM(34:1), PC(34:2), PC(34:1), PC(36:4), PC(36:3), and PC(36:2) were associated with gender and different pathophysiological states. Receiver operating characteristic (ROC) analysis indicated that potential biomarker panels have high diagnostic ability to differentiate different pathophysiological states or cancer stages relative to clinical commonly used tumor markers.
Materials and methods
Chemicals
Phospholipids (with purity of > 99%) including N-palmitoyl-D-erythro-sphingosylphosphorylcholine (SM(34:1)), 1-palmitoyl-2-oleoyl-sn-glycero-3-phosphocholine (PC(34:1)), 1-palmitoyl-2-linoleoyl-sn-glycero-3-phosphocholine (PC(34:2)), 1,2-dilinoleoyl-sn-glycero-3-phosphocholine (PC(36:4)) and 1,2-dielaidoyl-sn-glycero-3-phosphocholine (PC(36:2)) were purchased from Avanti Polar lipids (Alabaster, AL, USA). 1,2-diastearoyl-sn-glycero-3-phosphocholine (PC(36:0)) as internal standard was purchased from Sigma-Aldrich Chemicals (St. Louis, MO, USA). HPLC-grade dichloromethane, methanol, and acetonitrile were from Fisher Scientific (Fair Lawn, NJ, USA). Ultrapure water was purified by a Milli-Q system (Millipore, MA, USA).
Participants and study design
All samples are remaining sera after the clinical laboratory examination which were drawn in the morning after about 10 hours overnight fast without bowel preparation, followed by less than three-year storage at -80℃ before analysis. A total of 1449 serum samples were collected, including 599 normal controls, with no clinically relevant abnormalities and 850 patients (246 patients with lung cancer, 144 with colorectal cancer, 94 with gastric cancer, 115 with pancreatic cancer, and 69 with benign lung diseases, 61 with benign colorectal diseases, 54 with benign gastric diseases, 67 with benign pancreatic diseases). The training set including 177 normal controls and 177 lung cancer patients was used to discover the difference in the levels of these six targeted phospholipids between gender, pathophysiological states, and cancer stages. The rest of the participants was classified as the different validation sets based on the types of diseases. Detailed information of the participants is shown in Table 1. All experiments were performed in accordance with relevant guidelines and regulations, and the informed consent was obtained. The study was approved by the Ethics Review Board at the Institute of Basic Medical Sciences, Chinese Academy of Medical Sciences.
Preparation of stock standard solutions
Stock solution of 10.75 μM SM(34:1), 29.96 μM PC(34:2), 29.88 μM PC(34:1), 29.04 μM PC(36:4), or 28.90 μM PC(36:2) was prepared in acetonitrile/methanol/water (3.6:5.4:1, v/v/v) with 10 mM ammonium acetate and the mixed stock standard solution was obtained by pooling the above-mentioned stock standard solutions at the ratio of 4:5:2:2.5:2.7 (v/v/v/v/v). The final concentrations of SM(34:1), PC(34:2), PC(34:1), PC(36:4), and PC(36:2) were 2.65 μM, 9.24 μM, 3.69 μM, 4.48 μM, and 4.81 μM, respectively.
Table 1
Demographic and clinical details of participants.
| Health states | Training set (male/female) | Age (years, mean ± SD, male/female) | Validation set (male/female) | Age (years, mean ± SD, male/female) |
|---|---|---|---|---|
| 354(282/72) | 1095(562/533) | |||
| Normal controls | ||||
| for lung | 177(141/36) | 60 ± 11 / 59 ± 11 | 69(27/42) | 60 ± 12 / 58 ± 12 |
| for colorectal | 144(66/78) | 62 ± 11 / 63 ± 10 | ||
| for gastric | 94(65/29) | 62 ± 11 / 60 ± 13 | ||
| for pancreatic | 115(56/59) | 60 ± 13 / 55 ±15 | ||
| Benign diseases | ||||
| Lung | 69(27/42) | 60 ± 12 / 58 ± 12 | ||
| Pneumonia | 52 | |||
| Phthisis | 1 | |||
| Nodule | 7 | |||
| Embolism | 1 | |||
| Interstitial lung disease | 8 | |||
| Colorectal | 61(35/26) | 57 ± 12 / 56 ± 11 | ||
| Colitis | 20 | |||
| Colonic polyps | 31 | |||
| Crohn's disease | 5 | |||
| Colonic ulcer | 4 | |||
| Colopathy | 1 | |||
| Gastric | 54(38/16) | 60 ± 10 / 62 ± 11 | ||
| Gastritis | 47 | |||
| Gastrohelcosis | 7 | |||
| Pancreatic | 67(34/33) | 57 ± 13 / 53 ± 14 | ||
| Acute pancreatic | 13 | |||
| Chronic pancreatitis | 16 | |||
| Pancreatitis | 28 | |||
| Pancreatic cyst | 10 | |||
| Cancers | ||||
| Lung | 177(141/36) | 69(27/42) | 60 ± 12 / 58 ± 12 | |
| stage I or II | 44(33/11) | 12(3/9) | ||
| stage III or IV | 87(76/11) | 41(14/27) | ||
| Colorectal | 144(66/78) | 62 ± 11 / 63 ± 9 | ||
| stage I or II | 58(26/32) | |||
| stage III or IV | 77(34/43) | |||
| Gastric | 94(65/29) | 63 ± 11 / 61 ± 13 | ||
| stage I or II | 21(17/4) | |||
| stage III or IV | 50(38/12) | |||
| Pancreatic | 115(56/59) | 60 ± 13 / 55 ±15 | ||
| stage I or II | 16(8/8) | |||
| stage III or IV | 48(19/29) |
Sample preparation
Serum sample was thawed at 4 °C, and then 50 μL of each sample was added to 950 μL of acetonitrile/methanol (3:2, v/v). The mixture was vortexed for 30 s and then stored at -20°C for 24 h. The supernatant was obtained after centrifugation separation at 15,000×g for 30 min and sequentially transferred into a new 1.5 mL tube and stored at -80 °C until use. 15 μL of the supernatant was spiked with 34 μL of the internal standard (3.17 μM PC(36:0)), and then 500 μL of dichloromethane and 200 μL of ultrapure water was added, followed by vortexing for 30 s. The mixture was centrifuged at 1,500×g for 10 min, and 100 μL of the organic phase was transferred into a new 1.5 mL tube. After the organic phase was dried at room temperature, the residue was redissolved in 1.5 mL of acetonitrile/methanol/water (3.6:5.4:1, v/v/v) with 10 mM ammonium acetate.
Mass spectrometry
All experiments were performed on a 9.4 T apex-ultra™ hybrid Qh-FTICR MS (Bruker Daltonics, Billerica, MA) equipped with TriVersa NanoMate® electrospray ionization source (Advion BioSciences, Ithaca, NY, USA). The sample was introduced by TriVersa NanoMate® with 0.5 psi gas pressure, 1.6 kV voltage in positive ion mode. The parameters of FTICR MS were as follows: both of the capillary and spray shield voltages were 0 V, the drying gas temperature was 150 °C. Mass spectrum was accumulated by 10 full scans over the m/z range of 700-900 with 512 kilobytes per second acquisition size at a resolution of 450,000 at m/z 400.
Data handling and analysis
Mass spectral data were obtained using Apex Control 3.0.0 software (Bruker Daltonics, Billerica, MA). Peaks with signal-to-noise ratio, relative intensity, and absolute intensity thresholds of 5, 0.1%, and 10,000, respectively, were chosen as reliable metabolites. After isotopic deconvolution and normalization against the intensity of the internal standard, the levels of six targeted phospholipids were calculated based on the calibration equations and then analyzed by Mann-Whitney U test. Potential effects of age on different pathophysiological states were assessed by partial least squares-discriminant analysis. The ROC analysis was used to calculate AUC. A p value of < 0.05 was considered as statistically significant. Statistical analyses were performed by SAS software (version 9.2, SAS Institute Inc.) and SPSS software (version 16.0, SPSS Inc.).
Structural identification of the targeted phospholipids
The identification of the targeted phospholipids was performed as described previously [20]. Briefly, the identification was based on the observed accurate molecular mass, isotope distribution, tandem mass spectra, and the comparison of tandem mass spectra of their corresponding standard compounds. The mass error was less than 0.0015 Da and the relative error of their isotopic intensities relative to their theoretical values was less than 5%. The collision-induced dissociation experiments were chosen to get tandem mass spectra of the targeted phospholipids.
Method validation for quantitative analysis
The reliability of the CBDInanoESI-FTICR MS platform for the quantification of these six phospholipids was validated through their linearity, limitation of detection (LOD), limitation of quantitation (LOQ), precision, stability, and spike-and-recovery.
To construct the calibration curves of each phospholipids, the mixed stock standard solution was diluted by the acetonitrile/methanol/water (3.6:5.4:1, v/v/v) with 10 mM ammonium acetate to 24, 25, 27, 28, 29, 210, 211, 212, 213 and 214 fold, respectively. And then 1200 μL of each of the resulting standard solutions was mixed with 10 μL of the internal standard as working solution (the final concentration of internal standard was 13.17 nM). Six runs for each of the working solutions were performed by the CBDInanoESI-FTICR MS. The calibration curves were generated between the concentration ratios of each phospholipids to the internal standard and the intensity ratios of their corresponding phospholipids to the internal standard, respectively. In addition, the calibration curve of PC(36:2) was also used for quantifying PC(36:3) because its commercial standard was not available. Each of the abovementioned working solutions were analyzed three times and the results were shown as mean ± standard deviation.
The mixed stock standard solution was also diluted by acetonitrile/methanol/water (3.6:5.4:1, v/v/v) with 10 mM ammonium acetate to obtain LOD (S/N=3) and LOQ (S/N=10) of SM(34:1), PC(34:2), PC(34:1), PC(36:4), and PC(36:2), respectively.
Quality control (QC) sample was prepared by mixing equal volume of 10 normal controls sera, 10 benign diseases patients sera, and 10 cancer patients sera. The experimental precision was assessed based on the intraday precision of three measured values of the QC sample on the same day and the interday precision of three measured values of the QC sample on nine consecutive days. The experimental stability was also investigated by analyzing QC sample once every 20 test samples, and a total of 73 QC spectra were obtained in this study.
To assess the effect of different matrixes on the efficiency and recovery of phospholipids extraction, the spike-and-recovery experiment was performed based on serum matrix (termed as set 1) and the corresponding supernatant matrix (set 2), respectively. Three different concentration solutions of the mixture of SM(34:1), PC(34:2), PC(34:1), PC(36:4), and PC(36:2) in acetonitrile/methanol/water (3.6:5.4:1, v/v/v) with 10 mM ammonium acetate were prepared as below: R1: 106.75 μM SM(34:1), 231.00 μM PC(34:2), 98.74 μM PC(34:1), 95.96 μM PC(36:4), and 95.47 μM PC(36:2); R2: 35.58 μM SM(34:1), 99.00 μM PC(34:2), 65.83 μM PC(34:1), 63.97 μM PC(36:4), and 63.65 μM PC(36:2); R3:. 5.34 μM SM(34:1), 33.00 μM PC(34:2), 32.91 μM PC(34:1), 31.99 μM PC(36:4), 31.82 μM PC(36:2). For the set 1, three equal volumes (each 50 μL of the diluted serum by addition of 40 μL water) of serum were mixed with 760 μL of the above-mentioned three different concentration solutions, respectively. The resulting mixtures were further mixed with 190 μL of acetonitrile/methanol (3:2, v/v) to precipitate serum proteins, respectively. The extraction process of phospholipids was performed based on the process in the section of sample preparation. For the set 2, the protein precipitant of 50 μL of the diluted serum by addition of 40 μL water was performed based on the process in section of sample preparation. And then 3 μL of the supernatant was mixed with 12 μL of the above mentioned three different concentrations, respectively, and the resulting solutions were termed as “new supernatants”. The phospholipids extraction of these “new supernatants” was performed as described in the section of sample preparation. These samples were analyzed by the CBDInanoESI-FTICR MS, and their levels were calculated based on their corresponding calibration equations.
Results
Quantitative method for measuring serum levels of SM(34:1), PC(34:2), PC(34:1), PC(36:4), and PC(36:2)
Five calibration equations of SM(34:1), PC(34:2), PC(34:1), PC(36:4), and PC(36:2) were established based on the CBDInanoESI-FTICR MS, along with correlation coefficients of > 0.98 and linearity ranges of around three orders of magnitude (Table 2). The LOD and the LOQ of SM(34:1), PC(34:2), PC(34:1), PC(36:4), and PC(36:2) ranged from 0.06 to 0.16 nM and from 0.45 to 1.16 nM, respectively. Both of the relative standard deviations (RSDs) of intraday and interday precision were < 17% (Table 2). In addition, the recoveries of SM(34:1), PC(34:2), PC(34:1), PC(36:4), and PC(36:2) in serum matrix (set 1) and the corresponding supernatant matrix (set 2) were from 62% to 109% and from 63% to 112%, respectively, along with their RSD% of less than 13% (Table 3), indicating that the detected levels in between the supernatant and serum were almost identical. Therefore, for the following experiments, the levels of these targeted phospholipids in the supernatant were determined. The RSD% of the QC sample indicated that the stability and reliability (RSD% < 20%) of the CBDInanoESI-FTICR MS platform were acceptable for complex biological sample analysis (Table S1).
Figure 1
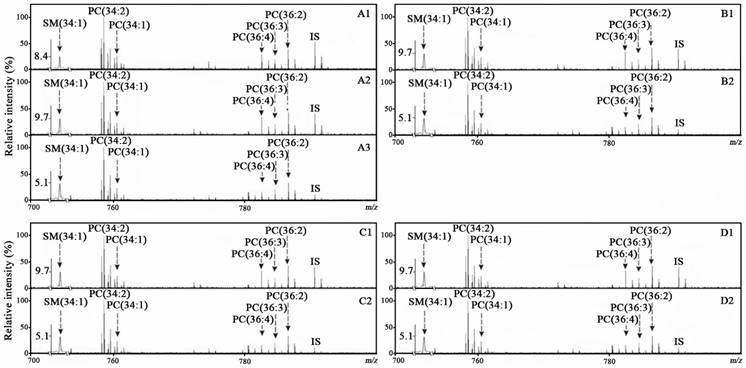
Representative positive-ion mass spectra of the targeted phospholipids from one normal control (A1), one with benign lung disease (A2), with lung cancer (A3), benign colorectal disease (B1), colorectal cancer (B2), benign gastric disease (C1), gastric cancer (C2), benign pancreatic disease (D1), and pancreatic cancer (D2).
Table 2
The linearity range, calibration curve, correlation coefficient (R2), limit of detection (LOD), and recovery of phospholipids.
| Analytes | Linearity (n=6) | Sensitivity | Precision (RSD%, n=9) | ||||||
|---|---|---|---|---|---|---|---|---|---|
| Linearity range (nM) | Calibration curve | (R2) | LOD (nM) | LOQ (nM) | Intraday | Interday | |||
| SM(34:1) | 0.32-166.06 | y=0.2214(±0.0058)x+0.0115(±0.0047) | 0.9998 | 0.16 | 0.32 | 7.64 | 6.02 | ||
| PC(34:2) | 1.13-578.02 | y=1.4798(±0.0175)x-1.0047(±0.0633) | 0.9919 | 0.14 | 1.13 | 6.65 | 8.83 | ||
| PC(34:1) | 0.45-230.59 | y=1.0432(±0.0268)x-0.1846(±0.0365) | 0.9934 | 0.06 | 0.45 | 9.11 | 9.72 | ||
| PC(36:4) | 0.55-280.14 | y=0.4990(±0.0086)x+0.2291(±0.0225) | 0.9814 | 0.07 | 0.55 | 9.21 | 16.16 | ||
| PC(36:2) | 0.59-300.99 | y=0.9143(±0.0122)x-0.1201(±0.0211) | 0.9993 | 0.07 | 0.59 | 6.86 | 13.14 | ||
X: the concentration ratios of individual phospholipids to internal standard; Y: the respective corresponding intensity ratios of phospholipid to internal standard; RSD: relative standard deviation.
Simultaneous quantification of the targeted phospholipids
In this study, SM(34:1), PC(34:2), PC(34:1), PC(36:4), PC(36:3), and PC(36:2) in serum samples from 599 normal controls, 251 patients with benign diseases (including lung, bowel, stomach, and pancreas) and 599 corresponding cancer patients were simultaneously detected using the CBDInanoESI-FTICR MS platform (Table 1). Their representative mass spectra from the participants with different pathophysiological states are shown in Figure 1. These targeted phospholipids were also confirmed on the basis of their observed masses with mass error of <0.0015 Da relative to their respective theoretical masses and their detected isotope distributions with the RSD% of < 5% relative to their respective theoretical distributions (Table S2). The levels of SM(34:1), PC(34:2), PC(34:1), PC(36:4), and PC(36:2) were calculated based on their respective calibration equations (Table 2), and PC(36:3) was calculated based on the calibration equation of PC(36:2). Their levels of the age-matched participants classified by gender are shown in Figures 2-5.
Association of the levels of these targeted phospholipids with pathophysiological states
For lung diseases, in the training set study, the levels of SM(34:1), PC(34:2), and PC(34:1) in both male and female lung cancer patients were significantly increased and PC(36:3) and PC(36:2) in male patients with lung cancer were only significantly increased relative to the normal controls with corresponding gender (Figure 2). In the validation set study, as shown in Figure 2, the levels of PC(36:4), PC(36:3), and PC(36:2) in both male and female with benign lung diseases were significantly decreased, and increased SM(34:1) and PC(34:1) in females with benign lung diseases and decreased PC(34:2) in male benign lung diseases were observed relative to the normal controls with corresponding gender. The levels of PC(34:2), PC(34:1), PC(36:3), and PC(36:2) in both males and females with lung cancer were remarkably increased compared with the corresponding benign lung diseases patients, while SM(34:1) was only significantly increased in male with lung cancer relative to male with benign lung diseases.
Figure 2
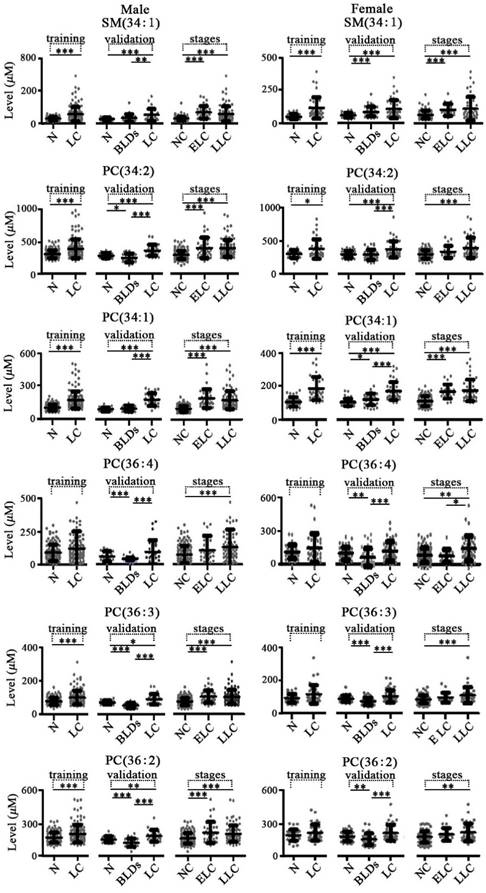
Scatter plots of serum levels of the targeted phospholipids for the training set, the validation set of lung diseases, as well as different stages of lung cancer. N, normal control; BLDs, benign lung diseases; LC, lung cancer; NC, non-lung cancers; ELC, early stage lung cancer (I or II); LLC, late stage lung cancer (III or IV). *, p < 0.05; **, p < 0.01; ***, p < 0.001.
For colorectal diseases, change trends of these targeted phospholipids in colorectal diseases are shown in Figure 3. It was found that the levels of SM(34:1), PC(34:2), PC(34:1), PC(36:4), and PC(36:2) in both males and females with colorectal cancer were significantly increased compared with the benign colorectal diseases or normal controls with the corresponding gender, except for PC(36:4) in male colorectal cancer and PC(36:3) in both females with benign colorectal diseases and females with colorectal cancer. In addition, significant increase in the levels of SM(34:1), PC(34:2), PC(34:1), PC(36:4), PC(36:3), and PC(36:2) in both males and females with colorectal cancer were detected relative to the benign colorectal diseases with corresponding gender, except for PC(36:4) in males and PC(36:3) in females. It should be noted that increased levels of PC(34:1) and PC(36:4) in both males and females with benign colorectal diseases were observed compared with the controls with corresponding gender.
For gastric diseases, expression levels of SM(34:1), PC(34:2), PC(34:1), PC(36:4), PC(36:3), and PC(36:2) were closely associated with pathophysiological states (Figure 4). For male and female groups, significantly increased levels of these six phospholipids in patients with gastric cancer were observed relative to the controls with corresponding gender and benign gastric diseases with corresponding gender (Figure 4). It is worth noting that remarkable differences in their levels between gastric cancer and benign gastric diseases for each gender group were also detected. In addition, expression levels of PC(34:2), PC(34:1), and PC(36:4) could also reflect the differences between controls and benign gastric diseases for both males and females, except for PC(36:4) in male group.
For pancreatic diseases, as shown in Figure 5, change trends of these six targeted phospholipids were different from the above mentioned diseases that originated from lung, stomach, and intestine. It is found that the level of PC(36:4) in both male and female patients with pancreatic cancer were significantly decreased compared with the controls with corresponding gender and the female patients with benign pancreatic diseases. In addition, for the female group, significantly decreased levels of SM(34:1), PC(34:2), PC(36:3) and PC(36:2) were detected relative to the corresponding controls and/or benign pancreatic diseases (Figure 5).
Table 3
The recovery of the targeted phospholipids.
| Analytes | Recovery of added analytes (%, n=3) | |||||||
|---|---|---|---|---|---|---|---|---|
| Concentration added (nM) | Serum (set 1) | Supernatant (set 2) | ||||||
| Detected (nM) | Recovery (%) | RSD (%) | Detected (nM) | Recovery (%) | RSD(%) | |||
| SM(34:1) | 155.15 | 110.77±7.86 | 71.39 | 7.10 | 107.28±7.46 | 69.15 | 6.96 | |
| 51.24 | 33.61±4.06 | 65.59 | 12.07 | 32.30±3.15 | 63.03 | 9.76 | ||
| 7.69 | 4.83±0.18 | 62.8 | 3.82 | 5.07±0.30 | 65.93 | 5.92 | ||
| PC(34:2) | 330.00 | 284.17±11.12 | 86.11 | 3.91 | 280.07±15.66 | 84.87 | 5.59 | |
| 134.64 | 101.74±6.34 | 75.56 | 6.23 | 101.02±3.26 | 75.03 | 3.23 | ||
| 47.52 | 36.07±1.12 | 75.91 | 3.11 | 36.92±0.43 | 77.69 | 1.16 | ||
| PC(34:1) | 143.50 | 117.20±3.51 | 81.67 | 3.00 | 111.51±3.79 | 77.71 | 3.40 | |
| 95.84 | 73.11±3.56 | 76.28 | 4.59 | 72.87±0.93 | 76.03 | 1.27 | ||
| 47.39 | 34.26±0.37 | 72.29 | 1.09 | 36.94±2.37 | 77.93 | 6.42 | ||
| PC(36:4) | 139.46 | 138.23±7.45 | 99.11 | 5.39 | 141.66±4.27 | 101.57 | 3.01 | |
| 93.15 | 96.61±2.97 | 103.43 | 3.08 | 105.34±4.63 | 112.78 | 4.40 | ||
| 46.06 | 51.95±0.83 | 109.73 | 1.60 | 50.53±2.47 | 106.73 | 4.90 | ||
| PC(36:2) | 138.75 | 107.89±2.40 | 77.76 | 2.23 | 109.87±1.50 | 79.19 | 1.36 | |
| 92.67 | 77.24±1.40 | 83.12 | 1.81 | 68.97±1.68 | 74.22 | 2.43 | ||
| 45.83 | 35.97±1.68 | 78.50 | 4.67 | 36.71±1.84 | 80.10 | 5.02 | ||
Association of the levels of the targeted phospholipids with cancer stages
As shown in Figure 2, significant increase in the levels of SM(34:1), PC(34:2), PC(34:1), PC(36:4), PC(36:3), and PC(36:2) in male patients with early stage or late stage lung cancer were observed compared with the controls plus benign lung diseases with corresponding gender, except for PC(36:4) in early stage. However, SM(34:1), PC(34:2), PC(34:1), PC(36:4), PC(36:3), and PC(36:2) in female patients with late stage lung cancer were only remarkably up-regulated relative to the female controls plus benign lung diseases, except for significant increase in the levels of SM(34:1) and PC(34:1) in early stage. As shown in Figure 3, significant increase in the levels of SM(34:1), PC(34:2), PC(34:1), PC(36:3), and PC(36:2) in both male and female patients with early stage or late stage colorectal cancer were observed relative to the controls plus benign colorectal diseases with corresponding gender, except for PC(36:3) in female group. For gastric cancer, gastric cancer stages are closely correlated with expression levels of these six phospholipids (Figure 4). SM(34:1), PC(34:2), PC(34:1) PC(36:4), PC(36:3), and PC(36:2) in males and females with early stage or late stage gastric cancer were significantly up-regulated relative to the controls plus benign gastric diseases with corresponding gender, except for PC(36:4), PC(36:3), and PC(36:2) in male early stage and PC(36:2) in female late stage. It should be noted that significant decrease in the levels of PC(34:2) and PC(36:4) in females with later stage gastric cancer and significant increase in the level of PC(36:3) in males with later stage gastric cancer were observed compared with the corresponding gender patients with early stage gastric cancer. As shown in Figure 5, for males with pancreatic diseases, increased PC(34:1) and decreased PC(36:4) in patients with late stage pancreatic cancer were remarkably observed relative to controls plus benign pancreatic diseases. For females with pancreatic diseases, decreased SM(34:1), PC(34:2), PC(36:4), PC(36:3), and PC(36:2) in late stage pancreatic cancer were detected compared with controls plus benign pancreatic diseases.
Diagnostic ability
To estimate the diagnostic ability of these six targeted phospholipids, ROC analysis was further performed. Finally, 18 of panels (i.e., panels a -r) are listed in Figure 6. It is found that panels a-k have good diagnostic ability to differentiate different pathophysiological states (Table 4 and Figure 7). For example, panel a has the AUC value of >0.91, the sensitivity of >83%, and the specificity of 83% to differentiate male controls from male lung cancer, panel b has the AUC value of >0.93, the sensitivity of >83%, and the specificity of 96% to differentiate female controls from female lung cancer, panel e has the AUC value of 0.929, the sensitivity of 81.5%, and the specificity of 96.3% to differentiate male benign lung diseases from male lung cancer, and panel f has the AUC value of 0.833, the sensitivity of 81.0%, and the specificity of 71.4% to differentiate female benign lung diseases from female lung cancer. Representative ROC curves are shown in Figure 8.
Figure 3
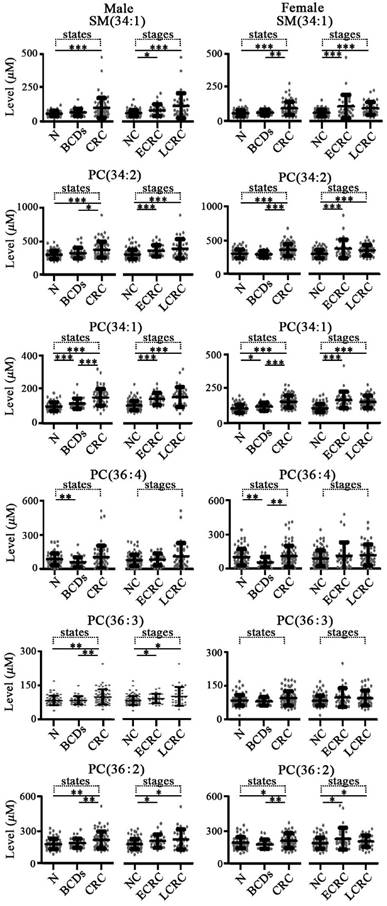
Scatter plots of serum levels of the targeted phospholipids from patients with different colorectal diseases and different stages of colorectal cancer. N, normal control; BCDs, benign colorectal diseases; CRC, colorectal cancer; NC, non-cancers; ECRC, early stage colorectal cancer (I or II); LCRC, late stage colorectal cancer (III or IV). *, p < 0.05; **, p < 0.01; ***, p < 0.001.
Figure 4
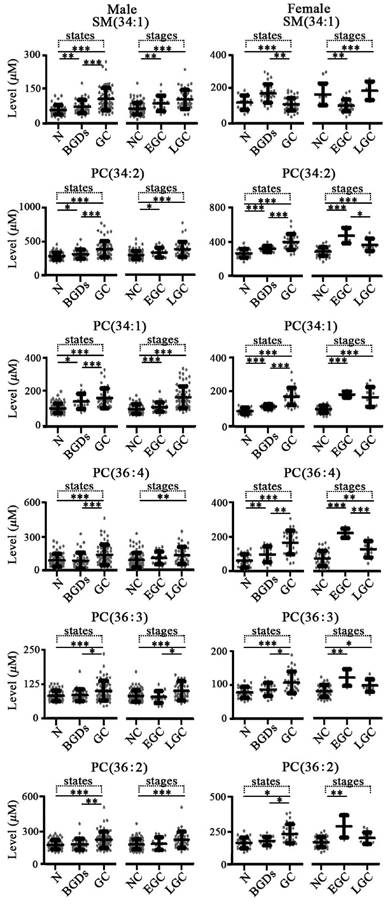
Scatter plots of serum levels of the targeted phospholipids from patients with different gastric diseases and different stages of gastric cancer. N, normal control; BGDs, benign gastric diseases; GC, gastric cancer; NC, non-cancers; EGC, early stage gastric cancer (I or II); LGC, late stage gastric cancer (III or IV). *, p < 0.05; **, p < 0.01; ***, p < 0.001.
Figure 5
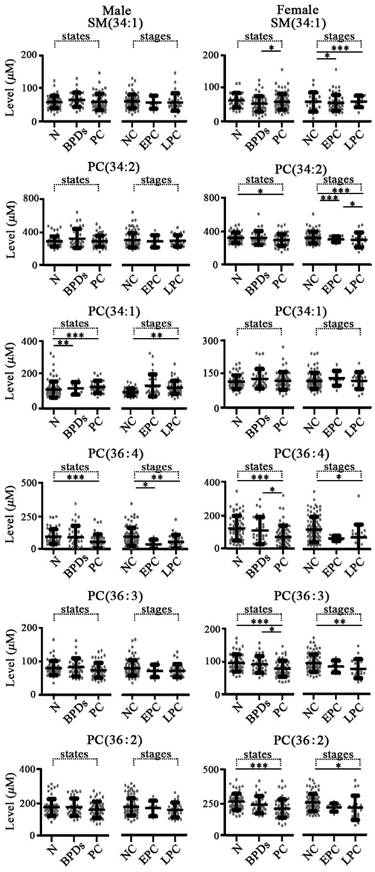
Scatter plots of serum levels of the targeted phospholipids from patients with different pancreatic diseases and different stages of pancreatic cancer. N, normal controls; BPDs, benign pancreatic diseases; PC, pancreatic cancer; NC, non-cancers; EPC, early stage pancreatic cancer (I or II); LPC, late stage pancreatic cancer (III or IV). *, p < 0.05; **, p < 0.01; ***, p < 0.001.
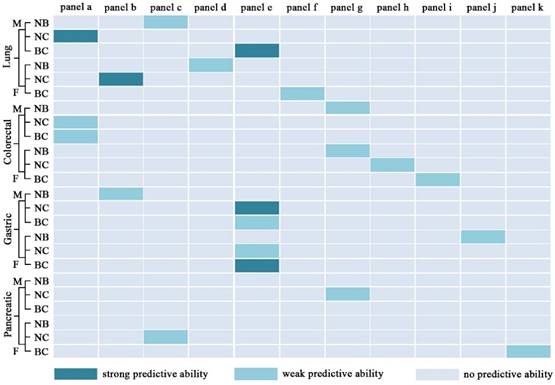
As shown in Figure 9, panels a, b, d, e, h, i, l, m, n, o, p, q, and r have good performance to perform early diagnosis for four types of cancer, and the details of their diagnostic performance are listed in Table 5. Some panels with the AUC of ≥0.9, the sensitivity of ≥80%, and the specificity of ≥80% are highlighted in dark green (Figure 9). For example, panel a exhibits excellent performance to differentiate male early stage lung cancer from male controls or male controls plus male benign lung diseases, along with the AUC of 0.95, the sensitivity of 83%, and the specificity of 90%, and panel l with the AUC of 0.90, the sensitivity of 90%, and the specificity of 77% has a good predictive ability to differentiate female early stage lung cancer from female controls or female controls plus female benign lung diseases. Representative ROC curves are shown in Figure 10.
Figure 6
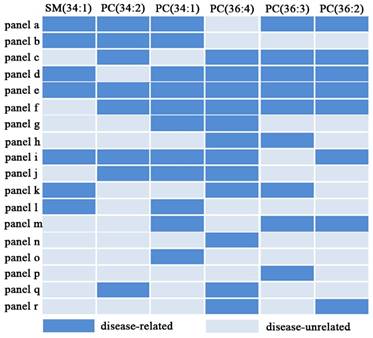
The 18 characteristic panels and their compositions.
Table 4
The AUC values, sensitivities, and specificities for differentiating normal controls (N), benign diseases (B), and cancer (C) based on different panels.
| Group | Sex | Panel | AUC | Sensitivity (%) | Specificity (%) | |
|---|---|---|---|---|---|---|
| Training set | ||||||
| Lung | NC | M | a | 0.913(.884-.942) | 83.6 | 83.6 |
| F | b | 0.938(.885-.990) | 83.3 | 97.2 | ||
| Validation set | ||||||
| Lung | NB | M | c | 0.871(.778-.965) | 81.5 | 81.5 |
| F | d | 0.900(.834-.966) | 71.4 | 97.6 | ||
| NC | M | a | 0.960(.909-1.000) | 92.6 | 96.3 | |
| F | b | 0.949(.902-.996) | 95.2 | 88.1 | ||
| BC | M | e | 0.929(.862-.995) | 81.5 | 96.3 | |
| F | f | 0.833(.750-.916) | 81.0 | 71.4 | ||
| Colorectal | NB | M | g | 0.841(.762-.920) | 88.6 | 69.7 |
| F | g | 0.884(.801-.967) | 80.8 | 88.5 | ||
| NC | M | a | 0.899(.846-.952) | 77.3 | 92.4 | |
| F | h | 0.899(.852-.946) | 80.8 | 85.9 | ||
| BC | M | a | 0.774(.683-.865) | 77.3 | 71.4 | |
| F | i | 0.815(.727-.903) | 73.1 | 80.8 | ||
| Gastric | NB | M | b | 0.700(.598-.803) | 81.6 | 55.4 |
| F | j | 0.873(.767-.979) | 87.5 | 75.9 | ||
| NC | M | e | 0.952(.919-.984) | 87.7 | 89.2 | |
| F | e | 0.899(.852-.946) | 80.8 | 85.9 | ||
| BC | M | e | 0.851(.779-.923) | 70.8 | 89.5 | |
| F | e | 0.925(.843-1.000) | 86.2 | 100.0 | ||
| Pancreatic | NB | M | N/A | N/A | N/A | N/A |
| F | N/A | N/A | N/A | N/A | ||
| NC | M | g | 0.898(.842-.954) | 87.5 | 76.8 | |
| F | c | 0.781(.698-.865) | 83.1 | 62.7 | ||
| BC | M | N/A | N/A | N/A | N/A | |
| F | k | 0.672(.561-.784) | 64.4 | 63.6 | ||
NB, between N and B; NC, between N and C; BC, between B and C; M, male; F, female.
Figure 7
Diagnostic performance of different panels for differentiating between normal controls (N), benign diseases (B), and cancers (C). NB for differentiating N from B; NC for differentiating N from C; BC for differentiating B from C; M, male; F, female. Strong predictive ability: AUC≥0.9, sensitivity≥80%, and specificity≥80%; weak predictive ability: AUC < 0.9, or sensitivity < 80%, or specificity < 80%.
Discussion
In this study, the mixture of acetonitrile and methanol (3:2, v/v) was used to remove serum proteins [25], followed by phospholipids extraction with methylene chloride. Simultaneous quantitative analysis of six phospholipids was performed based on the CBDInanoESI-FTICR MS platform, and the levels of SM(34:1), PC(34:2), PC(34:1) PC(36:4), and PC(36:2) were calculated in term of their respective corresponding calibration equations (Table 2), and PC(36:3) was calculated based on the calibration equation of PC(36:2). In addition, in order to reduce the intensities of adduct ions, such as [M+Na]+ and [M+K]+, which are generated in positive ion mode, 5 mM ammonium acetate solution was used to redissolve the dried samples prior to the CBDInanoESI-FTICR MS analysis [25, 26]. The quantitative method on the CBDInanoESI-FTICR MS platform demonstrated that the linearity, sensitivity, precision, and recovery are acceptable for complex biological sample analysis (Table 2). The recoveries of phospholipids in both serum and the corresponding supernatant were almost identical (Table 3). Therefore, in this study, we selected the addition of the internal standard (PC(36:0)) in supernatant instead of in serum to determine the levels of these six targeted phospholipids for enhancing the usage rate of serum samples.
Figure 8
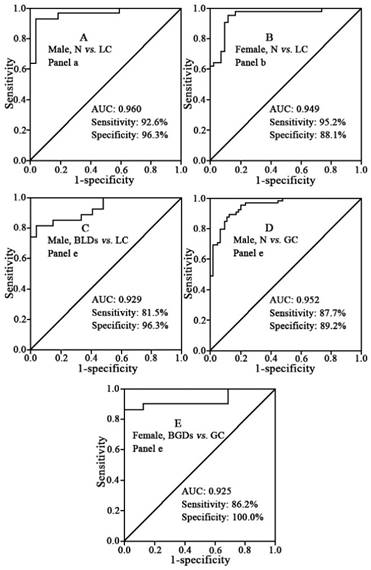
Representative ROC curves between normal controls (N), benign diseases, and cancers. (A) panel a for differentiating male normal controls from male patients with lung cancer. (B) panel b for differentiating female normal controls from female patients with lung cancer. (C) panel e for differentiating male patients with benign lung diseases from male patients with lung cancer. (D) panel e for differentiating male normal controls from male patients with gastric cancer. (E) panel e for differentiating female patients with benign gastric diseases from female patients with gastric cancer.
Figure 9
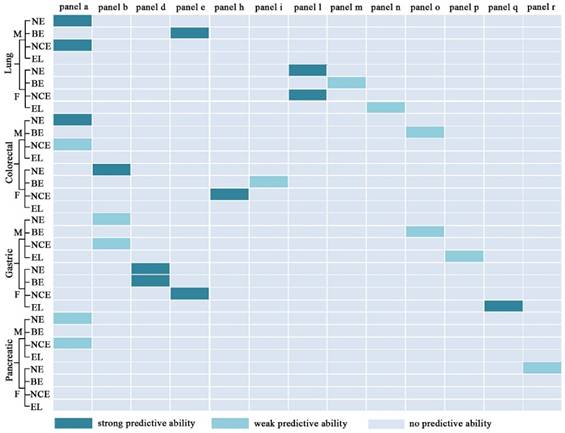
Diagnostic performance of different panels for differentiating normal controls (N), benign diseases (B), non-cancers (NC), early stage caner (E), and late stage cancer (L). NE for differentiating N from E; BE for differentiating B from E; NCE for differentiating NC from E; EL for differentiating E from L. Strong predictive ability: AUC≧0.9, sensitivity≧ 80%, and specificity≧80%; weak predictive ability: AUC < 0.9, or sensitivity < 80%, or specificity < 80%. M, male; F, female
Figure 10
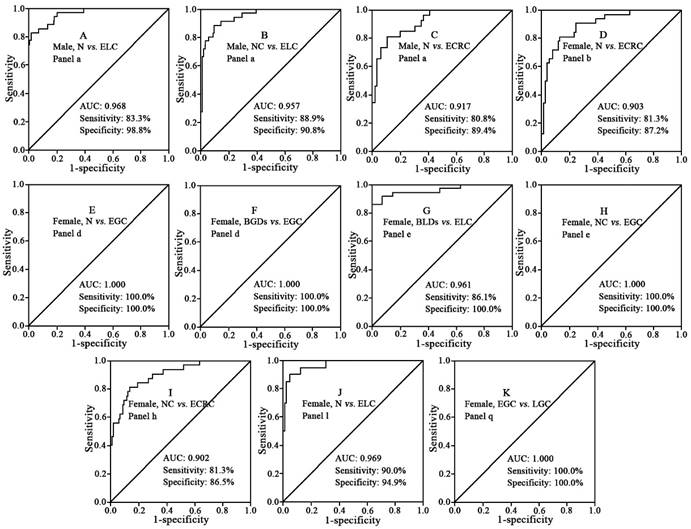
Representative ROC curves between normal controls (N), benign diseases, non-cancers (NC), early stage cancer (E), and late stage cancer (L). (A) panel a for differentiating male normal controls from male patients with early stage lung cancer. (B) panel a for differentiating male patients with non-cancers and male patients with early stage lung cancer. (C) panel a for differentiating male normal controls from male patients with early stage colorectal cancer. (D) panel b for differentiating female normal controls from female patients with early stage colorectal cancer. (E) panel d for differentiating female normal controls from female patients with early stage gastric cancer. (F) panel d for differentiating female patients with benign gastric diseases from patients with early stage gastric cancer. (G) panel e for differentiating male patients with benign lung diseases from male patients with early stage lung cancer. (H) panel e for differentiating female non-cancer patients from female patients with early stage gastric cancer. (I) panel h for differentiating female non-cancers patients from female patients with early stage colorectal cancer. (J) panel l for differentiating female normal controls from female patients with early stage lung cancer. (K) panel q for differentiating female patients with early stage gastric cancer from female patients with late stage gastric cancer.
Table 5
The AUC values, sensitivities, and specificities for differentiating normal controls (N), benign diseases (B), non-cancers (NC), early stage cancers (E), and late stage cancers (L) based on different panels.
| Compared group | Sex | Panel | AUC | Sensitivity (%) | Specificity (%) | |
|---|---|---|---|---|---|---|
| Lung | NE | M | a | 0.968(.940-.996) | 83.3 | 98.8 |
| F | l | 0.969(.934-1.000) | 90.0 | 94.9 | ||
| BE | M | e | 0.961(.915-1.000) | 86.1 | 100.0 | |
| F | m | 0.807(.695-.919) | 65.0 | 83.3 | ||
| NCE | M | a | 0.957(.926-.989) | 88.9 | 90.8 | |
| F | l | 0.903(.841-.966) | 90.0 | 77.5 | ||
| EL | M | N/A | N/A | N/A | N/A | |
| F | n | 0.700(.568-.832) | 44.2 | 95.0 | ||
| Colorectal | NE | M | a | 0.917(.859-.976) | 80.8 | 89.4 |
| F | b | 0.903(.841-.964) | 81.3 | 87.2 | ||
| BE | M | o | 0.758(.634-.883) | 80.8 | 65.7 | |
| F | i | 0.822(.713-.932) | 84.4 | 73.1 | ||
| NCE | M | a | 0.851(.773-.930) | 73.1 | 87.1 | |
| F | h | 0.902(.842-.962) | 81.3 | 86.5 | ||
| EL | M | N/A | N/A | N/A | N/A | |
| F | N/A | N/A | N/A | N/A | ||
| Gastric | NE | M | b | 0.833(.717-.948) | 76.5 | 83.1 |
| F | d | 1.000(1.000-1.000) | 100.0 | 100.0 | ||
| BE | M | o | 0.740(.587-.893) | 76.5 | 73.7 | |
| F | d | 1.000(1.000-1.000) | 100.0 | 100.0 | ||
| NCE | M | b | 0.801(.690-.913) | 88.2 | 59.2 | |
| F | e | 1.000(1.000-1.000) | 100.0 | 100.0 | ||
| EL | M | p | 0.701(.552-.850) | 78.9 | 64.7 | |
| F | q | 1.000(1.000-1.000) | 100.0 | 100.0 | ||
| Pancreatic | NE | M | a | 0.833(.680-.985) | 75.0 | 80.4 |
| F | r | 0.794(.687-.902) | 100.0 | 71.2 | ||
| BE | M | N/A | N/A | N/A | N/A | |
| F | N/A | N/A | N/A | N/A | ||
| NCE | M | a | 0.775(.629-.921) | 75.0 | 73.3 | |
| F | N/A | N/A | N/A | N/A | ||
| EL | M | N/A | N/A | N/A | N/A | |
| F | N/A | N/A | N/A | N/A | ||
NE, between N and E; BE, between B and E; NCE, between NC and E; EL, between E and L; M, male; F, female.
Due to the gender-related differences in lipid metabolism [27-30] and the associations of incidence, mortality, survival rate, and prognosis of chronic diseases with gender [31-34], in this study, we have performed separate statistical analyses for males and females. Statistical results reveal that changes in the levels of these targeted phospholipids are significantly correlated with gender, pathophysiological states, types of cancers, and cancer stages. It should be noted that these six targeted phospholipids, specifically for SM(34:1), PC(34:2), and PC(34:1), were significantly up-regulated in lung, colorectal, and gastric cancer relative to pancreatic cancer, suggesting that these phospholipids metabolism may have different metabolic pathways for the diseases of different organs, which are consistent with previous studies [16-18]. Increased levels of PCs and SM may correlate with the overexpression of choline kinase in various cancers [35-37]. In addition, phospholipids are first synthesized via the Kennedy pathway followed by the remodeling pathway (Lands' cycle). It should be noted that during this process, alterations in the expression of lysophospholipid acyltransferases, which play essential roles in regulating the synthesis of phospholipids [38], are closely correlated with cancers [39, 40].
For these four types of cancer, increased levels of the targeted phospholipids in lung, colorectal, and gastric cancer as well as their decreased levels in pancreatic cancer were observed, and these findings may be associated with the reduced generation of lipid hydroperoxides synthesized by phospholipid hydroperoxide glutathione peroxidase, which are in agreement with the decreased number of this enzyme in pancreatic cancer cell lines [41].
For lung diseases, the opposite trends in the levels of PC(34:2), PC(36:4), PC(36:3), and PC(36:2) between benign lung diseases and lung cancer relative to controls were detected (Figure 2). These results suggest that different metabolic pathways between these two pathological states may exist. For colorectal diseases and gastric diseases, increased trends of the levels of SM(34:1) PC(34:2), PC(34:1), PC(36:4), PC(36:3), and PC(36:2) in male and female cancer patients were detected compared with the benign diseases patients with corresponding gender, except for SM(34:1) in the female gastric diseases. However, for pancreatic diseases, the opposite trends were detected in the males and females. Taken together, our findings indicate that different organs and different pathological states may have different phospholipids metabolisms and that phospholipids may be good organ-specific and pathology-specific biomarkers.
In addition, most potential biomarkers were obtained by comparison between cancer and normal controls [19, 42-44], and their clinical diagnosis performance are usually affected by some benign diseases. In this study, we not only compared the levels of six targeted phospholipids between controls, benign diseases, and corresponding cancer, but also between different diseases originated from four types of organ. Finally, ROC analysis revealed that 18 of panels of these six phospholipids have exhibited good performance to differentiate normal controls, benign diseases, cancers, early stage cancer, and late stage cancer. For example, panels a, b, and e have powerful diagnostic ability to differentiate different pathophysiological states, and panels a, b, d, e, h, l, and q have strong capacity to differentiate different cancer stages, with the AUC of ≥0.9, the sensitivity of ≥80%, and the specificity of ≥80%, which are better than CEA, Cyfra21-1, CA724, or CA19-9 [45-48].
Conclusions
In this study, simultaneous quantification of SM(34:1), PC(34:2), PC(34:1) PC(36:4), PC(36:3), and PC(36:2) in 1449 serum samples was performed based on CBDInanoESI-FTICR MS. Our findings have revealed that significant differences in the levels of these six phospholipids between different pathophysiological states and between different cancer stages were observed after the gender classification. Different combinations of SM(34:1), PC(34:2), PC(34:1) PC(36:4), PC(36:3), and PC(36:2) have exhibited high diagnostic ability to differentiate different pathophysiological states and/or cancer stages.
Supplementary Material
Supplementary tables.
Acknowledgements
This study was funded by Natural Science Foundation of Beijing Municipality (grant No.7162127) to Z. Li
Competing interests
All authors disclose any affiliations that are considered to be relevant and important with any organization that to our knowledge has any direct interest in the subject matter discussed.
References
1. Torre LA, Bray F, Siegel RL, Ferlay J, Lortet-Tieulent J, Jemal A. Global cancer statistics, 2012. CA Cancer J Clin. 2015;65:87-108
2. Ferlay J, Soerjomataram I, Dikshit R, Eser S, Mathers C, Rebelo M, Parkin DM, Forman D, Bray F. Cancer incidence and mortality worldwide: sources, methods and major patterns in GLOBOCAN 2012. Int J Cancer. 2015;136:E359-386
3. Bach PB, Mirkin JN, Oliver TK, Azzoli CG, Berry DA, Brawley OW, Byers T, Colditz GA, Gould MK, Jett JR, Sabichi AL, Smith-Bindman R, Wood DE, Qaseem A, Detterbeck FC. Benefits and harms of CT screening for lung cancer: a systematic review. JAMA. 2012;307:2418-2429
4. Saeed. I, Anderson J. Cancer of the lung: staging,radiology, surgery. Surgery. 2011;29:221-226
5. Goggins M. Markers of pancreatic cancer: working toward early detection. Clin Cancer Res. 2011;17:635-637
6. Lagace TA, Ridgway ND. The role of phospholipids in the biological activity and structure of the endoplasmic reticulum. Biochimica Et Biophysica Acta-Molecular Cell Research. 2013;1833:2499-2510
7. Bandu R, Mok HJ, Kim KP. Phospholipids as cancer biomarkers: Mass spectrometry-based analysis. Mass Spectrom Rev. 2016
8. Hiller K, Metallo CM. Profiling metabolic networks to study cancer metabolism. Current Opinion in Biotechnology. 2013;24:60-68
9. McCarthy SA, Mufson RA, Pearce EJ, Rathmell JC, Howcroft TK. Metabolic Reprogramming of the Immune Response in the Tumor Microenvironment. Cancer Biology & Therapy. 2013;14:315-318
10. Ferreira LMR, Hebrant A, Dumont JE. Metabolic reprogramming of the tumor. Oncogene. 2012;31:3999-4011
11. Sonnino S, Prinetti A. Membrane domains and the "lipid raft" concept. Curr Med Chem. 2013;20:4-21
12. Segui B, Andrieu-Abadie N, Jaffrezou JP, Benoist H, Levade T. Sphingolipids as modulators of cancer cell death: potential therapeutic targets. Biochim Biophys Acta. 2006;1758:2104-2120
13. Fagone P, Jackowski S. Phosphatidylcholine and the CDP-choline cycle. Biochim Biophys Acta. 2013;1831:523-532
14. Ridgway ND. The role of phosphatidylcholine and choline metabolites to cell proliferation and survival. Crit Rev Biochem Mol Biol. 2013;48:20-38
15. Lee GK, Lee HS, Park YS, Lee JH, Lee SC, Lee JH, Lee SJ, Shanta SR, Park HM, Kim HR, Kim IH, Kim YH, Zo JI, Kim KP, Kim HK. Lipid MALDI profile classifies non-small cell lung cancers according to the histologic type. Lung Cancer. 2012;76:197-203
16. Ishikawa S, Tateya I, Hayasaka T, Masaki N, Takizawa Y, Ohno S, Kojima T, Kitani Y, Kitamura M, Hirano S, Setou M, Ito J. Increased expression of phosphatidylcholine (16:0/18:1) and (16:0/18:2) in thyroid papillary cancer. PLoS One. 2012;7:e48873
17. Kang S, Lee A, Park YS, Lee SC, Park SY, Han SY, Kim KP, Kim YH, Yoo CW, Kim HK. Alteration in lipid and protein profiles of ovarian cancer: similarity to breast cancer. Int J Gynecol Cancer. 2011;21:1566-1572
18. Zhou X, Mao J, Ai J, Deng Y, Roth MR, Pound C, Henegar J, Welti R, Bigler SA. Identification of plasma lipid biomarkers for prostate cancer by lipidomics and bioinformatics. PLoS One. 2012;7:e48889
19. Li F, Qin X, Chen H, Qiu L, Guo Y, Liu H, Chen G, Song G, Wang X, Li F, Guo S, Wang B, Li Z. Lipid profiling for early diagnosis and progression of colorectal cancer using direct-infusion electrospray ionization Fourier transform ion cyclotron resonance mass spectrometry. Rapid Commun Mass Spectrom. 2013;27:24-34
20. Guo Y, Wang X, Qiu L, Qin X, Liu H, Wang Y, Li F, Wang X, Chen G, Song G, Li F, Guo S, Li Z. Probing gender-specific lipid metabolites and diagnostic biomarkers for lung cancer using Fourier transform ion cyclotron resonance mass spectrometry. Clin Chim Acta. 2012;414:135-141
21. Zhang Y, Qiu L, Wang Y, Qin X, Li Z. High-throughput and high-sensitivity quantitative analysis of serum unsaturated fatty acids by chip-based nanoelectrospray ionization-Fourier transform ion cyclotron resonance mass spectrometry: early stage diagnostic biomarkers of pancreatic cancer. Analyst. 2014;139:1697-1706
22. Szarka S, Prokai L. Chip-based nanoelectrospray ionization with Fourier transform mass spectrometric detection to screen for local anesthetics intended to mask limb sore in walking horses. J Mass Spectrom. 2015;50:533-537
23. Zhang YP, He CY, Qiu L, Wang YM, Zhang L, Qin XZ, Liu YJ, Zhang D, Li ZL. Serum Unsaturated Free Fatty Acids: Potential Biomarkers for Early Detection and Disease Progression Monitoring of Non-Small Cell Lung Cancer. Journal of Cancer. 2014;5:706-714
24. Zhang YP, Song LN, Liu N, He CY, Li ZL. Decreased serum levels of free fatty acids are associated with breast cancer. Clinica Chimica Acta. 2014;437:31-37
25. Gao F, Zhang Z, Fu X, Li W, Wang T, Liu H. Analysis of phospholipids by NACE with on-line ESI-MS. Electrophoresis. 2007;28:1418-1425
26. Guan F, Uboh C, Soma L, Hess A, Luo Y, Tsang DS. Sensitive liquid chromatographic/tandem mass spectrometric method for the determination of beclomethasone dipropionate and its metabolites in equine plasma and urine. J Mass Spectrom. 2003;38:823-838
27. Guo YM, Wang XM, Qiu L, Qin XZ, Liu H, Wang YY, Li F, Wang XD, Chen GQ, Song GG, Li FJ, Guo S, Li ZL. Probing gender-specific lipid metabolites and diagnostic biomarkers for lung cancer using Fourier transform ion cyclotron resonance mass spectrometry. Clinica Chimica Acta. 2012;414:135-141
28. Kim SE, Paik HY, Yoon H, Lee JE, Kim N, Sung MK. Sex- and gender-specific disparities in colorectal cancer risk. World J Gastroenterol. 2015;21:5167-5175
29. Nainani P, Paliwal A, Nagpal N, Agrawal M. Sex hormones in gender-specific risk for head and neck cancer: A review. J Int Soc Prev Community Dent. 2014;4:S1-4
30. Chen G, Zhang L, Wang Y, Guo Y, Liu H, Li Z. Letter to the editor. Probing gender-specific change in IgG1 Fc-galactosylation in non-small cell lung cancer patients treated with epidermal growth factor receptor inhibitor. Rapid Commun Mass Spectrom. 2013;27:1168-1172
31. Chou CL, Weng SF, Lin JK, Chang SC. Role for gender in colorectal cancer risk: a Taiwan population-based study. Int J Colorectal Dis. 2013;28:1001-1008
32. Gao RN, Neutel CI, Wai E. Gender differences in colorectal cancer incidence, mortality, hospitalizations and surgical procedures in Canada. J Public Health (Oxf). 2008;30:194-201
33. Sah BK, Zhu ZG, Wang XY, Yang QM, Chen MM, Xiang M, Chen J, Yan M. Post-operative complications of gastric cancer surgery: female gender at high risk. Eur J Cancer Care (Engl). 2009;18:202-208
34. Maguire A, Porta M, Sanz-Anquela JM, Ruano I, Malats N, Pinol JL. Sex as a prognostic factor in gastric cancer. Eur J Cancer. 1996;32A:1303-1309
35. Byeon SK, Lee JY, Moon MH. Optimized extraction of phospholipids and lysophospholipids for nanoflow liquid chromatography-electrospray ionization-tandem mass spectrometry. Analyst. 2012;137:451-458
36. Janardhan S, Srivani P, Sastry GN. Choline kinase: an important target for cancer. Curr Med Chem. 2006;13:1169-1186
37. Ramirez de Molina A, Rodriguez-Gonzalez A, Gutierrez R, Martinez-Pineiro L, Sanchez J, Bonilla F, Rosell R, Lacal J. Overexpression of choline kinase is a frequent feature in human tumor-derived cell lines and in lung, prostate, and colorectal human cancers. Biochem Biophys Res Commun. 2002;296:580-583
38. Shindou H, Hishikawa D, Harayama T, Yuki K, Shimizu T. Recent progress on acyl CoA: lysophospholipid acyltransferase research. J Lipid Res. 2009;50(Suppl):S46-51
39. Mansilla F, da Costa KA, Wang S, Kruhoffer M, Lewin TM, Orntoft TF, Coleman RA, Birkenkamp-Demtroder K. Lysophosphatidylcholine acyltransferase 1 (LPCAT1) overexpression in human colorectal cancer. J Mol Med (Berl). 2009;87:85-97
40. Uehara T, Kikuchi H, Miyazaki S, Iino I, Setoguchi T, Hiramatsu Y, Ohta M, Kamiya K, Morita Y, Tanaka H, Baba S, Hayasaka T, Setou M, Konno H. Overexpression of Lysophosphatidylcholine Acyltransferase 1 and Concomitant Lipid Alterations in Gastric Cancer. Ann Surg Oncol. 2016;23(Suppl 2):S206-213
41. Liu J, Du J, Zhang Y, Sun W, Smith BJ, Oberley LW, Cullen JJ. Suppression of the malignant phenotype in pancreatic cancer by overexpression of phospholipid hydroperoxide glutathione peroxidase. Hum Gene Ther. 2006;17:105-116
42. Li P, Zhang D, Guo C. Serum biomarker screening for the diagnosis of early gastric cancer using SELDI-TOF-MS. Mol Med Rep. 2012;5:1531-1535
43. Hocker JR, Peyton MD, Lerner MR, Mitchell SL, Lightfoot SA, Lander TJ, Bates-Albers LM, Vu NT, Hanas RJ, Kupiec TC, Brackett DJ, Hanas JS. Serum discrimination of early-stage lung cancer patients using electrospray-ionization mass spectrometry. Lung Cancer. 2011;74:206-211
44. Kobayashi T, Nishiumi S, Ikeda A, Yoshie T, Sakai A, Matsubara A, Izumi Y, Tsumura H, Tsuda M, Nishisaki H, Hayashi N, Kawano S, Fujiwara Y, Minami H, Takenawa T, Azuma T, Yoshida M. A novel serum metabolomics-based diagnostic approach to pancreatic cancer. Cancer Epidemiol Biomarkers Prev. 2013;22:571-579
45. Okamura K, Takayama K, Izumi M, Harada T, Furuyama K, Nakanishi Y. Diagnostic value of CEA and CYFRA 21-1 tumor markers in primary lung cancer. Lung Cancer. 2013;80:45-49
46. Kim G, Jung EJ, Ryu CG, Hwang DY. Usefulness of carcinoembryonic antigen for monitoring tumor progression during palliative chemotherapy in metastatic colorectal cancer. Yonsei Med J. 2013;54:116-122
47. Chen XZ, Zhang WK, Yang K, Wang LL, Liu J, Wang L, Hu JK, Zhang B, Chen ZX, Chen JP, Zhou ZG, Mo XM. Correlation between serum CA724 and gastric cancer: multiple analyses based on Chinese population. Mol Biol Rep. 2012;39:9031-9039
48. Molina V, Visa L, Conill C, Navarro S, Escudero JM, Auge JM, Filella X, Lopez-Boado MA, Ferrer J, Fernandez-Cruz L, Molina R. CA 19-9 in pancreatic cancer: retrospective evaluation of patients with suspicion of pancreatic cancer. Tumour Biol. 2012;33:799-807
Author contact
![]() Corresponding author: Zhili Li, Department of Biophysics and Structural Biology, Institute of Basic Medical Sciences, Chinese Academy of Medical Sciences & School of Basic Medicine, Peking Union Medical College, 5 Dongdan San Tiao, Beijing 100005, PR China. E-mail: lizhilipumc.edu.cn; Tel/Fax: +86-10-69156479.
Corresponding author: Zhili Li, Department of Biophysics and Structural Biology, Institute of Basic Medical Sciences, Chinese Academy of Medical Sciences & School of Basic Medicine, Peking Union Medical College, 5 Dongdan San Tiao, Beijing 100005, PR China. E-mail: lizhilipumc.edu.cn; Tel/Fax: +86-10-69156479.
Citation styles
APA
Guo, Y., Ren, J., Li, X., Liu, X., Liu, N., Wang, Y., Li, Z. (2017). Simultaneous Quantification of Serum Multi-Phospholipids as Potential Biomarkers for Differentiating Different Pathophysiological states of lung, stomach, intestine, and pancreas. Journal of Cancer, 8(12), 2191-2204. https://doi.org/10.7150/jca.19128.
ACS
Guo, Y.; Ren, J.; Li, X.; Liu, X.; Liu, N.; Wang, Y.; Li, Z. Simultaneous Quantification of Serum Multi-Phospholipids as Potential Biomarkers for Differentiating Different Pathophysiological states of lung, stomach, intestine, and pancreas. J. Cancer 2017, 8 (12), 2191-2204. DOI: 10.7150/jca.19128.
NLM
Guo Y, Ren J, Li X, Liu X, Liu N, Wang Y, Li Z. Simultaneous Quantification of Serum Multi-Phospholipids as Potential Biomarkers for Differentiating Different Pathophysiological states of lung, stomach, intestine, and pancreas. J Cancer 2017; 8(12):2191-2204. doi:10.7150/jca.19128. https://www.jcancer.org/v08p2191.htm
CSE
Guo Y, Ren J, Li X, Liu X, Liu N, Wang Y, Li Z. 2017. Simultaneous Quantification of Serum Multi-Phospholipids as Potential Biomarkers for Differentiating Different Pathophysiological states of lung, stomach, intestine, and pancreas. J Cancer. 8(12):2191-2204.
This is an open access article distributed under the terms of the Creative Commons Attribution (CC BY-NC) license (https://creativecommons.org/licenses/by-nc/4.0/). See http://ivyspring.com/terms for full terms and conditions.