Journal of Cancer
ISSN: 1837-9664
3.2
Impact Factor
ISSN: 1837-9664

 Global reach, higher impact
J Cancer 2017; 8(12):2282-2295. doi:10.7150/jca.19967 This issue Cite
Research Paper
Silencing of HJURP induces dysregulation of cell cycle and ROS metabolism in bladder cancer cells via PPARγ-SIRT1 feedback loop
Rui Cao1, Gang Wang1, Kaiyu Qian1,2, Liang Chen1, Guofeng Qian3, Conghua Xie4, Han C. Dan5, Wei Jiang1,6, Min Wu7, Chin-Lee Wu8, Yu Xiao1,9 ![]() , Xinghuan Wang1
, Xinghuan Wang1 ![]()
1. Department of Urology, Zhongnan Hospital of Wuhan University, Wuhan, China;
2. Department of Urology, The Fifth Hospital of Wuhan, Wuhan, China;
3. Department of Endocrinology, The First Affiliated Hospital of Zhejiang University, Hangzhou, China;
4. Department of Radiation and Medical Oncology, Zhongnan Hospital of Wuhan University, Wuhan, China.
5. Greenebaum Cancer Center, School of Medicine, University of Maryland, Baltimore, MD, USA.
6. Medical Research Institute, School of Medicine, Wuhan University, Wuhan, China;
7. College of Life Science, Wuhan University, Wuhan, China.
8. Department of Urology, Massachusetts General Hospital, Harvard Medical School, Boston, Massachusetts, USA.
9. Department of Biological Repositories, Zhongnan Hospital of Wuhan University, Wuhan, China.
Received 2017-3-7; Accepted 2017-5-10; Published 2017-7-20
Citation:
Cao R, Wang G, Qian K, Chen L, Qian G, Xie C, Dan HC, Jiang W, Wu M, Wu CL, Xiao Y, Wang X. Silencing of HJURP induces dysregulation of cell cycle and ROS metabolism in bladder cancer cells via PPARγ-SIRT1 feedback loop. J Cancer 2017; 8(12):2282-2295. doi:10.7150/jca.19967. https://www.jcancer.org/v08p2282.htm
Other stylesAbstract
Holliday Junction Recognition Protein (HJURP) is a centromeric histone chaperone involving in de novo histone H3 variant CenH3 (CENP-A) recruitment. Our transcriptome and in vivo study revealed that HJURP is significantly upregulated in bladder cancer (BCa) tissues at both mRNA and protein levels. Knockdown of HJURP inhibited proliferation and viability of BCa cell lines revealed by CCK-8, colony formation and Ki-67-staining assays, and induced apoptosis and reactive oxygen species (ROS) production, as well as triggered cell cycle arrest at G0/G1 phase possibly via loss of CENP-A. Interestingly, in the HJURP-reduced BCa cells the levels of PPARγ and acetylated-p53 were increased, while the ratio of phosphorylated/total SIRT1 protein was decreased. Moreover, after treatment of the BCa cells using PPARγ antagonist (GW9662) and SIRT1 agonist (resveratrol, RSV) respectively, thee phenotypes of cell cycle arrest, increased ROS production and inhibited proliferation rate were all rescued. Taken together, our results suggested that HJURP might regulate proliferation and apoptosis via the PPARγ-SIRT1 negative feedback loop in BCa cells.
Keywords: Bladder cancer, HJURP, cell cycle, ROS, PPARγ, SIRT1
Introduction
Bladder cancer (BCa) is currently one of the most common cancers [1], but the underlying mechanism of the muscle-invasive or metastatic BCa has not been clarified yet [2]. Our group has completed a transcriptome analysis using BCa tissues and normal bladder epithelium [3-5], revealing several significantly affected related pathways and hundreds of genes. One of the most significantly upregulated genes in BCa tissue is the Holliday Junction Recognition Protein (HJURP), a histone chaperone in nucleosome involved in de novo histone H3 variant CenH3 (CENP-A) [6] and CENP-C recruitment [7]. HJURP has been reported to be able to regulate expansion of centromeric chromatin [8] and chromosomal stability [9]. Recent studies suggested that HJURP participated in the regulation of cell immortality in lung cancer [10] and breast cancer [11], and could be a new independent prognostic marker for breast cancer [12-14], indicating an important role of HJURP in human diseases [15]. Though the correlation between HJURP and bladder cancer has not been investigated yet, our transcriptome data [3,4,16] suggested that HJURP was involved in nucleosome assembly and cell cycle regulation in BCa. Our recent works showed that induction of cell cycle arrest could inhibit proliferation of urological cancer cells [17-19]. Therefore, we hypothesized that the alteration of HJURP expression level might affect cell cycle regulation and viability and thus functions in BCa cells.
Our transcriptome data also indicated that Peroxisome Proliferator-Activated Receptors (PPARs) [16] and Sirtuins [5] were involved in BCa cells. PPARs have been reported to be essential for the regulation of cell differentiation, lipid metabolism and tumourigenesis [20,21]. Activation/deactivation of PPARs could affect genes related to cellular metabolism, proliferation, lipid peroxidation and stress response including reactive oxygen species (ROS) [22]. In addition, manipulating of PPAR activity by either agonist or antagonist has been considered as a potential treatment for metabolic diseases and cancer including BCa [23-25]. The nuclear receptor PPARγ, a key member of the PPAR family and involving in cell cycle regulation [26,27], could bind to the promoter region of SIRT1 to inhibit the transcription [28]. The deacetylase SIRT1 is the most investigated member of the Sirtuin family [29], and its role includes regulating aging [30], apoptosis [31,32], anti-oxidative response [33,34], ROS metabolism [35,36] and linking inflammation and metabolism together [37]. Importantly, SIRT1 could function as key regulator to activate those genes regulating apoptosis and cell survival, such as PPARγ [38], PGC-1α [39], p53 [40,41] as well as FoxO [42]. A recent study suggested the link between PPARγ and SIRT1 and a negative feedback loop of PPARγ-SIRT1 was proposed [28].
Inhibition of SIRT1 was previously reported to reduce cell proliferation, attenuate cell migration and prolong cell cycle progression [43] in human BCa, but the underlying molecular mechanism is still not characterized. Similar to SIRT1, PPARγ was observed overexpressed in bladder cancer [23,44], but the functional role remains unclear. In the present study, we started with identifying the alterations of HJURP and related genes in the BCa tissues and have characterized the effects of HJURP in bladder cancers using several BCa cell lines through the PPARγ-SIRT1 feedback loop.
Materials and Methods
Ethical statement for human bladder tissue samples
As described by Cao et al [3], Chen et al [4] and Qian et al [5] from our group, bladder cancer tissue samples (n = 3) and normal bladder tissue samples (n = 3) were collected from male patients after surgery by radical resection and male donors undergoing transplantation by accidental death at Zhongnan Hospital of Wuhan University, Wuhan, China, respectively. These samples were stored in liquid nitrogen for total RNA isolation and microarray analysis. Bladder cancer tissue samples and paracancerous tissues (n = 20) were obtained from patient suffering bladder cancer, and then either stored in liquid nitrogen for total RNA isolation or fixed in 4% paraformaldehyde (PFA) for immunofluorescence staining analysis. Informed consent was obtained from all subjects. The Ethics Committee at Zhongnan Hospital of Wuhan University approved the experiments using human bladder tissue samples for RNA isolation and immunofluorescence staining analysis (approval number: 2015029). All methods used for human bladder tissue samples were performed in accordance with the approved guidelines and regulations.
Human bladder cancer cell lines
Human bladder cancer cell lines UM-UC-3 (transitional cell carcinoma, Cat. #TCHu217) and T24 (transitional cell carcinoma, Cat. #SCSP-536) were kindly provided by the Stem Cell Bank, Chinese Academy of Sciences in Shanghai, China. The bladder cancer cell line EJ was purchased from the Procell Co. Ltd. (carcinoma, Cat. #CL-0274) in Wuhan, China. Identification of the BCa cell lines was conducted at the China Centre for Type Culture Collection in Wuhan, China. The UM-UC-3 cell was cultured in DMEM (Gibco, China) and T24, EJ cells were cultured in RPMI-1640 medium (Gibco, China) containing 10% fetal bovine serum (FBS) (Gibco, Australia) and 1% penicillin G sodium/streptomycin sulphate in a humidified atmosphere consisting of 95% air and 5% CO2 at 37 ºC.
RNA expression analyses
Total RNA isolation from bladder tissues and BCa cells
Total RNA from bladder cancer cells as well as bladder tissues were isolated with the Qiagen RNeasy Mini Kit (Cat. #74101, Qiagen, Germany), and QIAshredder from Qiagen (Cat. #79654, Qiagen, Germany) using a centrifuge (Cat. #5424, Eppendorf, Germany) according to the manufacturer's protocol. DNase I (RNase-Free DNase Set, Cat. #79254, Qiagen, Germany) was used digest each RNA sample to remove contamination of gDNA. The quantity of isolated RNA was measured by NanoPhotometer (Cat. #N60, Implen, Germany).
Microarray analysis of mRNA isolated from human bladder tissues
A microarray analysis was established using mRNA isolated from the three bladder cancer tissues and the three normal bladder tissues. Briefly, according to the standard Affymetrix protocol, 250 ng total RNA of each sample was prepared to biotinylated cDNA by Ambion® WT Expression Kit. On GeneChip Human Transcriptome Array 2.0, 5.5 µg of cDNA were hybridized for 16 h at 45 ºC, continuously washed and stained in the Affymetrix Fluidics Station 450, scanned by Affymetrix® GeneChip Command Console (AGCC) installed in GeneChip® Scanner 3000 (7G). Data analysis was with a Robust Multichip Analysis (RMA) algorithm using Affymetrix default analysis settings and global scaling as normalization method. Bladder cancer related genes, pathways and functions were analyzed by Gene ontology (GO) and Pathway-Relation-Network (Path-net) analysis tools based on Kyoto Encyclopedia of Genes and Genomes (KEGG) Pathway Database [45,46] (http://www.kegg.jp/kegg/kegg1.html) using the Gene Cloud of Biotechnology Information (GCBI Platform, Shanghai, China). The resulting gene list was subjected to the Database for Annotation, Visualization and Integrated Discovery (DAVID) [47] as well for annotation and overrepresentation analysis of the genes involved in cell cycle pathway (Supplementary Figure S1) and p53 signaling pathway (Supplementary Figure S2). The microarray raw data was submitted to the Gene Expression Omnibus (GEO) database with accession number GSE76211. All data are MIAME compliant.
Reverse transcription and quantitative real time PCR (qRT-PCR)
First-strand cDNA was synthesized by ReverTra Ace qPCR RT Kit (Toyobo, China) using 1 µg of total RNA isolated from bladder tissues or BCa cells. Each reaction of real-time polymerase chain reactions (PCR) was conducted with iQTM SYBR® Green Supermix (Bio-Rad, China) in a final volume of 20 µl using 1 µg of cDNA. All primers were tested for optimal annealing temperatures and PCR conditions were optimized with gradient PCRs on an iCycler (Cat. #CFX Connect, Bio-Rad, USA). Primer sequences and annealing temperatures are summarized in Supplementary Table S1. Values were normalized for amplified GAPDH alleles. Relative gene abundance = 2-ΔΔct, Δct = cttarget gene - ctGAPDH, for BCa cells ΔΔct = ΔctsiRNA-treated - ΔctsiRNA-untreated, for bladder tissues ΔΔct = ΔctBCa patients - Δctparacancerous tissues (ct = threshold cycle).
Cell culture experiments
Knockdown of HJURP and CENP-A in the BCa cells
Three HJURP-target specific small interfering RNA (HJURP-siRNA), three CENP-A-target specific small interfering RNA (CENP-A-siRNA) and one control-siRNA (NC) were synthesized by ViewSolid Ltd. in Beijing, China (sequences listed in Supplementary Table S2 and S3). Distinct BCa cells (T24, EJ and UM-UC-3) were transfected with HJURP-target-specific-siRNA, CENP-A-target-specific- siRNA and control-siRNA using lipoJetTM (SignaGen, China), according to the manufacturer's protocol. After transfection by the three HJURP-target-specific-siRNA (HJURP si-1, si-2 and si-3), the three CEPN-A-target-specific-siRNA (CENP-A si-1, si-2 and si-3) and control-siRNA for 72 h, alterations of HJURP and CENP-A at transcriptional and protein levels were evaluated by qRT-PCR and immunofluorescence staining or Western blot analysis. The HJURP si-2 and CENP-A si-3 were used for the following experiments.
Overexpression of HJURP in the BCa cells
The plasmid of HJURP-overexpression (pWSLV-11-HJURP vector) were synthesized by ViewSolid Ltd. in Beijing, China (sequences listed in Supplementary Sequences S1). The BCa cells (UM-UC-3, EJ and T24) were transfected by the pWSLV-11-HJURP vector to upregulate the expression of HJURP at the transcription level.
Pre-treatment using PPARγ-antagonist and SIRT1-agonist for rescue experiments
Before HJURP-siRNA transfection, BCa cells were pre-treated by PPARγ-antagonist, GW9662 (Cat. #M6191, Sigma-Aldrich, USA) at a final concentration 0, 20 and 40 µM or SIRT1-agonist resveratrol (RSV) (Cat. #R5010, Sigma-Aldrich, USA) at a final concentration 0, 50 and 100 µM, for 12 h. Meanwhile, untreated BCa cells were also pre-incubated with appropriate amount of vehicle (0.1% DMSO). Then BCa cells were transfected by siRNA for another 72 h. Alterations of proliferation, ROS and cell cycle were measured by CCK-8 assay and flow cytometry analysis.
Transwell migration assay
The transwell migration assay was conducted in 24-well plate transwell chamber system (Corning, USA) with 8.0 µm pore size. Distinct BCa cells were suspended in serum-free medium at a density of 40,000 - 60,000 cells per 100 µl and seeded in the upper chamber insert, while the lower chamber was filled with 10% FBS medium. After incubation for 24 h at 37 ºC, cotton swabs were used to remove the cells in the upper insert, and cells that migrated to the lower side were fixed with 4% PFA and stained with crystal violet. Then the chambers were placed under an inverted phase contrast microscope and to observe and count the migrated cells.
CCK-8 assay
After transfection for 24 h, distinct BCa cells were seeded in 96-well plates (3,000-5,000 cells per 200 μl medium) to grow for another 5 days. After adding 20 μl CCK-8 (5 mg/ml) to each well and incubating for 1 h at 37 °C, absorbance at 450 nm was measured by a microplate reader (Cat. #SpectraMax M2, Molecular Devices, USA).
Clonogenic forming experiment
After transfection 24 h, distinct BCa cells were seeded in 6-well plates (1,000-1,500 cells per well) and grew into colonies for approximately 14 days. Then Colonies was fixed with 4% PFA for 30 min, staining with crystal violet, counted and photographed.
Flow cytometry analysis for alterations of cell cycle and apoptosis
For cell cycle analysis, after indicated treatment, cells were harvested and centrifugated, then washed with PBS, pellets were resuspended with 1X DNA Staining Solution containing propidium iodide and permeabilization solution (Multi sciences, China) in the dark. BCa cells were cultured at 37 ºC for 30 min, cell cycle distribution was analyzed by flow cytometry analysis (Cat. #FC500, Beckman, USA). Cell apoptosis analysis was assessed by FITC Annexin V Apoptosis Detection Kit I (BD biosciences, USA) according to the manufacturer's instructions and analyzed by the flow cytometry analysis.
ROS detection by staining with DCFH-DA
Intracellular ROS level of the BCa cells was measured by the fluorescent probe 2',7'-Dichlorofluorescin diacetate (DCFH-DA, Sigma-Aldrich, USA). After indicated treatment, cells were trypsinized and centrifugated, then 10 µmol of DCFH-DA (Sigma, USA) was diluted into 1 ml serum-free medium and cultured at 37 °C for 30 min. Before submitted to flow cytometry analysis, cells were washed three times to remove the uncombined probe. For ROS staining, DCFH-DA and DAPI were added to the slides with the BCa cells and incubated 30 min at the room temperature (RT), then washed three times. Immunofluorescence staining was analyzed using a fluorescence microscope (Cat. #IX73, Olympus, Japan).
TUNEL assay
After 72 h transfection, coverslips with BCa cells were fixed by 4% PFA for 30 min at RT and washed three times by ice-cold PBS, continuously incubated with 0.1% Triton X-100 for 2 min and washed by PBS. Then the TdT-mediated dUTP-biotin nick end labeling test (TUNEL, Roche Applied Science, Germany) was used to detect apoptosis cells according to the manufacturer's instructions. Nuclei were counterstained with 1 µM DAPI for 20 min at RT. Images were taken with fluorescence microscope.
Protein Analyses
Isolation of total protein from BCa cells and Western blot analysis
RIPA buffer containing protease inhibitor and phosphatase inhibitor (Sigma-Aldrich, USA) was used to lyse and sonicate cells on ice for 30 min, then centrifuged at 13,000 g for 15 min to collect supernatant. The concentrations of protein were determined by Bradford protein assay (Bio-Rad, Germany) using Bovine serum albumin (BSA) as standard. Briefly, total protein was separated using 10-12.5% SDS-PAGE and transferred to PVDF membrane (Millipore, USA). Membranes were then blocked in 5% fat-free milk and continuously incubated with primary (Supplementary Table S4) and secondary antibodies (Supplementary Table S5) overnight at 4 °C. Bands were visualized using an enhanced chemiluminescence (ECL) kit (Bio-Rad, USA) and photographed by ChemiDoc XRS+ system (Bio-Rad, USA).
Immunofluorescence staining for human bladder tissue samples
All the bladder tissue samples were collected and histologically diagnosed by two experienced pathologists independently. The samples were fixed by 4% PFA containing 2% sucrose in PBS at 4 ºC overnight and embedded into paraffin (Paraplast, Sigma-Aldrich, USA) using a tissue processor (Cat. #STP 120, Thermo Fisher Scientific, UK). Paraffin sections (4 µm) were cut with a rotation microtome (Cat. #HM325, Thermo Fisher Scientific, Germany). The sections were serially incubated with indicated primary antibody and Cy3-labeled or FITC-labeled secondary antibody in humidified atmosphere (antibodies listed in Supplementary Table S4 and S5). Nuclei were labeled with DAPI (2 μg/ml). Paraffin sections were analyzed by fluorescence microscope.
Immunofluorescence analysis for BCa cells
Coverslips with BCa cells were washed three times with ice cold PBS and fixed with 4% PFA for 30 min. Cells were then treated with 0.1% Triton X-100 solution and blocked in normal goat serum for 30 min at RT. Afterwards, cells were incubated with the indicated primary antibody (Supplementary Table S4) at the proper dilution for 2 h at RT, washed three times with PBS, and incubated with Cy3-labeled or FITC-labeled secondary antibody (Supplementary Table S5) for 1 h. Nuclei were visualized with DAPI (2 μg/ml) for 10 min at RT. Immunofluorescence staining was analyzed by fluorescence microscope.
Figure 1
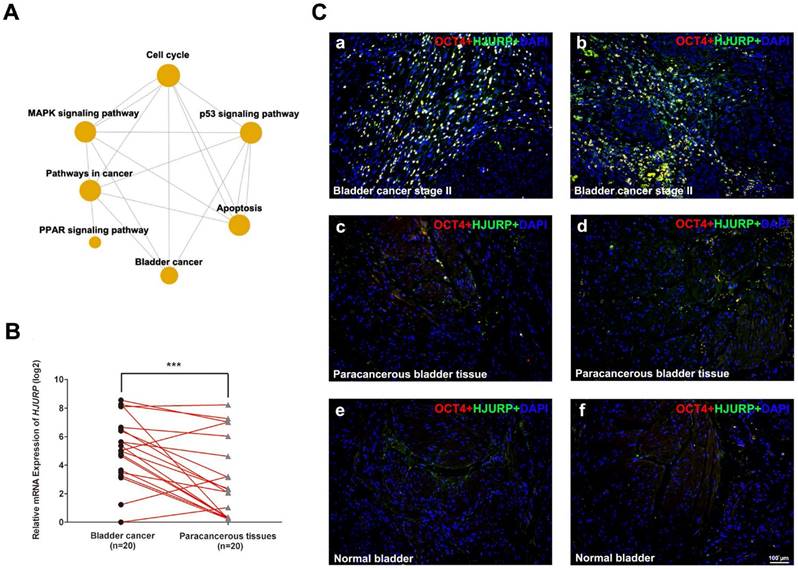
HJURP is strongly upregulated in BCa tissues compared with paracancerous tissues and normal bladder tissues. (A) Gene ontology (GO) and Pathway-Relation-Network (Path-net) analysis based on the GCBI analysis tool suggested that PPAR signaling pathway was correlated with bladder cancer and cell cycle, as well as p53 signaling pathway could be a possible link between bladder cancer and apoptosis. (B) qRT-PCR analysis evaluated the gene expression of HJURP in bladder cancer tissues was significantly higher than the matched paracancerous tissues. The GAPDH value was used as an internal control. *** p<0.001. (C) Representative double immunofluorescence staining of HJURP (green) in bladder cancer tissues (a-b), paracancerous tissues (c-d) and normal bladder tissues (e-f). The staining of OCT4 (red) was used as a marker of BCa cells. Nuclei were stained by DAPI (blue). The scale bar for C is 100 μm.
Statistical analyses
Data were expressed as mean ± SD from three independent experiments. All analyses were performed three times and represent data from three individual experiments. Two-tailed Student's t-tests were used to evaluate the statistical significance of differences of the data. All of the statistical analyses were performed with SPSS 16.0. The statistical significance was set at probability values of p<0.05.
Results
Bioinformatic analysis for BCa related pathways
Previously we performed a microarray analysis comparing BCa tissues with normal bladder tissues [3-5]. Gene ontology (GO) and Pathway-Relation-Network (Path-net) analysis revealed that cell cycle pathway as a key node, similar to Mitogen-Activated Protein Kinases (MAPK) signaling pathway, pathway in cancer and PPAR signaling pathway (Figure 1A). In addition, p53 signaling pathway was suggested as a link between bladder cancer and apoptosis (Figure 1A). The top thirty BCa related GO terms were listed in Supplementary Table S6 (ranked by p-value) and in Supplementary Figure S3 (ranked by enrichment score). These results suggested that GO terms associated with mitotic, nucleosome assembly, cell division and cell proliferation were enriched, suggesting dysregulated cell cycle regulation. Consistently, overrepresentation analysis based on DAVID database revealed that genes involved in cell cycle pathway were significantly affected in the BCa tissues (Supplementary Figure S1).
Upregulation of HJURP in BCa samples compared with paracancerous tissues and normal bladder tissues
Since HJURP is ranked top in the affected genes involving the cell cycle, we further surveyed the Oncomine database (www.oncomine.org). Compared with normal bladder tissues, the mRNA level of HJURP was strongly upregulated in BCa tissues (Supplementary Figure S4), which is consistent with our microarray data (Supplementary Table S3). In order to confirm the results above, we performed qRT-PCR analysis to evaluate the expression of HJURP, indicating significant upregulation in the BCa tissues compared with the paired paracancerous tissues (n = 20, Figure 1B). Double immunofluorescence staining revealed strong signal of HJURP protein in OCT4-positive cells in the BCa tissues (Figure 1C), while the respective paracancerous bladder tissues and normal bladder tissues showed only weak staining of both OCT4 and HJURP protein (Figure 1C).
Inhibited proliferation and viability, rather than motility, in the BCa cells with reduced HJURP
To study the function of HJURP in bladder cancers, we constructed a cell model with reduced HJURP by siRNA-transfection in three BCa cell lines (UM-UC-3, EJ and T24). We transfected the BCa cells with three distinct siRNA specifically targeting HJURP and validated the efficient knockdown by qRT-PCR 72 h later (Figure 2A-C). Moreover, immunofluorescence staining also showed protein abundance of HJURP was strongly downregulated (Figure 2D), together indicating a successful BCa cell model with reduced HJURP. We further evaluated the cell growth ability and CCK-8 assay showed that HJURP-siRNA-treated BCa cells grew significantly slower than the control BCa cells (Figure 2E). Clonogenic survival assay revealed that the ability of colony formation was significantly decreased in the HJURP-siRNA-treated cells comparing with the control group (Figure 2F-G). Moreover, the HJURP-siRNA-treated group exhibited considerably less Ki-67 positive cells than the NC group (Figure 2H). No significant alteration of cell migration rate in the HJURP-siRNA-treated BCa cells was observed by transwell migration assay (Supplementary Figure S5).
Increased cell apoptotic rate in the HJURP-siRNA-treated BCa cells
Since we observed significantly impaired cell growth in HJURP-siRNA-treated BCa cells, we have investigated the apoptotic status of the BCa cells. Flow cytometry analysis revealed that the early apoptotic BCa cells were increased in the HJURP-siRNA-treated BCa cells, comparing with the control group in all three tested cell lines (Figure 3A-B). This result was further confirmed by TUNEL assay (Figure 3D-E). In addition, we observe the slightly alterations of cleaved Caspase 3, 7, 9 in the HJURP-siRNA-treated BCa cells (Figure 3C).
Downregulation of HJURP induced ROS generation in BCa cells, accompanied by interfering the PPARγ-SIRT1 feedback loop
The cells transfected either control-siRNA (NC) or HJURP-target-specific-siRNA (HJURP-siRNA) for 72 h were stained with DCFH-DA and submitted to flow cytometry analysis. The results suggested that BCa cells lacking HJURP exhibited a higher ROS level than the NC group (Figure 4A-B). Consistently, alteration of ROS status was evaluated by ROS staining using fluorescence microscope as well, showing an increased ROS-positive cell rate in the HJURP-siRNA-treated group (Supplementary Figure S6). Moreover, Western blot analysis revealed that proteins (Catalase, Hmox-1, SOD2) associated with ROS metabolism were all considerably upregulated in the HJURP-siRNA-treated group (Figure 4C), which was confirmed by the immunofluorescence analysis as well (Figure 4D). Furthermore, alterations of proteins involved in apoptosis were also evaluated by Western blot, suggesting an upregulation of the apoptosis inducer Bax [48] and downregulation of the pro-survival factor Bcl-xl [49] (Figure 4C). Importantly, both Western blot and immunofluorescence analysis could reveal that knockdown of HJURP could induce PPARγ and inhibit p-SIRT1/t-SIRT1 (Figure 4C-D), which could regulate ROS metabolism, apoptosis, cell cycle. In addition, we observed an increasing of acetylated p53 at protein level (Figure 4C) and especially in the nuclear region (Figure 4D) in the HJURP-siRNA-treated group, which is negatively controlled by SIRT1 deacetylase, linking metabolism and apoptosis together [41].
Downregulation of HJURP-triggered ROS induction and proliferation inhibition could be scavenged by pretreatment of PPARγ-antagonist and SIRT1-agonist
The BCa cells (UM-UC-3 and EJ) were pretreated by GW9662 (PPARγ-antagonist), RSV (SIRT1-agonist) or DMSO (control), then transfected with indicated siRNA. The decrease viability of HJURP KD BCa cells' proliferation could be rescued by GW9662 and RSV (Supplementary Figure S7). Moreover, alteration of ROS level was measured by flow cytometry, showing the increasing of ROS due to reduction of HJURP could be significantly scavenged in the UM-UC-3 and EJ cells (Figure 4E-F). Furthermore, protein expression analysis suggested that Catalase protein was also decreased in the GW9662-pretreated HJURP-deficient BCa cells (Figure 4G).
Figure 2
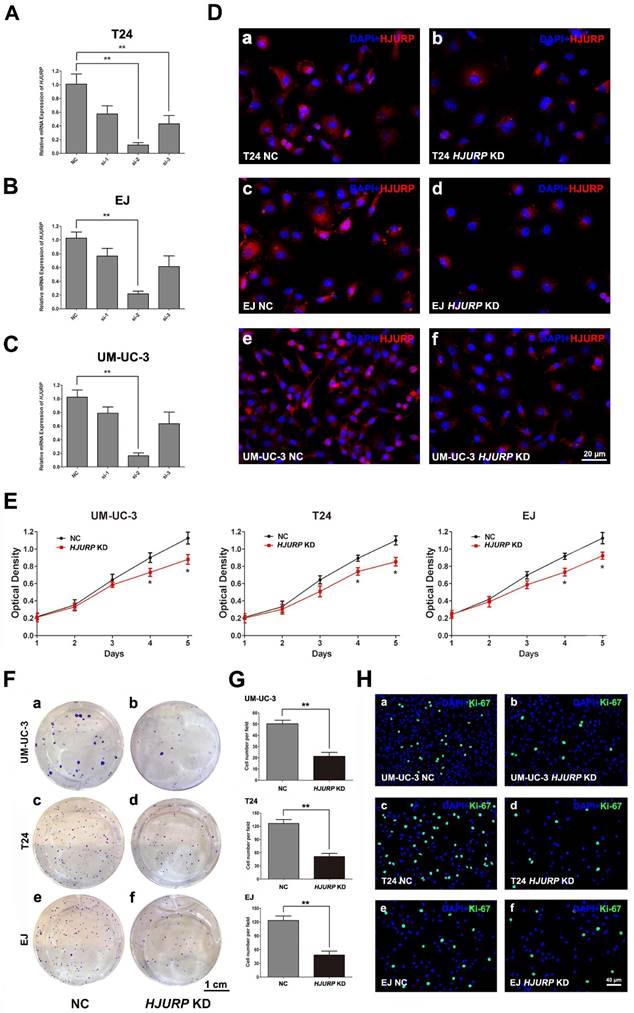
Downregulation of HJURP repressed BCa cell proliferation. (A-C) qRT-PCR validated the efficiency by using distinct siRNA to knockdown HJURP at transcriptional level in three BCa cells (T24, EJ and UM-UC-3). All values shown were mean ± SD of triplicate measurements and repeated three times with similar results, ** p<0.01. (D) Representative immunofluorescence staining of HJURP (red) in the BCa cells after HJURP-target-specific-siRNA treatment (KD) (b, d, f), compared with control-siRNA treatment (NC) (a, c, e). Nuclei were stained by DAPI (blue). (E) CCK-8 assay was used to detect the viability of distinct BCa cells treated by control-siRNA (NC, black line) and HJURP-target-specific-siRNA (HJURP KD, red line). All values shown were mean ± SD of triplicate measurements and repeated three times with similar results, * p<0.05. (F) Cell survival of BCa cells UM-UC-3 (a-b), T24 (c-d), EJ (e-f) were revealed by clonogenic survival assay after treatment of control-siRNA (NC) and HJURP-target-specific-siRNA (HJURP KD), cultured in 6-well plates for approximately 14 days. (G) Clone number in each well was counted and statistically analyzed in the clonogenic survival assay. ** p<0.01. (H) Cell proliferation of BCa cells treated by control-siRNA (a, c, e) and HJURP-target-specific-siRNA (b, d, f) was detected by Ki-67 staining (green). Nuclei were stained by DAPI (blue). The scale bars for D is 20 μm, for F is 1 cm and for G is 40 µm.
Figure 3
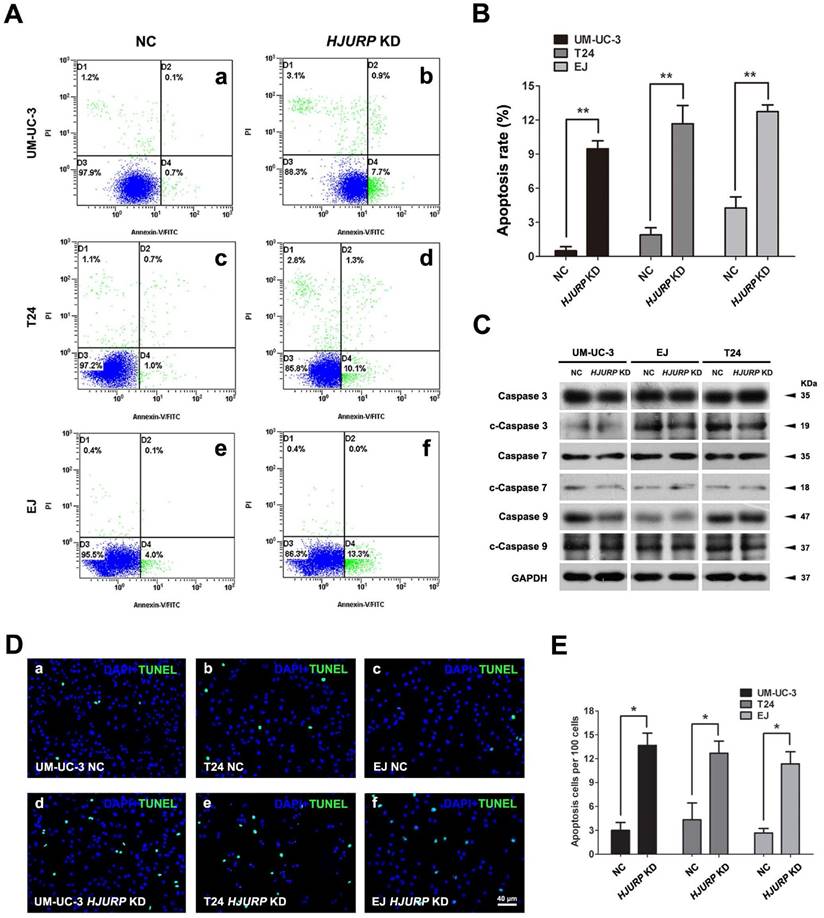
Decreased HJURP induced BCa cell apoptosis. (A) Distinct BCa cells (UM-UC-3, T24, EJ) were transfected with control-siRNA (a, c, e) and HJURP-target-specific-siRNA (b, d, f) for 72h. Detection of cell apoptosis was stained with Annexin V/PI and measured by flow cytometry. (B) Statistical analysis of apoptotic rate (%) in the BCa cell lines after transfection treatment. All values shown were mean ± SD of triplicate measurements and repeated three times with similar results, ** p<0.01. (C) Western blot analysis for pro-Caspase 3/7/9 and cleaved-Caspase 3/7/9 (c-Caspase 3/7/9), suggesting no strong changes of cleaved Caspases in the HJURP-target-specific-siRNA-treated BCa cells compared with the control cells. GAPDH abundance was used as a loading control. Cell types, treatment of siRNA and protein masses were indicated. (D) TUNEL-test to detect apoptosis (green) in control-siRNA-treated BCa cells (a-c) and HJURP-target-specific-siRNA-treated BCa cells (d-f). Nuclei were stained by DAPI (blue). The scale bar for D is 40 µm. (E) Statistical analysis of TUNEL-test revealed a significant increase of apoptotic cell rate in the EJ, T24 and UM-UC-3 cells after HJURP-target-specific-siRNA (HJURP KD) treatment. * p<0.05.
Figure 4
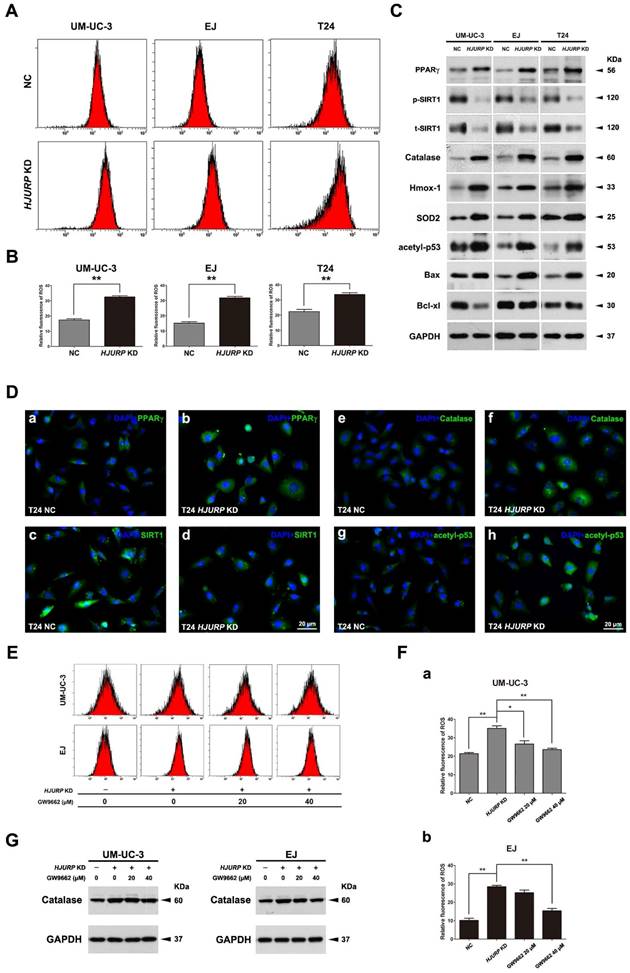
HJURP deficiency induced ROS status in BCa cells accompanied by alterations of PPARγ, phosphorylated/total SIRT1 and acetylated-p53. (A) After transfection by control-siRNA (NC) or HJURP-target-specific-siRNA (HJURP KD), distinct BCa cells were stained with DCFH-DA to detection ROS, measured by flow cytometry. (B) Statistical analysis of relative fluorescence of ROS in the siRNA-transfected BCa cell lines. All values shown were mean ± SD of triplicate measurements and repeated three times with similar results. ** p<0.01. (C) Western blot analysis for proteins involved in ROS and apoptosis: Catalase, Heme oxygenase 1 (Hmox-1), Superoxide dismutase 2 (SOD2), Bax, Bcl-xl, acetylated-p53 (acetyl-p53), PPARγ and phosphorylated/total SIRT1 (p-SIRT1/t-SIRT1). GAPDH abundance was used as a control. Cell types, treatment of siRNA and protein masses were indicated. (D) Respectively immunofluorescence staining of PPARγ (a-b), SIRT1 (c-d), Catalase (e-f) and acetyl-p53 (g-h) in the T24 cells after control-siRNA and HJURP-target-specific-siRNA treatment. Nuclei were stained by DAPI (blue). The scale bar for D is 20 μm. (E) UM-UC-3 and EJ cells were pretreated with GW9662 at 0 μM, 20 μM and 40 μM for 12 h, and continually transfected with control-siRNA and HJURP-target-specific-siRNA for another 72 h. Flow cytometry was used to detect ROS status in distinct BCa cells stained with DCFH-DA. (F) Relative fluorescence of ROS in the GW9662-pretreated UM-UC-3 (a) and EJ (b) cells after siRNA transfection. * p<0.05, ** p<0.01. (G) Western blot analysis for Catalase in the GW9662-pretreated UM-UC-3 and EJ cells after control-siRNA or HJURP-target-specific-siRNA treatment. GAPDH abundance was used as a control. Cell types, treatment of siRNA/GW9662 and protein masses were indicated.
Figure 5
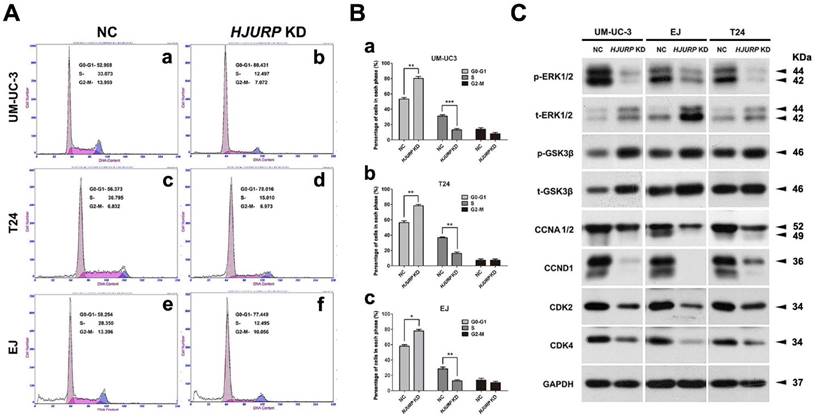
Knockdown of HJURP induced cell cycle arrest at G0/G1 phase in BCa cells. (A) Flow cytometry analysis for UM-UC-3 (a-b), T24 (c-d) and EJ cells (e-f) treated with control-siRNA (a, c, e) and HJURP-target-specific-siRNA (b, d, f) for 72 h. (B) Alteration of percentages (%) of cell populations at different stages of cell cycles in UM-UC-3 (a), T24 (b) and EJ cells (c) was statistically analyzed. All values shown were mean ± SD of triplicate measurements and repeated three times with similar results. * p<0.05, ** p<0.01, *** p<0.001. (C) Western blot analysis of proteins involved in the G0/G1 cell cycle regulation (CCNA1/2, CCND1, CDK2/4) as well as phosphorylated/total ERK1/2 and phosphorylated/total GSK-3β in the BCa cells. GAPDH abundance was used as a control. Cell types, treatment of siRNA and protein masses were indicated.
Induction of cell cycle arrest at G0/G1 phase in the HJURP-siRNA-treated BCa cells
Flow cytometry analysis was used to evaluate the alteration of cell cycle in HJURP-siRNA-treated BCa cells, compared with the NC group (Figure 5A). The results suggested a significant increase of cell population at G0/G1 phase and a significant reduction of cell population at S phase in the HJURP-siRNA-treated group (Figure 5B). In addition, we also analyzed the proteins involved in the G0/G1 phase regulation by Western blot, suggesting strong decrease of Cyclin A1/2 (CCNA1/2), Cyclin D1 (CCND1) and CDK2/4 in the HJURP-siRNA-treated group (Figure 5C). Furthermore, phosphorylated/total GSK-3β, an upstream indicator of cell cycle pathway [50], were considerably upregulated in the HJURP-siRNA-treated BCa cells. Moreover, ERK1/2, a key member in the MAPK family, was also affected in the HJURP-siRNA-treated BCa cells (Figure 5C), indicating ERK1/2 was strongly deactivated. In contrast, Western blot analysis showed that JNK/p38 pathway was not significantly activated (Supplementary Figure S8).
Rescued cell cycle arrest due to reduced HJURP upon PPARγ antagonist treatment in BCa cells
To investigate the role of PPARγ-SIRT1 feedback loop in the cell cycle arrest induced by HJURP-siRNA treatment, PPARγ-antagonist (GW9662) was used to deactivate function of PPARγ protein. After pretreatment with GW9662 at distinct concentration for 12 h, BCa cells (UM-UC-3 and EJ) were then transfected by siRNA for another 72 h. Flow cytometry analysis showed deactivation of PPARγ could recover the cell cycle arrest at G0/G1 phase triggered by HJURP deficiency (Figure 6A-B), as demonstrated by upregulation of CCNA1/2, CCND1 and CDK2/4 in HJURP-siRNA-treated group evaluated by Western blot (Figure 6C). We also observed that treatment of GW9662 could not suppress PPARγ at protein level, but indeed induce both p-SIRT1 and t-SIRT1 (Figure 6C).
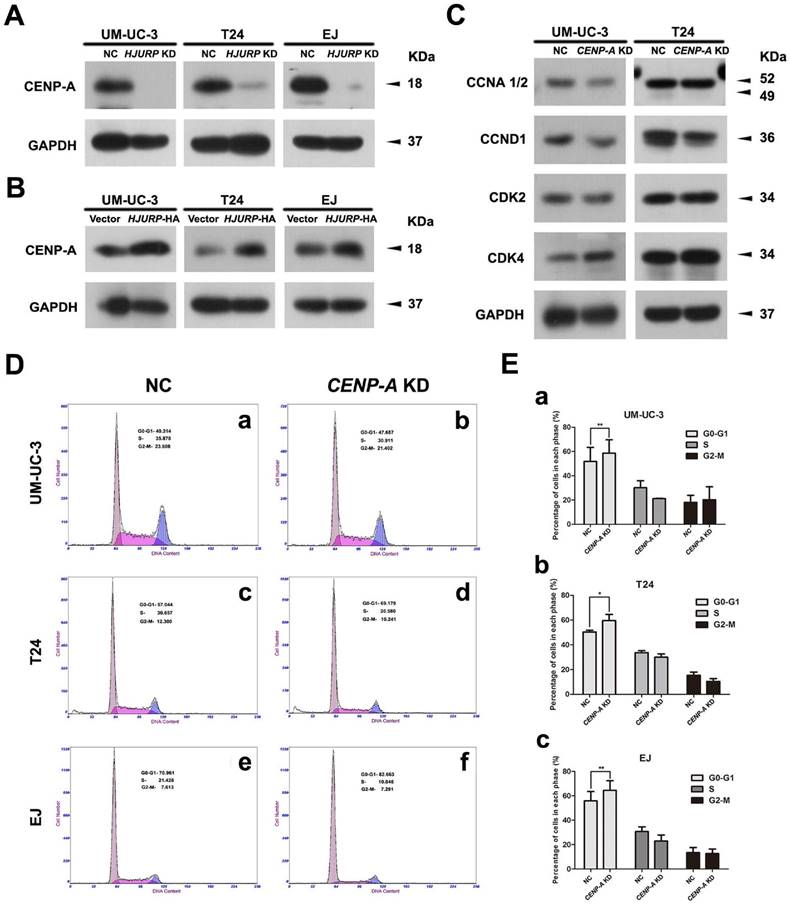
Positive correlation between CENP-A and HJURP in the BCa cells
To investigate the correlation of CENP-A and HJURP in the BCa cells, we analyzed the alteration of CENP-A protein abundance in the HJURP-siRNA-treated and HJURP-overexpressed BCa cells (UM-UC-3, T24 and EJ). Western blot analysis revealed a strong decrease of CENP-A in the BCa cells with reduced HJURP (Figure 7A), whereas an increasing protein level of CENP-A in the HJURP-overexpressing cells (Figure 7B), suggesting a positive correlation between CENP-A and HJURP. Moreover, the BCa cells with reduced CENP-A showed a similar cell cycle arrest at G0/G1 phase (Figure 7D-E) as the HJURP-siRNA-treated cells (Figure 5A-B), as well as a similar reduction of the proteins (CCND1, CDK2) involved in cell cycle regulation (Figure 7C).
Figure 6
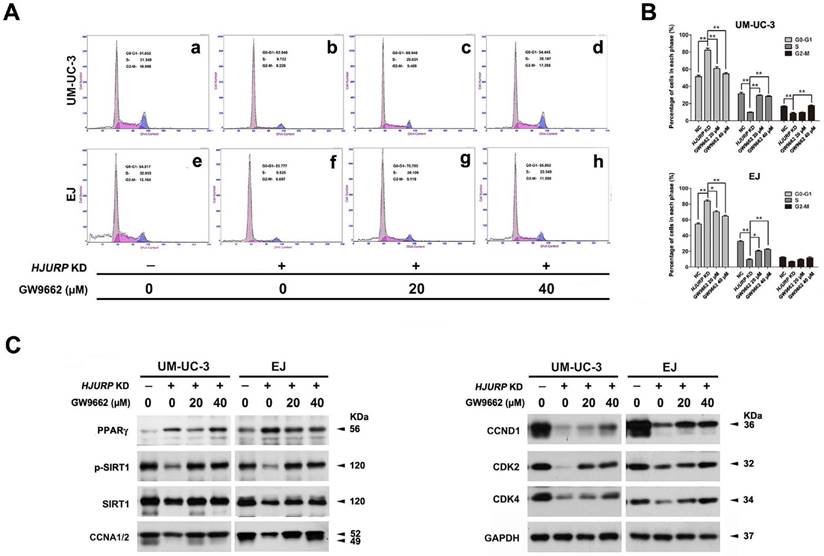
Recovery of HJURP deficiency-induced cell cycle arrest at G0/G1 phase by PPARγ-antagonist GW9662 in BCa cells. (A) UM-UC-3 (a-d) and EJ (e-h) cells were pretreated with GW9662 at 0 μM (a-b, e-f), 20 μM (c, g), 40 μM (d, h) for 12 h, and continually transfected by control-siRNA (a, e) and HJURP-target-specific-siRNA (b-d, f-h) for another 72 h. The alteration of percentages (%) of cell populations at different stages of cell cycles were measured by flow cytometry. (B) Statistically analysis of recovered cell cycle arrest at G0/G1 phase by GW9662. All values shown were mean ± SD of triplicate measurements and repeated three times with similar results, * p<0.05, ** p<0.01. (C) Western blot analysis of protein abundance of CDK2/4, CCNA1/2, CCND1, PPARγ and phosphorylated/total SIRT1 using total protein isolated from cell lysates. GAPDH was used as a loading control. Cell types, treatment of siRNA/GW9662 and protein masses were indicated.
Discussion
Our group has comprehensively analyzed the transcriptome data of bladder cancer tissues versus normal bladder tissues [3-5]. Among hundreds of strongly altered genes involving in development of human bladder cancer (BCa), we observed an interesting gene named HJURP. In consist with our results (Figure 1B), Oncomine database points out the transcription level of HJURP was significantly upregulated in the human bladder cancer tissues as well (Supplementary Figure S4). HJURP has been reported to be involved in nucleosome assembly and a key chaperone of CENP-A, which is positively correlated with HJURP in human bladder cancer cells as well (Figure 7A-B), ensuring its safe delivery, incorporation, and maintenance at centromeres in a cell cycle dependent way [51]. Recent studies revealed that HJURP was correlated with lung cancer [10] and breast cancer [11]. Here we focused on the functional role of HJURP in BCa. First we confirmed the overexpression of HJURP in BCa tissues at both transcriptional and protein levels (Figure 1B-C). Immunofluorescence co-staining in BCa tissues indicated a co-localization of HJURP and a potential bladder cancer cell marker OCT4 [52]. Then using the HJURP-siRNA-treated cells, we observed that reduced HJURP resulted in an inhibitory effect on cell growth, colony formation ability and Ki-67 positive cells (Figure 2), whereas migration rate remained unaffected (Supplementary Figure S5).
More interestingly, we observed that HJURP-siRNA-treated BCa cells exhibited a significantly higher apoptotic rate than the control group, with slightly upregulation of distinct cleaved Caspases (Figure 3), which plays normally a central role in the execution of apoptosis [53]. Interestingly, Western blot analysis revealed a remarkably increasing of Bax, an inducer of apoptosis [48], and strongly decreasing of Bcl-xl, an pro-survival factor [49] (Figure 4C).
Figure 7
CENP-A may be involved in the HJURP-reduction induced cell cycle arrest. (A) Western blot analysis of CENP-A protein in the HJURP-control-siRNA (NC) and HJURP-target-specific-siRNA (HJURP KD) treated BCa cells (UM-UC-3, T24 and EJ). (B) Western blot analysis of CENP-A protein in the control (Vector) and pWSLV-11-HJURP plasmid (HJURP-HA) transfected BCa cells (UM-UC-3, T24 and EJ). (C) Western blot analysis for the proteins involved in cell cycle regulation (CCNA 1/2, CCND1, CDK2, CDK4) in the CENP-A-control-siRNA (NC) and CENP-A-target-specific-siRNA (CENP-A KD) treated BCa cells (UM-UC-3, T24 and EJ). GAPDH was used as a loading control. Cell types and protein masses were indicated. (D) Flow cytometry analysis of alteration of percentages (%) of cell populations at different stages of cell cycles in the CENP-A-control-siRNA (NC) and CENP-A-target-specific-siRNA (CENP-A KD) treated BCa cells (UM-UC-3, T24 and EJ). (E) Changes of percentages (%) of cell populations at different stages of cell cycles in UM-UC-3 (a), T24 (b) and EJ cells (c) was statistically analyzed. All values shown were mean ± SD of triplicate measurements and repeated three times with similar results. * p<0.05, ** p<0.01.
In addition, inhibition of apoptosis by Bcl-2 and Bcl-xl has been reported to be associated with protection against ROS and/or a shift of the cellular redox potential to a more reduced state [54]. To further clarify the mechanism for the apoptosis induced by downregulation of HJURP, we found a strongly increased ROS-positive cells and proteins involved in ROS metabolism (Figure 4), which could be regulated by the PPARγ-SIRT1 feedback loop and could link oxidative stress and apoptosis together [22,31,36]. These results suggested that the homeostasis of ROS metabolism was disrupted by downregulation of HJURP in the BCa cells, and therefore could lead to irreversible oxidative modifications of lipid, protein, or DNA, resulting in oxidative stress-induced apoptosis [55]. Taken together, our results suggested that the increased apoptosis rate of BCa cells triggered by HJURP reduction might be via ROS-related pathway and oxidative stress.
Another interesting phenomenon we observed was that in the HJURP-siRNA-treated BCa cells, protein level of PPARγ was strongly upregulated, whereas the ratio of p-SIRT1/t-SIRT1 were considerably downregulated, as well as its substrate acetylated p53 was increased (Figure 4). Since PPARγ-SIRT1 feedback loop could play a key role in the regulation of antioxidant response, apoptosis and cell cycle [26,28,31,33], thus we treated the BCa cells with PPARγ-antagonist GW9662 to deactivate PPARγ protein [25] and RSV to activate SIRT1 [56]. With the treatment of GW9662 and RSV, we noticed a significantly recovery of proliferation inhibition as well as scavenge of ROS status in HJURP-siRNA-treated BCa cells and a recovery of induced Catalase (Figure 4), one of the most important antioxidant enzymes for degradation of hydrogen peroxide [34].
Moreover, overrepresentation analysis based on microarray raw data and DAVID suggested that the genes involved in p53 signaling pathway were affected in bladder cancer, linked with cell cycle arrest at G1 and G2 phase (Supplementary Figure S2). Consistently, we also observed a significantly induced cell cycle arrest at G0/G1 phase, followed by downregulation of protein involved in G0/G1 to S phase progression (CCNA1/2, CCND1 and CDK2/4), and upregulation of their upstream proteins p-GSK-3β/t-GSK3β (Figure 5). Western blot analysis also exhibited a strongly downregulation of p-ERK1/2 and CCND1 after depleting HJURP (Figure 5), as reported by Meloche et al that activation of ERK1/2 is necessary for G1 to S phase progression by targeting CCND1 [57]. In contrast, no significant alterations of ROS status (Supplementary Figure S9A-B), cell cycle (Supplementary Figure S9C-D) and apoptosis (Supplementary Figure S10) in the HJURP-overexpressed BCa cells were observed. However, a similar cell cycle arrest was noticed in the CENP-A-siRNA-treated BCa cells (Figure 7D-E), suggesting that the effect of HJURP on cell cycle regulation could be through CENP-A. Moreover, our results revealed no significant alterations of ROS production (Supplementary Figure S11) and apoptotic rate (Supplementary Figure S12), indicating a major effect of CENP-A on cell cycle regulation of BCa cells.
Since our transcriptome analysis suggested a link between cell cycle and PPAR signaling pathway in bladder cancer, we therefore pretreated HJURP-siRNA-treated BCa cells with GW9662 as well, noticing that the PPARγ was not affected at protein level, but a rescued effect on p-SIRT1/t-SIRT1 protein abundance (Figure 6), suggesting the PPARγ-SIRT1 feedback loop was interfered. Importantly, deactivation of PPARγ by GW9662 displayed a recovery of cell cycle arrest and upregulation of protein involved in the G0/G1 phase (CCNA1/2, CCND1 and CDK2/4) in the HJURP-siRNA-treated BCa cells (Figure 6). These results showed that HJURP deficiency might trigger cell cycle arrest at G0/G1 phase via PPARγ-SIRT1 feedback loop in BCa cells. However, further studies are needed to clarify the direct regulatory link between HJURP and PPARγ-SIRT1 feedback loop in tumorigenesis of bladder cancer.
In conclusion, our study suggests that HJURP could regulate ROS metabolism and cell cycle via PPARγ-SIRT1 feedback loop and thus contribute to the progression of bladder cancer (Supplementary Figure S13).
Supplementary Material
Supplementary figures and tables.
Acknowledgements
The excellent technical assistance of Yuan Zhu, Shanshan Zhang and Danni Shan is gratefully acknowledged. We would like to acknowledge Dr. Adam J. Hsu at Mayo Clinic, Rochester, MN, USA, for critical reading this manuscript. We also would like to acknowledge the KEGG database developed by Kanehisa Laboratories for the original source of KEGG pathway images “Cell cycle pathway (map04110)” and “p53 signaling pathway (map04115)”. The authors disclose no writing assistance. This work was supported by the Research Fund for the Doctoral Program of Higher Education of China [grant number 20130141110038] and the Fundamental Research Funds for the Central Universities [grant numbers 2042015kf0153, 2042016kf0098]. The funders had no role in study design, data collection and analysis, decision to publish, or preparation of the manuscript.
Competing Interests
The authors declare no competing interests.
References
1. Burger M, Catto JW, Dalbagni G. et al. Epidemiology and risk factors of urothelial bladder cancer. Eur Urol. 2013;63:234-241
2. Babjuk M, Oosterlinck W, Sylvester R. et al. EAU guidelines on non-muscle-invasive urothelial carcinoma of the bladder, the 2011 update. Eur Urol. 2011;59:997-1008
3. Cao R, Meng Z, Liu T. et al. Decreased TRPM7 inhibits activities and induces apoptosis of bladder cancer cells via ERK1/2 pathway. Oncotarget. 2016;7:72941-72960
4. Chen L, Wang G, Luo Y. et al. Downregulation of LAPTM5 suppresses cell proliferation and viability inducing cell cycle arrest at G0/G1 phase of bladder cancer cells. Int J Oncol. 2017;50:263-271
5. Qian K, Wang G, Cao R. et al. Capsaicin suppresses cell proliferation, induces cell cycle arrest and ROS production in bladder cancer cells through FOXO3a-mediated pathways. Molecules. 2016;21:1406
6. Liu C, Mao Y. Diaphanous formin mDia2 regulates CENP-A levels at centromeres. J Cell Biol. 2016;213:415-424
7. Tachiwana H, Muller S, Blumer J. et al. HJURP involvement in de novo CenH3(CENP-A) and CENP-C recruitment. Cell Rep. 2015;11:22-32
8. Perpelescu M, Hori T, Toyoda A. et al. HJURP is involved in the expansion of centromeric chromatin. Mol Biol Cell. 2015;26:2742-2754
9. Zhao H, Winogradoff D, Bui M. et al. Promiscuous histone mis-assembly is actively prevented by chaperones. J Am Chem Soc. 2016;138:13207-13218
10. Kato T, Sato N, Hayama S. et al. Activation of Holliday junction recognizing protein involved in the chromosomal stability and immortality of cancer cells. Cancer Res. 2007;67:8544-8553
11. Montes de Oca R, Gurard-Levin ZA, Berger F. et al. The histone chaperone HJURP is a new independent prognostic marker for luminal A breast carcinoma. Mol Oncol. 2015;9:657-674
12. Bravaccini S, Tumedei MM, Scarpi E. et al. New biomarkers to predict the evolution of in situ breast cancers. Biomed Res Int. 2014;2014:159765
13. Coates P, Dewar J, Thompson AM. At last, a predictive and prognostic marker for radiotherapy? Breast Cancer Res. 2010;12:106
14. Hu Z, Huang G, Sadanandam A. et al. The expression level of HJURP has an independent prognostic impact and predicts the sensitivity to radiotherapy in breast cancer. Breast Cancer Res. 2010;12:R18
15. Burgess RJ, Zhang Z. Histone chaperones in nucleosome assembly and human disease. Nat Struct Mol Biol. 2013;20:14-22
16. Wang G, Cao R, Wang Y. et al. Simvastatin induces cell cycle arrest and inhibits proliferation of bladder cancer cells via PPARgamma signalling pathway. Sci Rep. 2016;6:35783
17. Wang Y, Wang X, Yang Z. et al. Menthol inhibits the proliferation and motility of prostate cancer DU145 cells. Pathol Oncol Res. 2012;18:903-910
18. Liu T, Fang Z, Wang G. et al. Anti-tumor activity of the TRPM8 inhibitor BCTC in prostate cancer DU145 cells. Oncol Lett. 2016;11:182-188
19. Chen D, Yang Z, Wang Y. et al. Capsaicin induces cycle arrest by inhibiting cyclin-dependent-kinase in bladder carcinoma cells. Int J Urol. 2012;19:662-668
20. Belfiore A, Genua M, Malaguarnera R. PPAR-gamma agonists and their effects on IGF-I receptor signaling: Implications for cancer. PPAR Res. 2009;2009:830501
21. Berger J, Moller DE. The mechanisms of action of PPARs. Annu Rev Med. 2002;53:409-435
22. Vecchione G, Grasselli E, Voci A. et al. Silybin counteracts lipid excess and oxidative stress in cultured steatotic hepatic cells. World J Gastroenterol. 2016;22:6016-6026
23. Langle Y, Lodillinsky C, Belgorosky D. et al. Role of peroxisome proliferator activated receptor-gamma in bacillus Calmette-Guerin bladder cancer therapy. J Urol. 2012;188:2384-2390
24. Moon CM, Kwon JH, Kim JS. et al. Nonsteroidal anti-inflammatory drugs suppress cancer stem cells via inhibiting PTGS2 (cyclooxygenase 2) and NOTCH/HES1 and activating PPARG in colorectal cancer. Int J Cancer. 2014;134:519-529
25. Qian G, Fan W, Ahlemeyer B. et al. Peroxisomes in Different Skeletal Cell Types during Intramembranous and Endochondral Ossification and Their Regulation during Osteoblast Differentiation by Distinct Peroxisome Proliferator-Activated Receptors. PLoS One. 2015;10:e0143439
26. Li S, Zhou Q, He H. et al. Peroxisome proliferator-activated receptor gamma agonists induce cell cycle arrest through transcriptional regulation of Kruppel-like factor 4 (KLF4). J Biol Chem. 2013;288:4076-4084
27. Yamamoto Y, Ono T, Dhar DK. et al. Role of peroxisome proliferator-activated receptor-gamma (PPARgamma) during liver regeneration in rats. J Gastroenterol Hepatol. 2008;23:930-937
28. Han L, Zhou R, Niu J. et al. SIRT1 is regulated by a PPAR{gamma}-SIRT1 negative feedback loop associated with senescence. Nucleic Acids Res. 2010;38:7458-7471
29. Haigis MC, Sinclair DA. Mammalian sirtuins: biological insights and disease relevance. Annu Rev Pathol. 2010;5:253-295
30. Yuan Y, Cruzat VF, Newsholme P. et al. Regulation of SIRT1 in aging: Roles in mitochondrial function and biogenesis. Mech Ageing Dev. 2016;155:10-21
31. Liu J, Zhou J, Wu Z. et al. Cyanidin 3-O-beta-glucoside ameliorates ethanol-induced acute liver injury by attenuating oxidative stress and apoptosis: the role of SIRT1/FOXO1 signaling. Alcohol Clin Exp Res. 2016;40:457-466
32. Xiong F, Hu L, Zhang Y. et al. MiR-22 inhibits mouse ovarian granulosa cell apoptosis by targeting SIRT1. Biol Open. 2016;5:367-371
33. Wang Y, Liang X, Chen Y. et al. Screening SIRT1 activators from medicinal plants as bioactive compounds against oxidative damage in mitochondrial function. Oxid Med Cell Longev. 2016;2016:4206392
34. Xiao Y, Karnati S, Qian G. et al. Cre-mediated stress affects sirtuin expression levels, peroxisome biogenesis and metabolism, antioxidant and proinflammatory signaling pathways. PLoS One. 2012;7:e41097
35. Lin CL, Huang WN, Li HH. et al. Hydrogen-rich water attenuates amyloid beta-induced cytotoxicity through upregulation of Sirt1-FoxO3a by stimulation of AMP-activated protein kinase in SK-N-MC cells. Chem Biol Interact. 2015;240:12-21
36. Ruan Y, Dong C, Patel J. et al. SIRT1 suppresses doxorubicin-induced cardiotoxicity by regulating the oxidative stress and p38MAPK pathways. Cell Physiol Biochem. 2015;35:1116-1124
37. Vachharajani VT, Liu T, Wang X. et al. Sirtuins Link Inflammation and Metabolism. J Immunol Res. 2016;2016:8167273
38. Picard F, Kurtev M, Chung N. et al. Sirt1 promotes fat mobilization in white adipocytes by repressing PPAR-gamma. Nature. 2004;429:771-776
39. Rodgers JT, Lerin C, Haas W. et al. Nutrient control of glucose homeostasis through a complex of PGC-1alpha and SIRT1. Nature. 2005;434:113-118
40. Vaziri H, Dessain SK, Ng Eaton E. et al. hSIR2(SIRT1) functions as an NAD-dependent p53 deacetylase. Cell. 2001;107:149-159
41. Luo J, Nikolaev AY, Imai S. et al. Negative control of p53 by Sir2alpha promotes cell survival under stress. Cell. 2001;107:137-148
42. Motta MC, Divecha N, Lemieux M. et al. Mammalian SIRT1 represses forkhead transcription factors. Cell. 2004;116:551-563
43. Lin MH, Lee YH, Cheng HL. et al. Capsaicin inhibits multiple bladder cancer cell phenotypes by inhibiting tumor-associated NADH oxidase (tNOX) and Sirtuin1 (SIRT1). Molecules. 2016;21:849
44. Conconi D, Panzeri E, Redaelli S. et al. DNA copy number alterations and PPARG amplification in a patient with multifocal bladder urothelial carcinoma. BMC Res Notes. 2012;5:607
45. Kanehisa M, Sato Y, Kawashima M. et al. KEGG as a reference resource for gene and protein annotation. Nucleic Acids Res. 2016;44:D457-462
46. Kanehisa M, Goto S. KEGG: kyoto encyclopedia of genes and genomes. Nucleic Acids Res. 2000;28:27-30
47. Dennis G Jr, Sherman BT, Hosack DA. et al. DAVID: Database for Annotation, Visualization, and Integrated Discovery. Genome Biol. 2003;4:P3
48. Mignard V, Lalier L, Paris F. et al. Bioactive lipids and the control of Bax pro-apoptotic activity. Cell Death Dis. 2014;5:e1266
49. Ottani A, Galantucci M, Ardimento E. et al. Modulation of the JAK/ERK/STAT signaling in melanocortin-induced inhibition of local and systemic responses to myocardial ischemia/reperfusion. Pharmacol Res. 2013;72:1-8
50. Ye Y, Chao XJ, Wu JF. et al. ERK/GSK3beta signaling is involved in atractylenolide I-induced apoptosis and cell cycle arrest in melanoma cells. Oncol Rep. 2015;34:1543-1548
51. Dunleavy EM, Roche D, Tagami H. et al. HJURP is a cell-cycle-dependent maintenance and deposition factor of CENP-A at centromeres. Cell. 2009;137:485-497
52. Hatefi N, Nouraee N, Parvin M. et al. Evaluating the expression of oct4 as a prognostic tumor marker in bladder cancer. Iran J Basic Med Sci. 2012;15:1154-1161
53. Budihardjo I, Oliver H, Lutter M. et al. Biochemical pathways of caspase activation during apoptosis. Annu Rev Cell Dev Biol. 1999;15:269-290
54. Fleury C, Mignotte B, Vayssiere JL. Mitochondrial reactive oxygen species in cell death signaling. Biochimie. 2002;84:131-141
55. Circu ML, Aw TY. Reactive oxygen species, cellular redox systems, and apoptosis. Free Radic Biol Med. 2010;48:749-762
56. Denu JM. Fortifying the link between SIRT1, resveratrol, and mitochondrial function. Cell Metab. 2012;15:566-567
57. Meloche S, Pouyssegur J. The ERK1/2 mitogen-activated protein kinase pathway as a master regulator of the G1- to S-phase transition. Oncogene. 2007;26:3227-3239
Author contact
![]() Corresponding author: Dr. Xinghuan Wang, Email: wangxinghuanedu.cn, Tel. +86-27-6781-3104, Fax: +86-27-6781-2892; and Dr. Yu Xiao, Email: yu.xiaoedu.cn, Tel. +86-27-6781-2689, Fax: +86-27-6781-2892.
Corresponding author: Dr. Xinghuan Wang, Email: wangxinghuanedu.cn, Tel. +86-27-6781-3104, Fax: +86-27-6781-2892; and Dr. Yu Xiao, Email: yu.xiaoedu.cn, Tel. +86-27-6781-2689, Fax: +86-27-6781-2892.
Citation styles
APA
Cao, R., Wang, G., Qian, K., Chen, L., Qian, G., Xie, C., Dan, H.C., Jiang, W., Wu, M., Wu, C.L., Xiao, Y., Wang, X. (2017). Silencing of HJURP induces dysregulation of cell cycle and ROS metabolism in bladder cancer cells via PPARγ-SIRT1 feedback loop. Journal of Cancer, 8(12), 2282-2295. https://doi.org/10.7150/jca.19967.
ACS
Cao, R.; Wang, G.; Qian, K.; Chen, L.; Qian, G.; Xie, C.; Dan, H.C.; Jiang, W.; Wu, M.; Wu, C.L.; Xiao, Y.; Wang, X. Silencing of HJURP induces dysregulation of cell cycle and ROS metabolism in bladder cancer cells via PPARγ-SIRT1 feedback loop. J. Cancer 2017, 8 (12), 2282-2295. DOI: 10.7150/jca.19967.
NLM
Cao R, Wang G, Qian K, Chen L, Qian G, Xie C, Dan HC, Jiang W, Wu M, Wu CL, Xiao Y, Wang X. Silencing of HJURP induces dysregulation of cell cycle and ROS metabolism in bladder cancer cells via PPARγ-SIRT1 feedback loop. J Cancer 2017; 8(12):2282-2295. doi:10.7150/jca.19967. https://www.jcancer.org/v08p2282.htm
CSE
Cao R, Wang G, Qian K, Chen L, Qian G, Xie C, Dan HC, Jiang W, Wu M, Wu CL, Xiao Y, Wang X. 2017. Silencing of HJURP induces dysregulation of cell cycle and ROS metabolism in bladder cancer cells via PPARγ-SIRT1 feedback loop. J Cancer. 8(12):2282-2295.
This is an open access article distributed under the terms of the Creative Commons Attribution (CC BY-NC) license (https://creativecommons.org/licenses/by-nc/4.0/). See http://ivyspring.com/terms for full terms and conditions.