Journal of Cancer
ISSN: 1837-9664
3.2
Impact Factor
ISSN: 1837-9664

 Global reach, higher impact
J Cancer 2017; 8(12):2303-2311. doi:10.7150/jca.19036 This issue Cite
Research Paper
Identification of Transcription Factor YY1 as a Regulator of a Prostate Cancer-Specific Pathway Using Proteomic Analysis
Arum Park1*, Jiyeong Lee2*, Sora Mun1, Doo Jin Kim2, Byung Heun Cha2, Kyong Tae Moon3, Tag Keun Yoo3 ![]() , Hee-Gyoo Kang1,2
, Hee-Gyoo Kang1,2 ![]()
1. Department of Senior Healthcare, BK21 Plus Program, Graduate School, Eulji University, Seongnam 13135, Korea;
2. Department of Biomedical Laboratory Science, College of Health Sciences, Eulji University, Seongnam 13135, Korea;
3. Department of Urology, College of Medicine, Eulji University, Daejeon 33824, Korea.
*These authors contributed equally.
Received 2017-1-3; Accepted 2017-5-18; Published 2017-7-20
Citation:
Park A, Lee J, Mun S, Kim DJ, Cha BH, Moon KT, Yoo TK, Kang HG. Identification of Transcription Factor YY1 as a Regulator of a Prostate Cancer-Specific Pathway Using Proteomic Analysis. J Cancer 2017; 8(12):2303-2311. doi:10.7150/jca.19036. https://www.jcancer.org/v08p2303.htm
Other stylesAbstract
Prostate-specific antigen, a biomarker used to diagnose prostate cancer, exhibits poor sensitivity. Although previous studies have focused on identifying a new diagnostic biomarker, the molecules or networks identified in these studies are also present in other cancers, making it difficult to detect prostate cancer specifically. A unique characteristic of the prostate gland is the increased mitochondrial energy metabolism when normal prostate cells progress to cancer cells. Thus, we attempted to find a prostate cancer-specific signature present in this unique environment. Proteins that were differentially expressed between a prostate cell line and three prostate cancer cell lines were identified using proteomic analysis. Not surprisingly, the most prevalent proteins detected by network analysis of proteins that were up-regulated at least 1.2-fold in cancer cells, compared to that in normal prostate cells, were those involved in mitochondrial energy metabolism. In addition, we showed that Yin Yang 1 (YY1) was a major transcription factor involved in regulating energy metabolism. To determine whether YY1 regulates genes associated with mitochondrial energy metabolism in prostate cells, cells were subjected to quantitative polymerase chain reaction analysis in the presence or absence of the YY1 inhibitor NP-001. Notably, inhibition of YY1 resulted in reduced expression of genes related to the Krebs cycle and electron transport chain in prostate cancer cell lines. Based on this finding, we suggest that there is a tumor-specific signature that regulates mitochondrial energy metabolism in prostate cancer cells. This work provides a foundation for further work on identifying a means for the specific diagnosis of prostate cancer.
Keywords: prostate cancer, energy metabolism, mitochondria, YY1
Introduction
In recent years, several proteomics studies have focused on identifying novel diagnostic biomarkers in patients with prostate cancer [1-5]. Most of these previous reports have found novel biomarkers by identifying networks associated with the prostate-specific antigen, the most commonly used marker in prostate cancer [6-8], or pathways associated with differentially expressed proteins [9-11]. However, the diagnostic markers or networks revealed through these studies have a limited ability to detect prostate cancer because they are also overexpressed in other cancers [12-17]. Therefore, it is necessary to find a signature that is specific to the prostate cancer environment.
Unlike other soft tissues, the prostate gland has a unique energy metabolism system, producing 14 ATP molecules per glucose under normal conditions. This phenomenon is dependent on mitochondrial aconitase (m-aconitase), an enzyme that converts citrate to isocitrate in the Krebs cycle. In normal prostate tissue, m-aconitase activity is inhibited resulting in a decrease in total energy production. In contrast, when normal prostate tissue becomes cancerous, m-aconitase activity is increased and the cells produce 36 ATP per glucose, in common with normal tissues [18-21]. Therefore, it may be possible to identify a specific signature in prostate cancer cells involving alterations in prostate energy metabolism.
To search for a tumor-specific signature of energy metabolism in prostate cancer, we conducted a comparative proteomic analysis. We identified a difference in the expression of mitochondrial energy metabolism proteins between normal and prostate cancer cell lines. In addition, we selected and verified proteins related to mitochondrial energy metabolism that might be useful as a specific signature in prostate cancer.
Materials and Methods
Cell culture
The prostate epithelial cell line RWPE-1 and the prostate cancer cell lines Du145 and PC3 were purchased from the American Type Culture Collection (ATCC; Manassas, VA, USA). The prostate cancer cell line LNCaP was provided by the Eulji hospital. RWPE-1 cells were cultured in keratinocyte serum-free medium supplemented with 5 ng/mL epidermal growth factor and 50 µg/mL bovine pituitary extract (basic medium) (Invitrogen, Grand Island, NY, USA). All cancer cell lines were maintained in RPMI 1640 medium (Gibco, Grand Island, NY, USA) supplemented with 10 % fetal bovine serum (FBS) (Gibco), 100 µg/mL penicillin, and 100 µg/µL streptomycin (basic medium) (Gibco). All cell lines were seeded in 75 cm2 flasks at a density of 1 × 10⁶ cells/flask in basic media and grown for 2 days in a humidified incubator at 37 °C with 5 % CO2. To deplete any androgenic effects, culture media were replaced with basic media containing 10 % charcoal/dextran FBS instead of 10 % FBS. After 72 h, cell lines were treated with 10 nM 5-α-dihydrotestosterone for 3 days.
Sample preparation and trypsin digestion
Cells were lysed in buffer containing 8 M urea and 0.1 M Tris-HCl, pH 8.5. Protein concentrations were measured via the Bradford assay (Pierce, Rockford, IL, USA). Protein samples (1 mg) were then reduced in buffer containing 5 mM Tris(2-carboxyethyl)phosphine (Pierce) and incubated at 37 °C for 30 min with shaking (400 rpm). Samples were alkylated in buffer using 0.5 M iodoacetamide (Sigma-Aldrich, St. Louis, MO, USA) and incubated at room temperature for 60 min with shaking (400 rpm) in the dark. Samples were then treated with trypsin (1 mg/20 µl; Promega, Madison, WI, USA) overnight with shaking (400 rpm) at 37 °C to digest proteins into peptides. Peptide mixtures were then desalted on a Sep-Pak C18 cartridge (Waters, Milford, MA, USA), and the resulting samples were diluted with 360 µL of water for OFFGEL electrophoresis (Agilent Technologies, Santa Clara, CA, USA).
Peptide fractionation by OFFGEL electrophoresis
Desalted peptides were separated into 12 fractions based on their isoelectric point via OFFGEL electrophoresis using a 3100 OFFGEL Low Res kit, pH 3-10 (Agilent Technologies), according to the manufacturer's instructions.
Microcapillary liquid chromatography-tandem mass spectrometry (LC-MS/MS)
Samples were analyzed using a high-performance liquid chromatography chip/quadrupole time-of-flight (Q-TOF) system (Agilent Technologies). This system consisted of an Agilent 1200 series nano-LC system and an Agilent 6520 Q-TOF coupled with a chip cube interface to analyze peptide fractions. The high-performance liquid chromatography chip consisted of a 360 nL enrichment column and a 75 µm × 150 mm separation column packed with Polaris C18-A (3 µm). Each sample was loaded onto the column in buffer A (0.1 % FA in water) at a flow rate of 2 µL/min. Buffer B (90 % ACN, 0.1 % FA in water) was used to deliver the 120-min gradient of 3 to 45 % (0-100 min), 45 to 90 % (100-100.10 min), 90 to 98 % (100.10-105.00 min), and 98 %-3 % (105.00-105.10 min) at a flow rate of 0.3 µL/min. All spectra were acquired in positive ionization mode. The drying gas (nitrogen) flow was set at 5 L/min and 300 °C. Eluted peptides were selected for collision-induced dissociation during alternative procedures of an MS scan over the m/z range of 300-2,400 at the rate of 4 spectra/s, and an MS/MS scan over the range of 100-3,000 m/z at 3 spectra/s. The isolation window was 4 m/z. The workflow is shown in Fig. S1.
Data analysis
Spectrum Mill (Version B.04.00, Agilent Technologies) is a database search engine used to analyze tandem mass spectra. The UniProtKB database (human, released in April 2015) was used to search each triplicate run. Trypsinization allowed a maximum of two missed cleavage sites. Carbamidomethylation of cysteines and carbamylation of the N-terminus were selected as fixed modifications. Oxidized methionine was selected as a variable modification. Precursor and product mass tolerances were set to 20 and 50 ppm, respectively. False discovery rate of 1.2 % at peptide levels was used for results.
Bioinformatics
The protein expression profiles of prostate cancer cell lines were compared with that of RWPE-1 cells using MassHunter Mass Profiler Professional software (MPP, Version 12.1, Agilent Technologies), which is a label-free quantification program. Data files including mass, charge, and retention time of molecular features were acquired from the MS mode for each sample and analyzed in triplicate. All raw data were normalized and different samples were compared by each sample's averaged intensity. The filtered entities list was analyzed with Student's unpaired t-tests and Bonferroni multiple correlation tests using asymptotic p-value computation. MassHunter Mass Profiler Professional software was used to determine the 1.2- and 0.8-fold changes defined as up- and down-regulated differences, respectively, between each group by setting a filter. The filtered entities list was analyzed.
GeneGo Metacore software (Version 6.29; Genego, MI, USA) was used to analyze pathways associated with differentially expressed proteins in the prostate cancer cell lines compared to RWPE-1 cells. Ranked pathway lists were created based on the calculated p-values using hypergeometric test. The p-values that are calculated in Metacore were represented in the lowest order. We selected top 10 rankings in a lower p-value order. The ranking shows probability of networks of transcription factor mapped protein lists from our date compared to networks of the number of proteins having Genego software. To identify transcription factors associated with mitochondrial energy metabolism, we used a transcription regulation algorithm to analyze the networks. A Transcription Regulation algorithm was identified and ranked by enriched sub-networks formed from canonical pathways.
RNA extraction and quantitative polymerase chain reaction (PCR)
To identify the role of Yin Yang 1 (YY1) in prostate cell lines, cells were treated with 10 nM NP-001 (Adooq Bioscience, Irvine, CA, USA), a YY1 inhibitor, for 24 h. Total RNA was then extracted from each treatment and control population using Trizol reagent (Invitrogen) according to the manufacturer's instructions. RNA concentrations were measured with a NanoDrop Lite spectrophotometer (Thermo Fisher Scientific, Waltham, MA, USA). cDNA (1 µg) was synthesized from total RNA using a First Strand cDNA Synthesis Kit (Thermo Fisher Scientific), as described by the manufacturer. Real-time PCR was performed using TOPreal™ qPCR 2× PreMIX (SYBR Green with low ROX) from Enzynomics (Daejeon, South Korea). All PCR reactions were carried out in triplicate using the StepOnePlus Real-Time PCR kit (Applied Biosystems, Carlsbad, CA, USA). The PCR primers and conditions are shown in Table S1. mRNA levels were calculated by the 2ΔΔct method using StepOne software (Applied Biosystems). Results were compared using the Mann Whitney test and are presented as mean ± standard deviation (SD); p<0.05 was considered statistically significant. All statistical analyses were conducted using SPSS software (SPSS Statistics, Chicago, IL, USA).
Results
Proteomic analysis of prostate cell lines
We performed a proteomic analysis to find a prostate cancer-specific protein signature. A total of 2,599, 2,662, 2,816, and 2,494 proteins were detected in the prostate cell line RWPE-1, and in the prostate cancer cell lines LNCaP, Du145, and PC3, respectively (Fig 1). Common proteins in cancer cell lines compared with those in RWPE-1 are shown in Fig. S2A. Notably, compared to the RWPE-1 cell line, there were 795 proteins that were differentially expressed in LNCaP cells (477 up-regulated and 318 down-regulated; Table S2 and Fig. S2B), 762 in Du145 cells (527 up-regulated and 235 down-regulated; Table S3 and Fig. S2B), and 537 in PC3 cells (95 up-regulated and 442 down-regulated; Table S4 and Fig. S2B).
Pathway analysis of differentially expressed proteins
We next identified the pathways formed by the differentially expressed proteins (those that were more than 1.2-fold up-regulated or more than 0.8-fold down-regulated) observed in the three prostate cancer cell lines, compared with RWPE-1 cells. Notably, mitochondrial energy metabolism pathways related to the Krebs cycle and electron transport chain were highly prevalent among the up-regulated proteins (Fig. 2A, Fig. S3), whereas pathways associated with cytoskeleton remodeling were highly represented among the down-regulated proteins (Fig. 2B).
Figure 1
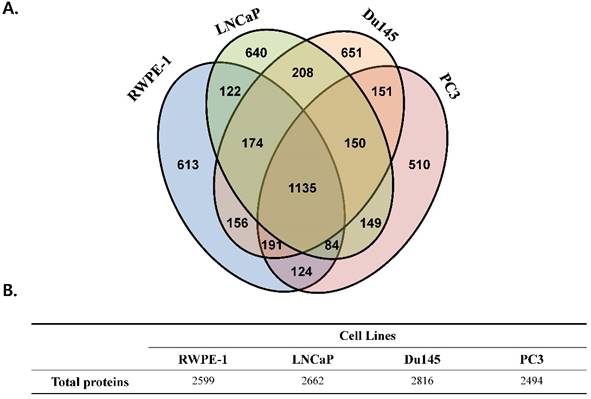
Total number of proteins identified in the four prostate cell lines. All analyses were performed in triplicate. (A) Venn diagram representing the overlap in the identified proteins. (B) Table displaying the total number of proteins identified in each prostate cell line.
Figure 2
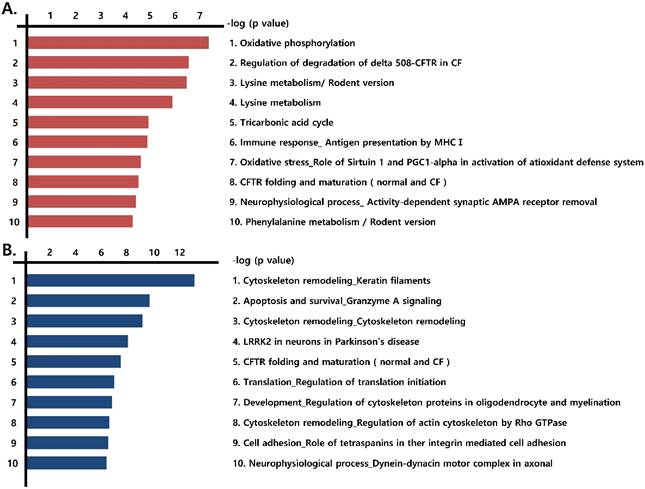
Functional analysis of differentially expressed proteins. Top pathway map based on (A) up- and (B) down-regulated proteins in cancer cell lines (LNCaP, Du145, and PC3), compared to the control cell line (RWPE-1), using the Metacore software from Thomson Reuters.
Identification of transcription regulatory factors
To find the main transcription factor(s) regulating mitochondrial energy metabolism, we analyzed proteins that were over-expressed in prostate cancer cell lines using networks of transcriptional regulation. The top-ranked transcription factors were c-Myc, YY1, ERR3, and CREB1 (Table 1). Of these, c-Myc is also highly ranked in the glycolysis and gluconeogenesis pathways, which are related to main sources of energy that are not specific to the metabolism in prostate cancer (Table S5). Therefore, YY1 was focused on as the principal transcription factor that might regulate mitochondrial energy metabolism. We determined YY1 expression in normal prostate tissue and prostate cancer tissue using the human protein atlas database. Although there is a difference between the variance patient and antibody, YY1 expression increased in prostate cancer tissue compared with that in normal prostate tissue (Fig. S4). These results are consistent with those of Singh et al [21] and Yu et al [22].
Regulation of mitochondrial energy metabolism by YY1
To confirm that YY1 regulates mitochondrial energy metabolism, we first assessed its expression using quantitative PCR. YY1 expression was reduced by more than 50 % in all three prostate cancer cell lines when cells were treated with NP-001, a YY1 inhibitor (Fig. 3). In addition, the expression of genes related to the Krebs cycle (ACO2, IDH2, OGDH, DLD, SUCK2, and FH) and electron transport chain (NDFUFA9, NDUFS1, SDHA, SDHB, UQCRC2, COX2, COX4l1, COX5B, ATP5A1, ATP5B, and ATP5F1) was decreased in prostate cancer cell lines treated with NP-001, compared to the untreated controls (Figs. 4 and 5). These results suggest that YY1 is a key and specific transcription factor regulating mitochondrial energy metabolism in prostate cancer cell lines.
Figure 3
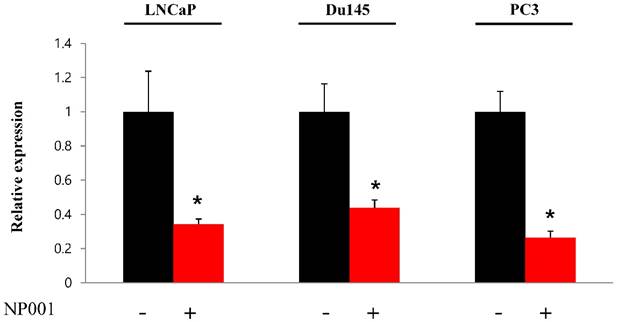
Quantification of Yin Yang 1 (YY1) mRNA expression in prostate cancer cell lines. LNCaP, Du145, and PC3 cells were treated with 10 nM NP-001 for 24 h. Data are shown as the mean ± standard deviation (SD) (n=3), *p<0.05.
Discussion
Various studies have been undertaken to identify molecular pathways or networks that can be used for cancer diagnoses [23-26]. However, molecular pathways or networks involving RAS, RAF, MEK, or ERK are over-expressed in both prostate and other cancers [27, 28]. Thus, these factors cannot be used as specific diagnostic biomarkers of prostate cancer. Therefore, in this study, we searched for a specific signature that represented prostate cancer, distinct from other cancers, by examining factors that regulate mitochondrial energy metabolism in a prostate-specific environment.
Table 1
Transcriptional regulation analysis of differentially expressed proteins associated with mitochondrial energy metabolism in cancer cell lines compared with RWPE-1 cells.
| Key network objects | p‑Value | z Score | g Score |
|---|---|---|---|
| c‑Myc | 1.84e-81 | 288.63 | 288.63 |
| YY1 | 2.99e-47 | 218.60 | 218.60 |
| ERR3 | 2.99e-47 | 218.60 | 218.60 |
| CREB1 | 1.54e-43 | 209.40 | 209.40 |
| SP1 | 3.63e-36 | 189.70 | 189.70 |
| ERR1 | 3.63e-36 | 189.70 | 189.70 |
| NRF1 | 3.09e-25 | 155.71 | 155.71 |
| E2F1 | 4.81e-18 | 128.42 | 128.42 |
| NRF2 | 4.81e-18 | 128.42 | 128.42 |
| ZNF143 | 1.76e-14 | 112.54 | 112.54 |
In normal cells, high energy levels are required for various functions. The primary energy sources are glycolysis and mitochondrial energy metabolism (i.e., the Krebs cycle and electron transport chain), through which cells generate 36 ATP per glucose. However, most cancer cells obtain energy through less efficient glycolysis rather than mitochondrial oxidative energy metabolism. This phenomenon is called the “Warburg effect” [29, 30]. Notably, the opposite effect is observed when normal prostate tissue progresses to cancer; in these tissues, mitochondrial energy metabolism is increased rather than decreased [19-21]. This phenomenon is closely associated with Zn levels in prostate tissue, which possesses 10-fold more Zn than other soft tissues. Zn inhibits the expression of m-aconitase, which converts citrate to isocitrate in the Krebs cycle. Conversely, cancerous prostate tissues exhibit Zn levels that are similar to those of other normal tissues, which in turn lead to increased m-aconitase activity, thereby enhancing the conversion of citrate to isocitrate and mitochondrial energy metabolism. Notably, this effect represents a prostate cancer-specific phenomenon that can be exploited [18-21].
Figure 4
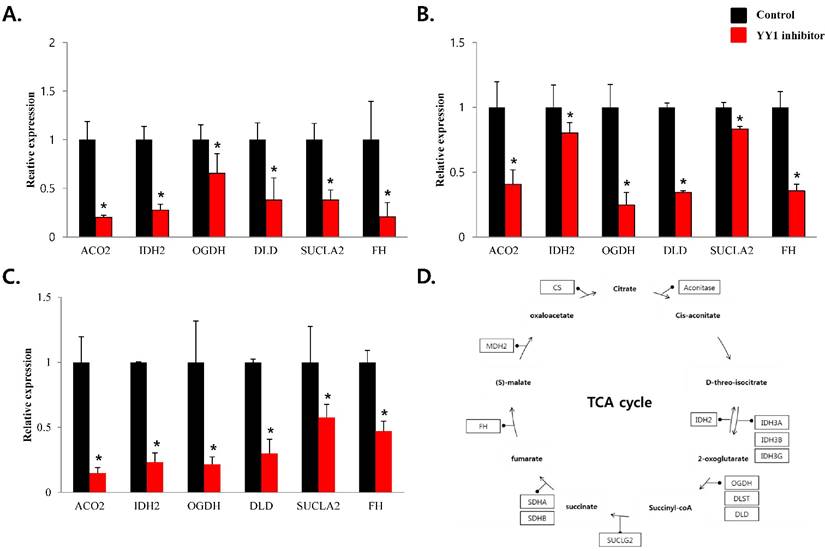
mRNA expression levels of genes associated with mitochondrial energy metabolism in prostate cancer cell lines. Treatment of (A) LNCaP, (B) Du145, and (C) PC3 cells with NP-001 resulted in reduced expression of many of the genes involved in Krebs cycle. Data are shown as mean ± standard deviation (SD) (n=3), *p<0.05. (D) Schematic of target genes participating in the Krebs cycle.
As mentioned above, the prostate has a unique mitochondrial energy metabolism that increases when normal tissue progresses to cancer. This phenomenon occurs in a prostate-specific environment, and is absent in other tissues. Therefore, it is important to characterize the energy metabolism in prostate cancer as well as the major factors regulating it. Using a proteomics approach, we determined that proteins related to mitochondrial energy metabolism were top-ranked in prostate cancer cell lines compared to that in RWPE-1. Among 1.2-fold over-expressed proteins related to mitochondrial energy metabolism in prostate cancer cell lines (Fig. S3), several proteins related to the Krebs cycle, such as m-aconitase (citrate → isocitrate) [21, 31], citrate synthase (acetyl-CoA + oxaloacetate → citrate) [31], iso-citrate dehydrogenase (isocitrate → oxalosuccinate) [31, 32], and malate dehydrogenase (oxaloacetate → malate) [31], have been reported to be up-regulated in prostate cancer tissue compared with that in normal prostate tissue. Many researchers have revealed that proteins related to electron transport chain responsible for ATP production, such as complex I [33], complex IV [34], and complex V [34], show mutations and are known to play an important role in prostate tumorigenesis. These published results are highly consistent with our data.
Proteomics is a powerful tool that can be used to assess various transcriptional regulatory mechanisms and direct interactions between transcription factors and proteins [35-38]. We found that many of the proteins that were over-expressed in prostate cancer cell lines, compared to a non-cancerous prostate cell line, are involved in mitochondrial energy metabolism. These findings suggest that prostate cancer requires higher levels of energy than normal prostate tissue.
We subsequently analyzed key transcription factors related to proteins involved in mitochondrial energy metabolism. c-Myc, YY1, ERR3, and CREB1 were the top-ranked transcription factors identified, respectively (Supplementary Table 1). c-Myc plays a major role in various cancers, including prostate cancer, and its function in cancer cells is closely related to the cell cycle [39, 40]. In our data, c-Myc was the top-ranked transcription factor involved in regulating glycolysis and gluconeogenesis, which are the main energy acquisition processes in other cancers. Meanwhile, YY1 was ranked second in our analysis. YY1 has many functions, including the ability to regulate mitochondrial oxidative metabolism by forming a transcriptional complex with PGC-1α in the nucleus (Fig. S5) [41]. YY1 was also reported as a factor that can potentially bind m-aconitase [42] as well as many mitochondrial oxidative genes [42-44]. Therefore, interactions between YY1 and molecules involved in the Krebs cycle and mitochondrial electron transport chain may modulate the unique mitochondrial energy metabolism signature observed in prostate cancer. This possibility is consistent with our results showing that inhibition of YY1 expression resulted in decreased expression of genes related to mitochondrial energy metabolism in prostate cancer cell lines.
Figure 5
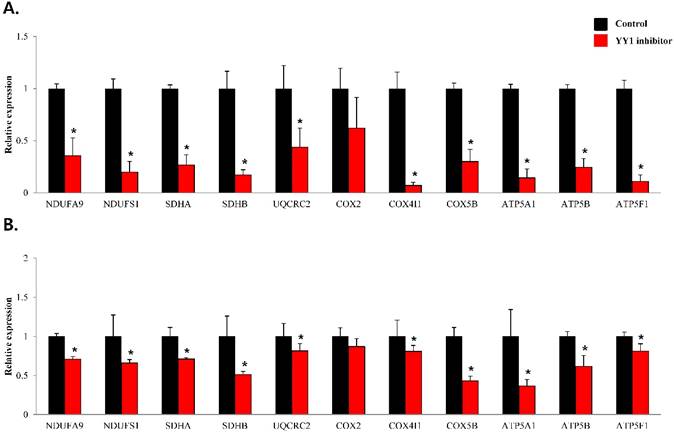
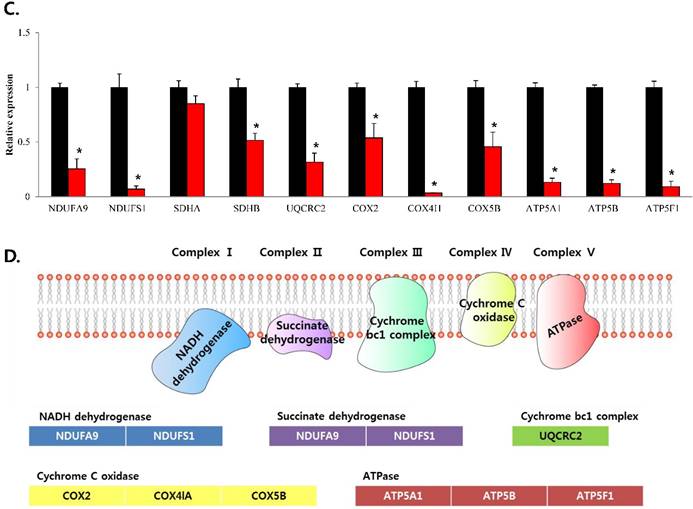
mRNA expression levels of genes associated with electron transport chain in prostate cancer cell lines. Treatment of (A) LNCaP, (B) Du145, and (C) PC3 cells with NP-001 resulted in reduced expression of many of the genes involved in electron transport chain. Data are shown as mean ± standard deviation (SD) (n=3), *p < 0.05. (D) Schematic of the genes involved in electron transport chain.
In summary, using a proteomic approach, we found that YY1 functions as a major transcription factor that is involved in regulating mitochondrial energy metabolism in prostate cancer. Moreover, we found that YY1 is associated with a prostate cancer-specific metabolic signature by showing that YY1-regulated genes are involved in mitochondrial energy metabolism. Several reports have described over-expressed YY1 in prostate tissue, as well as increased activity in mitochondrial energy metabolism, when normal prostate tissue progresses to cancer. Our study is the first to identify a prostate cancer-specific signature that could be useful as a tumor-specific biomarker for prostate cancer as well as other diseases. Moreover, our results suggest novel basis for the specific diagnosis of prostate cancer and perhaps its treatment.
Abbreviations
YY1: Yin Yang 1; m-aconitase: mitochondrial aconitase; LC-MS/MS: liquid chromatography-tandem mass spectrometry.
Supplementary Material
Additional File 1Figures S1-S5, Table S1, Table S5.
Tables S2-S4.
Acknowledgements
This research was supported by the Bio & Medical Technology Development Program of the NRF funded by the Korean government, MSIP (No. 2016M3A9B694241). This paper was supported by Eulji University in 2013.
Competing Interests
The authors declare that they have no competing interests.
References
1. Davalieva K, Kiprijanovska S, Komina S, Petrusevska G, Zografska NC, Polenakovic M. Proteomics analysis of urine reveals acute phase response proteins as candidate diagnostic biomarkers for prostate cancer. Proteome Sci. 2015;13:2
2. Geisler C, Gaisa NT, Pfister D, Fuessel S, Kristiansen G, Braunschweig T. et al. Identification and validation of potential new biomarkers for prostate cancer diagnosis and prognosis using 2D-DIGE and MS. Biomed Res Int. 2015;2015:454256
3. Øverbye A, Skotland T, Koehler CJ, Thiede B, Seierstad T, Berge V. et al. Identification of prostate cancer biomarkers in urinary exosomes. Oncotarget. 2015;6:30357
4. Rehman I, Evans CA, Glen A, Cross SS, Eaton CL, Down J. et al. iTRAQ identification of candidate serum biomarkers associated with metastatic progression of human prostate cancer. PLoS One. 2012;7:e30885
5. Khan AP, Poisson LM, Bhat VB, Fermin D, Zhao R, Kalyana-Sundaram S. et al. Quantitative proteomic profiling of prostate cancer reveals a role for miR-128 in prostate cancer. Molecular & Cellular Proteomics. 2010;9:298-312
6. Coarfa C, Fiskus W, Eedunuri V, Rajapakshe K, Foley C, Chew S. et al. Comprehensive proteomic profiling identifies the androgen receptor axis and other signaling pathways as targets of microRNAs suppressed in metastatic prostate cancer. Oncogene. 2016;35:2345-56
7. Massie CE, Lynch A, Ramos-Montoya A, Boren J, Stark R, Fazli L. et al. The androgen receptor fuels prostate cancer by regulating central metabolism and biosynthesis. EMBO J. 2011;30:2719-33
8. Vellaichamy A, Dezso Z, JeBailey L, Chinnaiyan AM, Sreekumar A, Nesvizhskii AI. et al. "Topological significance" analysis of gene expression and proteomic profiles from prostate cancer cells reveals key mechanisms of androgen response. PLoS One. 2010;5:e10936
9. Benjamin Daniel I, Cravatt Benjamin F, Nomura Daniel K. Global Profiling Strategies for Mapping Dysregulated Metabolic Pathways in Cancer. Cell Metabolism. 2012;16:565-77
10. Grubb III RL, Deng J, Pinto PA, Mohler JL, Chinnaiyan A, Rubin M. et al. Pathway Biomarker Profiling of Localized and Metastatic Human Prostate Cancer Reveal Metastatic and Prognostic Signatures†. Journal of proteome research. 2009;8:3044-54
11. Saraon P, Cretu D, Musrap N, Karagiannis GS, Batruch I, Drabovich AP. et al. Quantitative proteomics reveals that enzymes of the ketogenic pathway are associated with prostate cancer progression. Molecular & Cellular Proteomics. 2013;12:1589-601
12. Guo Y, Xu F, Lu T, Duan Z, Zhang Z. Interleukin-6 signaling pathway in targeted therapy for cancer. Cancer Treat Rev. 2012;38:904-10
13. Lucas SM, Heath EI. Current challenges in development of differentially expressed and prognostic prostate cancer biomarkers. Prostate cancer. 2012. 2012
14. Martin SK, Vaughan TB, Atkinson T, Zhu H, Kyprianou N. Emerging biomarkers of prostate cancer (Review). Oncol Rep. 2012;28:409-17
15. Tian M, Neil JR, Schiemann WP. Transforming growth factor-beta and the hallmarks of cancer. Cell Signal. 2011;23:951-62
16. Tribollet V, Barenton B, Kroiss A, Vincent S, Zhang L, Forcet C. et al. miR-135a Inhibits the Invasion of Cancer Cells via Suppression of ERRalpha. PLoS One. 2016;11:e0156445
17. Diamandis EP. Mass spectrometry as a diagnostic and a cancer biomarker discovery tool: opportunities and potential limitations. Mol Cell Proteomics. 2004;3:367-78
18. Costello LC, Feng P, Milon B, Tan M, Franklin RB. Role of zinc in the pathogenesis and treatment of prostate cancer: critical issues to resolve. Prostate Cancer Prostatic Dis. 2004;7:111-7
19. Costello LC, Franklin RB. The clinical relevance of the metabolism of prostate cancer; zinc and tumor suppression: connecting the dots. Mol Cancer. 2006;5:17
20. Dakubo GD, Parr RL, Costello LC, Franklin RB, Thayer RE. Altered metabolism and mitochondrial genome in prostate cancer. J Clin Pathol. 2006;59:10-6
21. Singh KK, Desouki MM, Franklin RB, Costello LC. Mitochondrial aconitase and citrate metabolism in malignant and nonmalignant human prostate tissues. Mol Cancer. 2006;5:14
22. Yu YP, Landsittel D, Jing L, Nelson J, Ren B, Liu L. et al. Gene expression alterations in prostate cancer predicting tumor aggression and preceding development of malignancy. J Clin Oncol. 2004;22:2790-9
23. Bhatt AN, Mathur R, Farooque A, Verma A, Dwarakanath B. Cancer biomarkers-Current perspectives. Indian J Med Res. 2010;132(2):129-149
24. Kosaka N, Iguchi H, Ochiya T. Circulating microRNA in body fluid: a new potential biomarker for cancer diagnosis and prognosis. Cancer Sci. 2010;101:2087-92
25. Sethi S, Ali S, Philip PA, Sarkar FH. Clinical advances in molecular biomarkers for cancer diagnosis and therapy. Int J Mol Sci. 2013;14:14771-84
26. Winter JM, Yeo CJ, Brody JR. Diagnostic, prognostic, and predictive biomarkers in pancreatic cancer. J Surg Oncol. 2013;107:15-22
27. McCubrey JA, Steelman LS, Chappell WH, Abrams SL, Wong EW, Chang F. et al. Roles of the Raf/MEK/ERK pathway in cell growth, malignant transformation and drug resistance. Biochim Biophys Acta. 2007;1773:1263-84
28. Roberts PJ, Der CJ. Targeting the Raf-MEK-ERK mitogen-activated protein kinase cascade for the treatment of cancer. Oncogene. 2007;26:3291-310
29. Sun Y, Shi Z, Lian H, Cai P. Energy metabolic dysfunction as a carcinogenic factor in cancer cells. Clin Transl Med. 2016;5:14
30. Zheng J. Energy metabolism of cancer: Glycolysis versus oxidative phosphorylation (Review). Oncol Lett. 2012;4:1151-7
31. Altenberg B, Greulich KO. Genes of glycolysis are ubiquitously overexpressed in 24 cancer classes. Genomics. 2004;84:1014-20
32. Kang MR, Kim MS, Oh JE, Kim YR, Song SY, Seo SI. et al. Mutational analysis of IDH1 codon 132 in glioblastomas and other common cancers. International journal of cancer. 2009;125:353-5
33. Chatterjee A, Mambo E, Sidransky D. Mitochondrial DNA mutations in human cancer. Oncogene. 2006;25:4663-74
34. Petros JA, Baumann AK, Ruiz-Pesini E, Amin MB, Sun CQ, Hall J. et al. mtDNA mutations increase tumorigenicity in prostate cancer. Proceedings of the National Academy of Sciences of the United States of America. 2005;102:719-24
35. Chen QR, Yu LR, Tsang P, Wei JS, Song YK, Cheuk A. et al. Systematic proteome analysis identifies transcription factor YY1 as a direct target of miR-34a. J Proteome Res. 2011;10:479-87
36. Giambruno R, Grebien F, Stukalov A, Knoll C, Planyavsky M, Rudashevskaya EL. et al. Affinity purification strategies for proteomic analysis of transcription factor complexes. J Proteome Res. 2013;12:4018-27
37. Li X, Wang W, Wang J, Malovannaya A, Xi Y, Li W. et al. Proteomic analyses reveal distinct chromatin-associated and soluble transcription factor complexes. Mol Syst Biol. 2015;11:775
38. Zhu G, Cai G, Liu Y, Tan H, Yu C, Huang M. et al. Quantitative iTRAQ LC-MS/MS Proteomics Reveals Transcription Factor Crosstalk and Regulatory Networks in Hypopharyngeal Squamous Cell Carcinoma. J Cancer. 2014;5:525-36
39. Bretones G, Delgado MD, Leon J. Myc and cell cycle control. Biochim Biophys Acta. 2015;1849:506-16
40. Zajac-Kaye M. Myc oncogene: a key component in cell cycle regulation and its implication for lung cancer. Lung cancer. 2001;34:S43-S6
41. Cunningham JT, Rodgers JT, Arlow DH, Vazquez F, Mootha VK, Puigserver P. mTOR controls mitochondrial oxidative function through a YY1-PGC-1&agr; transcriptional complex. nature. 2007;450:736-40
42. Xi H, Yu Y, Fu Y, Foley J, Halees A, Weng Z. Analysis of overrepresented motifs in human core promoters reveals dual regulatory roles of YY1. Genome research. 2007;17:798-806
43. Basu A, Lenka N, Mullick J, Avadhani NG. Regulation of Murine Cytochrome Oxidase Vb Gene Expression in Different Tissues and during Myogenesis ROLE OF A YY-1 FACTOR-BINDING NEGATIVE ENHANCER. Journal of Biological Chemistry. 1997;272:5899-908
44. Seelan RS, Grossman LI. Structural Organization and Promoter Analysis of the Bovine Cytochrome c Oxidase Subunit VIIc Gene A FUNCTIONAL ROLE FOR YY1. Journal of Biological Chemistry. 1997;272:10175-81
Author contact
![]() Corresponding author:
Corresponding author:
Citation styles
APA
Park, A., Lee, J., Mun, S., Kim, D.J., Cha, B.H., Moon, K.T., Yoo, T.K., Kang, H.G. (2017). Identification of Transcription Factor YY1 as a Regulator of a Prostate Cancer-Specific Pathway Using Proteomic Analysis. Journal of Cancer, 8(12), 2303-2311. https://doi.org/10.7150/jca.19036.
ACS
Park, A.; Lee, J.; Mun, S.; Kim, D.J.; Cha, B.H.; Moon, K.T.; Yoo, T.K.; Kang, H.G. Identification of Transcription Factor YY1 as a Regulator of a Prostate Cancer-Specific Pathway Using Proteomic Analysis. J. Cancer 2017, 8 (12), 2303-2311. DOI: 10.7150/jca.19036.
NLM
Park A, Lee J, Mun S, Kim DJ, Cha BH, Moon KT, Yoo TK, Kang HG. Identification of Transcription Factor YY1 as a Regulator of a Prostate Cancer-Specific Pathway Using Proteomic Analysis. J Cancer 2017; 8(12):2303-2311. doi:10.7150/jca.19036. https://www.jcancer.org/v08p2303.htm
CSE
Park A, Lee J, Mun S, Kim DJ, Cha BH, Moon KT, Yoo TK, Kang HG. 2017. Identification of Transcription Factor YY1 as a Regulator of a Prostate Cancer-Specific Pathway Using Proteomic Analysis. J Cancer. 8(12):2303-2311.
This is an open access article distributed under the terms of the Creative Commons Attribution (CC BY-NC) license (https://creativecommons.org/licenses/by-nc/4.0/). See http://ivyspring.com/terms for full terms and conditions.