Journal of Cancer
ISSN: 1837-9664
3.2
Impact Factor
ISSN: 1837-9664

 Global reach, higher impact
J Cancer 2024; 15(4):916-925. doi:10.7150/jca.88778 This issue Cite
Research Paper
A nomogram prediction model based on clinicopathological combined radiological features for metachronous liver metastasis of colorectal cancer
Zhihua Lu1† ![]() , Jinbing Sun2†, Mi Wang3, Heng Jiang2, Guangqiang Chen4, Weiguo Zhang1
, Jinbing Sun2†, Mi Wang3, Heng Jiang2, Guangqiang Chen4, Weiguo Zhang1
1. Department of Radiology, Dushu Lake Hospital Affiliated to Soochow University, Medical Center of Soochow University, Suzhou Dushu Lake Hospital, Suzhou, Jiangsu, 215123, China.
2. Department of General Surgery, Changshu No.1 People's Hospital, Affiliated Changshu Hospital of Soochow University, 1 Shuyuan Road, Changshu, Jiangsu 215500, China.
3. Soochow University, Suzhou, Jiangsu, 215031, China.
4. Department of Radiology, the Second Affiliated Hospital of Soochow University, Suzhou, Jiangsu, 215004, China.
† These authors contributed equally to this work.
Received 2023-8-3; Accepted 2023-11-24; Published 2024-1-1
Citation:
Lu Z, Sun J, Wang M, Jiang H, Chen G, Zhang W. A nomogram prediction model based on clinicopathological combined radiological features for metachronous liver metastasis of colorectal cancer. J Cancer 2024; 15(4):916-925. doi:10.7150/jca.88778. https://www.jcancer.org/v15p0916.htm
Other stylesAbstract

Objective: To establish a nomogram prediction model (based on clinicopathological and radiological features) for the development of metachronous liver metastasis (MLM) in patients with colorectal cancer (CRC).
Methods: This retrospective study included patients with CRC who underwent surgery at Changshu No.1 People's Hospital and the Second Affiliated Hospital of Soochow University between January 2016 and December 2018. The clinical, pathological, and radiological features of each patient were investigated. Risk factors for MLM were identified by univariable and multivariable analyses. The predictive nomogram for MLM development was constructed. The predictive performance of the nomogram was estimated by the receiver operating characteristics curve, calibration curve, and decision curve analysis.
Results: This study included 161 patients with CRC [median age: 66 (range, 33-87) years]. Fifty-nine developed MLM after a median of 12 (range, 2-52) months after surgery. The multivariable logistic regression analysis showed that age >66 years (OR=3.471, 95% CI: 1.272-9.473, P=0.015), N2 stage (OR=6.534, 95% CI: 1.456-29.317, P=0.014), positive vascular invasion (OR=2.995, 95% CI: 1.132-7.926, P=0.027), positive tumor deposit (OR=4.451, 95% CI: 1.153-17.179, P=0.030), and linear (OR=6.774, 95% CI: 1.306-35.135, P=0.023) and nodal pericolic fat infiltration patterns (OR=8.762, 95% CI: 1.521-50.457, P=0.015) were independently associated with MLM. These five factors were used to create a nomogram. The area under the receiver operating characteristics curve of the nomogram was 0.866 (95% CI: 0.803-0.914), indicating favorable prediction performance. The calibration curve of the nomogram showed a satisfactory agreement between the predicted and actual probabilities.
Conclusions: A nomogram prediction model based on five clinicopathological and radiological features might have favorable prediction performance for MLM in patients who underwent surgery for CRC. Hence, the present study proposes a nomogram that can easily be used to predict MLM after CRC surgery based on readily available features.
Keywords: colorectal cancer, metachronous liver metastasis, clinicopathological and radiological features, nomogram, prediction model
Introduction
Colorectal cancer (CRC) is a malignant neoplasm of the colon or rectum and the third most common cancer worldwide, with an estimated 1,880,725 new cases worldwide in 2020 and 915,880 related deaths 1. The liver is the most common site of distant metastasis of CRC 2-4. Liver metastasis (LM) is difficult to manage and the main cause of death among patients with CRC. The 5-year survival rate of patients with unresectable LM was less than 5% 2,5. About 15%-30% of patients with CRC already have LM at CRC diagnosis (i.e., synchronous), and 20%-50% will develop metachronous LM (MLM) after radical resection of the primary tumor 3. The early identification of patients with CRC at a high risk of MLM is essential for targeted screening and individualized treatment. Therefore, it is meaningful to identify MLM high-risk features.
Previous studies reported that some clinical and pathological risk factors are independent factors for LM of CRC, including age, preoperative serum carcinoembryonic antigen (CEA) levels, T and N stages, vascular invasion, histological grade, and KRAS mutations 6-11, but there are no consensuses. In addition, effective imaging characteristics of the primary CRC for predicting MLM are lacking. Kim et al. 12 analyzed the computed tomography (CT) features of primary CRC, including the morphologic and enhancement characteristics; seven CT features were associated with poorly differentiated (PD) over well- or moderately differentiated (WD or MD) CRC. Eurboonyanun et al. 13 reported that BRAF-mutant CRC has specific imaging characteristics. Hence, the CT features of the primary CRC could helpfully provide effective baseline imaging characteristics for prognosis. In addition, the imaging characteristics of the primary CRC are often less affected and more stable 14. Therefore, it can be hypothesized that some CT features of primary CRC tumors may be helpful in predicting MLM in patients with CRC.
The present study aimed to establish a nomogram model based on clinicopathological and radiological features for predicting MLM from CRC.
Methods
Study design and patients
This retrospective study included patients with CRC treated by surgical resection at Changshu No.1 People's Hospital and the Second Affiliated Hospital of Soochow University between January 2016 and December 2018.
The inclusion criteria were 1) underwent CRC resection and 2) histopathologically confirmed colorectal adenocarcinoma. The exclusion criteria were 1) mucinous adenocarcinoma, 2) synchronous liver metastasis, 3) the first metastatic sites did not include the liver, 4) incomplete clinical and radiological data, 5) neoadjuvant therapy or 6) follow-up of less than 3 years.
This study was approved by the Ethics Committee of Changshu No.1 People's Hospital (approval #(2020) LUN No. 012). The first author, Zhihua Lu, originally worked in the Changshu No.1 People's Hospital and was transferred to Dushu Lake Hospital Affiliated to Soochow University, after completing the project. The study was conducted in accordance with the Declaration of Helsinki. The requirement for individual informed consent was waived by the board.
Data collection and definitions
The pathological diagnosis of the included cases in this study was consistent with the AJCC Version 8 diagnostic criteria 15. Although different definitions of MLM have been suggested 16-19, the present study used diagnosis/surgery as the cut-off point between the 'synchronous' and 'metachronous' groups 19.
The clinical information and pathological data of each patient were collected from the electronic patient charts. The clinical information included the age, sex, preoperative serum CEA (normal CEA: 0-10 ng/ml), preoperative carbohydrate antigen 19-9 (CA19-9) (normal CA19-9: 0-37 U/ml), primary tumor site, and CT scan data of the chest, abdomen, and pelvis. The pathological information included T and N stages, histologic tumor grade, vascular invasion, perineural invasion, and tumor deposits.
The following features were dichotomized into two categories: sex (male vs. female), age (median of the study population; ≤ 66 vs. > 66 years), preoperative CEA levels (upper limit of the normal range; ≤ 10 vs. >10 ng/ml), preoperative CA19-9 levels (upper limit of the normal range; ≤ 37 vs. > 37 µ/ml), vascular invasion (no vs. yes), perineural invasion (no vs. yes), tumor deposits (no vs. yes), maximal wall thickness (median of the study population; ≤ 15 vs. > 15 mm), tumor shape (according to the literature 12,13; thicken vs. polypoid or bulky), and colonic obstruction (no vs. yes). The other features were classified as multiple categories: T stage (T1-2, T3, and T4), N stage (N0, N1, and N2), differentiation grade (well, moderately, and poorly), enhancement pattern (homogeneous, heterogeneous ≤50%, and heterogeneous >50%), enhancement degree (higher attenuation than the liver, attenuation between the liver and muscle, and lower attenuation than the muscle), pericolic fat infiltration pattern (normal, hazy, linear, and nodular), maximal size of regional LN (< 5, 5-10, and > 10 mm).
Postoperative follow-up
The postoperative clinical follow-up was performed according to the Chinese guidelines 20. The follow-up examinations were performed for 3 years, including physical examination, abdominal ultrasound, serum CEA, and CA19-9. For patients with stage II or III CRC, a contrast-enhanced CT scan of the chest, abdomen, and pelvis was performed once a year in the first 3-5 years and once every 1-2 years in the following years. For patients who were highly suspected of liver metastases on CT images but could not be diagnosed definitely, liver magnetic resonance imaging (MRI) was performed.
Computed tomography features
The analysis of the CT features was based on the methods by Kim et al. 12 and Eurboonyanun et al. 13. The analysis included 1) maximal wall thickness, 2) shape of the tumor, 3) enhancement pattern of the tumor, 4) enhancement degree of the tumor, 5) colonic obstruction, 6) pericolic fat infiltration pattern, and 7) size of the regional lymph nodes (LNs).
The maximal wall thickness was measured on images perpendicular to the long axis of the tumor. The tumor's shape was classified as intraluminal polypoid mass or bulky and wall thickening (Figure S1).
The enhancement pattern of the tumor was evaluated in the portal venous (PV) phase and classified as homogeneous vs. heterogeneous. The heterogeneous pattern was demonstrated as lower attenuation to the tumor due to cystic change, necrosis, and mucinous components in the tumor. According to the ratio of low attenuation area to the tumor, it was further divided into heterogeneous ≤ 50% vs. heterogeneous > 50% (Figure S2).
The enhancement degree of the tumor was evaluated in the PV phase and classified as higher attenuation than the liver, attenuation between the liver and muscle, and lower attenuation than the muscle; the region of interest (ROI) was drawn by selecting the largest layer of the solid part of the mass and sketching as much solid part as possible.
The average CT value of the tumor was measured on the largest tumor image and compared with the hepatic parenchyma and muscle; the ROI was drawn by selecting the largest dimension of the solid portion of the mass and sketching the maximum solid portion measurement with obvious enhancement. Colonic obstruction was classified as yes or no according to the CT features.
Pericolic fat infiltration pattern was classified as normal, hazy, linear, and nodular (Figure S3). If the outer contour of the tumor-bearing colorectal segment was smooth and the mesentery adjacent to the tumor showed the same appearance as the adjacent intra-abdominal fat, then it was considered normal. If the outer contour of the tumor-bearing colorectal segment was smooth and the mesentery adjacent to the tumor showed ill-defined, slightly increased density, then it was considered hazy. If the outer layer of the tumor-bearing colorectal segment was coarse and the mesentery adjacent to the tumor showed a well-defined, linear configuration, then it was considered linear. If the outer contour of the tumor-bearing colorectal segment showed a well-defined nodular configuration and invaded into peritumoral mesentery, then it was considered nodular.
The size of the regional LNs was classified as no visible LNs, < 5 mm, 5-10 mm, and > 10 mm according to the short-axis diameter. Regional LNs were defined as LNs located along the course of the major vessels supplying the tumor-bearing colorectum, along the vascular arcades of the marginal artery, and the mesocolic border of the colon 21.
Statistical analysis
Statistical analysis was performed using SPSS 22.0 (IBM Corp., Armonk, NY, USA). The nomogram was plotted using the “rms” package in R version 3.4.1, and all ROC curves were drawn using MedCalc 18.0. All data were expressed as n (%).
The categorical variables were analyzed using the chi-square test. The patient characteristic variables with statistical significance (P < 0.05) between the two groups were included in the multivariable logistic regression analysis to identify the independent risk factors for MLM. A predictive nomogram for MLM development was constructed based on the independent risk factors screened by multivariable logistic analysis. The predictive efficiency of the nomogram model was evaluated using the receiver operating characteristics (ROC) method, and the area under the curve (AUC) was calculated. Finally, the calibration curve of the nomogram was performed. In order to evaluate the nomogram in clinical application value, decision curve analysis (DCA) was used to calculate net benefit under the probability of each risk threshold.
Results
This study included 161 patients with CRC [median age: 66 (range, 33-87) years] (Figure 1); 59 developed MLM in a median of 12 (range, 2-52) months after surgery. Among 17 characteristics, 10 were significantly different between the MLM and non-MLM groups, including age (P = 0.036), T stage (P = 0.037), N stage (P < 0.001), vascular invasion (P < 0.001), maximal wall thickness (P = 0.015), enhancement pattern (P = 0.005), tumor deposit (P < 0.001), colonic obstruction (P = 0.023), pericolic fat infiltration pattern (P < 0.001), and maximal size of regional LNs (P = 0.014) (Table 1). Sex (P = 0.714), preoperative CEA levels (P=0.104), preoperative CA199 levels (P = 0.563), perineural invasion (P = 0.179), differentiation grade (P = 0.070), tumor shape (P = 0.735), and enhancement degree (P = 0.526) were not associated with MLM.
The multivariable logistic regression analysis showed that age >66 years (OR = 3.471, 95% CI: 1.272-9.473, P = 0.015), N2 stage (OR = 6.534, 95% CI: 1.456-29.317, P = 0.014), positive vascular invasion (OR = 2.995, 95% CI: 1.132-7.926, P = 0.027), positive tumor deposit (OR = 4.451, 95% CI: 1.153-17.179, P = 0.030), and linear (OR = 6.774, 95% CI: 1.306-35.135, P = 0.023) and nodal (OR = 8.762, 95% CI: 1.521-50.457, P = 0.015) pericolic fat infiltration patterns were independently associated with MLM (Table 2). There was no collinearity among the five variables (Figure S4).
Based on the five factors independently associated with MLM, a nomogram was developed for predicting MLM of CRC (Figure 2). The AUC of the ROC curve was 0.866 (95% CI: 0.803-0.914, P < 0.001) (Figure 3), meaning that the nomogram model had good predictive efficiency. The nomogram had 88.1% sensitivity, 74.5% specificity, 79.5% accuracy, 73.2% positive predictive value, and 82.9% negative predictive value. In addition, the calibration curve of the nomogram showed a satisfactory agreement between predicted and actual probability (Figure 4). Figure 5 shows the decision curve analysis.
Of the 161 patients in this study, 118 had available postoperative treatment records at our hospital (43 did not receive adjuvant therapy or received it in other hospitals). Among the 118 patients, the final TNM staging was II, III, and IV in 48, 66, and four. Regarding adjuvant therapy, 83 received FOLFOX, and 35 received CapeOx for 3-6 months. Five patients with rectal cancer received postoperative adjuvant chemotherapy and pelvic radiation therapy.
Discussion
The results showed that a nomogram prediction model based on age >66 years, N2 stage, positive vascular invasion, positive tumor deposit, and linear and nodal pericolic fat infiltration patterns might have favorable prediction performance for the progression of CRC to MLM. These findings may help clinicians identify patients with a high risk of MLM development after CRC resection and adjust the follow-up accordingly. The present study proposes a nomogram that can easily be used to predict MLM after CRC surgery based on readily available features.
Figure 1
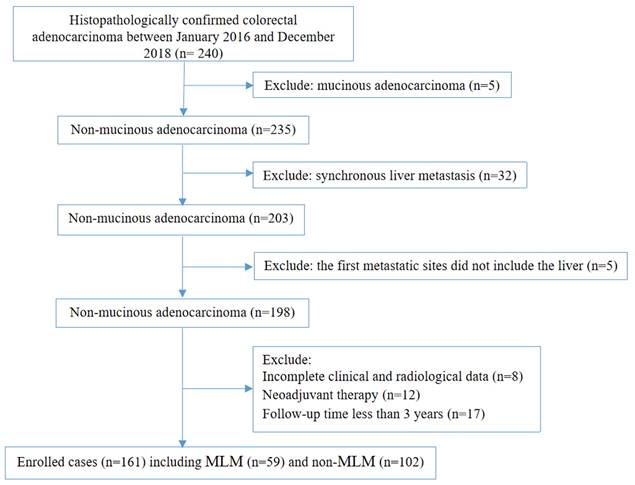
Flow chat of recruitment, inclusion, and exclusion.
Table 1
Basic characteristics.
| Variables | Without MLM (n=102) | With MLM (n=59) | χ2 | P |
|---|---|---|---|---|
| Sex, n (%) | 0.135 | 0.714 | ||
| Male | 54 (52.9) | 33 (55.9) | ||
| Female | 48 (47.1) | 26 (44.1) | ||
| Age, n (%) | 4.387 | 0.036 | ||
| ≤66 years | 64 (62.7) | 27 (45.8) | ||
| >66 years | 38 (37.3) | 32 (54.2) | ||
| Preoperative CEA levels (n=153) a, n (%) | 2.649 | 0.104 | ||
| ≤10 ng/ml | 71 (69.6) | 35 (59.3) | ||
| >10 ng/ml | 25 (24.5) | 22 (37.3) | ||
| Preoperative CA199 levels (n=150) b, n (%) | 0.335 | 0.563 | ||
| ≤37 U/ml | 88 (86.3) | 51 (86.4) | ||
| >37 U/ml | 6 (5.9) | 5 (8.5) | ||
| T stage, n (%) | 6.604 | 0.037 | ||
| T1-2 | 24 (23.5) | 7 (11.9) | ||
| T3 | 37 (36.3) | 33 (55.9) | ||
| T4 | 41 (40.2) | 19 (32.2) | ||
| N stage, n (%) | 33.184 | <0.001 | ||
| N0 | 71 (69.6) | 15 (25.4) | ||
| N1 | 26 (25.5) | 28 (47.5) | ||
| N2 | 5 (4.9) | 16 (27.1) | ||
| Vascular invasion, n (%) | 22.469 | <0.001 | ||
| No | 78 (76.5) | 23 (39.0) | ||
| Yes | 24 (23.5) | 36 (61.0) | ||
| Perineural invasion, n (%) | 1.807 | 0.179 | ||
| No | 79 (77.5) | 40 (67.8) | ||
| Yes | 23 (22.5) | 19 (32.2) | ||
| Differentiation grade, n (%) | 5.323 | 0.070 | ||
| Well-differentiated | 8 (7.8) | 1 (1.7) | ||
| Moderately differentiated | 77 (75.5) | 41 (69.5) | ||
| Poorly differentiated | 17 (16.7) | 17 (28.8) | ||
| Tumor deposits, n (%) | 27.528 | <0.001 | ||
| Yes | 12 (11.8) | 29 (49.2) | ||
| No | 90 (88.2) | 30 (50.8) | ||
| Maximal wall thickness, n (%) | 5.891 | 0.015 | ||
| ≤15 mm | 60 (58.8) | 23 (39.0) | ||
| >15 mm | 42 (41.2) | 36 (61.0) | ||
| Tumor shape, n (%) | 0.114 | 0.735 | ||
| Thicken | 88 (86.3) | 52 (88.1) | ||
| Polypoid or bulky | 14 (13.7) | 7 (11.9) | ||
| Enhancement pattern, n (%) | 10.606 | 0.005 | ||
| Homogeneous | 60 (58.8) | 19 (32.2) | ||
| Heterogeneous ≤50% | 28 (27.5) | 27 (48.5) | ||
| Heterogeneous >50% | 14 (13.7) | 13 (22.0) | ||
| Enhancement degree, n (%) c | 0.401 | 0.526 | ||
| Attenuation between the liver and muscle | 90 (88.2) | 50 (84.7) | ||
| Lower attenuation compared with the muscle | 12 (11.8) | 9 (15.3) | ||
| Colonic obstruction, n (%) | 5.197 | 0.023 | ||
| Yes | 17 (16.7) | 19 (32.2) | ||
| No | 85 (83.3) | 40 (67.8) | ||
| Pericolic fat infiltration, n (%) | 31.580 | <0.001 | ||
| Normal | 28 (27.5) | 3 (5.1) | ||
| Hazy | 37 (36.3) | 8 (13.6) | ||
| Linear | 23 (22.5) | 26 (44.1) | ||
| Nodular | 14 (13.7) | 22 (37.3) | ||
| Maximal size of regional lymph node, n (%) | 8.564 | 0.014 | ||
| <5 mm | 46 (45.1) | 19 (32.2) | ||
| 5-10 mm | 47 (46.1) | 25 (42.4) | ||
| >10 mm | 9 (8.8) | 15 (25.4) |
a 8 cases missing data; b 11 cases missing data; C no cases of higher attenuation than the liver. MLM: metachronous liver metastasis; CEA: carcinoembryonic antigen; CA: carbohydrate antigen.
Previous studies focused on the clinical and pathological factors that could predict MLM in CRC patients 7,8,11, but few studies included the CT imaging characteristics of the primary CRC to predict the development of MLM. Xiao et al. 22 constructed a model based on deep learning analysis of pathological images. None of these models included imaging features, while the present study did. Recent studies used radiomics to construct a model predicting MLM after CRC resection 23-26, but radiomics relies heavily on the software and local imaging parameters used for scanning. The naked eye cannot observe most radiomics features, and the external validity is generally limited 27. It is why it was decided to examine hard CT features in the present study.
Table 2
Univariable and multivariable logistic regression analysis of the risk features for postoperative liver metastasis
| Variables | Univariable logistic regression analysis | Multivariable logistic regression analysis | ||||
|---|---|---|---|---|---|---|
| OR | 95%CI | P | OR | 95%CI | P | |
| Sex | ||||||
| Females | Ref. | - | - | |||
| Males | 1.128 | 0.592, 2.149 | 0.714 | |||
| Age | ||||||
| ≤ 66 | Ref. | - | - | Ref. | - | - |
| >66 | 1.996 | 1.041, 3.826 | 0.036 | 3.471 | 1.272-9.473 | 0.015 |
| T stage | ||||||
| T1-2 | Ref. | - | - | Ref. | - | - |
| T3 | 3.058 | 1.166, 8.017 | 0.023 | 1.374 | 0.355-5.320 | 0.645 |
| T4 | 1.589 | 0.583, 4.329 | 0.365 | 0.531 | 0.125-2.253 | 0.391 |
| N stage | ||||||
| N0 | Ref. | - | - | Ref. | - | - |
| N1 | 5.097 | 2.357, 11.025 | < 0.001 | 1.726 | 0.479-6.217 | 0.404 |
| N2 | 15.147 | 4.804, 47.756 | < 0.001 | 6.534 | 1.456-29.317 | 0.014 |
| Vascular Invasion | ||||||
| No | Ref. | - | - | Ref. | - | - |
| Yes | 5.087 | 2.539, 10.193 | < 0.001 | 2.995 | 1.132-7.926 | 0.027 |
| Perineural Invasion | ||||||
| No | Ref. | - | - | |||
| Yes | 1.632 | 0.797, 3.341 | 0.179 | |||
| Differentiation grade | ||||||
| Well-differentiated | Ref. | - | - | |||
| Moderately differentiated | 4.260 | 0.515, 35.245 | 0.179 | |||
| Poorly differentiated | 8.000 | 0.900, 71.115 | 0.062 | |||
| Tumor shape | ||||||
| Polypoid or bulky | Ref. | - | - | |||
| Thicken | 0.846 | 0.321, 2.232 | 0.735 | |||
| Maximal Wall Thickness | ||||||
| ≤15 mm | Ref. | - | - | Ref. | - | - |
| >15 mm | 2.236 | 1.161, 4.305 | 0.015 | 0.774 | 0.250-2.401 | 0.658 |
| Enhancement Pattern of Tumor | ||||||
| Homogeneous | Ref. | - | - | Ref. | - | - |
| Heterogeneous<50% | 3.045 | 1.455, 6.374 | 0.003 | 4.017 | 1.102-13.207 | 0.056 |
| Heterogeneous>50% | 2.932 | 1.175, 7.317 | 0.021 | 3.318 | 0.856-12.864 | 0.083 |
| Enhancement degree | ||||||
| Lower attenuation compared with the muscle | Ref. | - | - | |||
| Attenuation between the liver and muscle | 1.350 | 0.532, 3.424 | 0.526 | |||
| Tumor Deposits | ||||||
| No | Ref. | - | - | Ref. | - | - |
| Yes | 7.250 | 3.292, 15.967 | <0.001 | 4.451 | 1.153-17.179 | 0.030 |
| Colonic Obstruction | ||||||
| No | Ref. | - | - | Ref. | - | - |
| Yes | 2.375 | 1.117, 5.051 | 0.023 | 2.127 | 0.703-6.438 | 0.182 |
| Pericolic Fat Infiltration | ||||||
| Normal | Ref. | - | - | Ref. | - | - |
| Hazy | 2.018 | 0.490, 8.306 | 0.331 | 1.177 | 0.221-6.269 | 0.848 |
| Linear | 10.551 | 2.829, 39.347 | < 0.001 | 6.774 | 1.306-35.135 | 0.023 |
| Nodular | 14.667 | 3.741, 57.503 | < 0.001 | 8.762 | 1.521-50.457 | 0.015 |
| Maximal Size of Regional Lymph Node | ||||||
| < 5 mm | Ref. | - | - | Ref. | - | - |
| 5-10mm | 1.288 | 0.626, 2.651 | 0.492 | 0.493 | 0.153-1.590 | 0.237 |
| > 10mm | 4.035 | 1.508, 10.796 | 0.005 | 0.514 | 0.110-2.414 | 0.399 |
| Carcinoembryonic antigen (CEA) | ||||||
| ≤ 10 ng/ml | Ref. | - | - | |||
| > 10 ng/ml | 1.785 | 0.885, 3.600 | 0.104 | |||
| Carbohydrate antigen 19-9 (CA19-9) | ||||||
| ≤ 37 U/ml | Ref. | - | - | |||
| > 37 U/ml | 1.438 | 0.418, 4.949 | 0.563 | |||
Figure 2
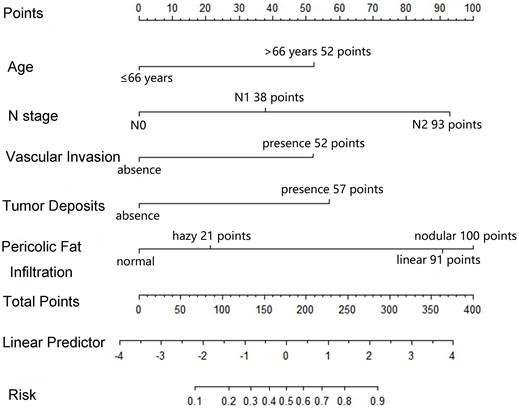
Nomogram for predicting the development of MLM. For each variable, a vertical line is drawn from the value to the upper “Points” axis to determine the score of each variable. Then, the scores are added together, and a vertical line is drawn from the “Total Points” axis to the “Risk” axis to determine the risk of MLM.
Figure 3
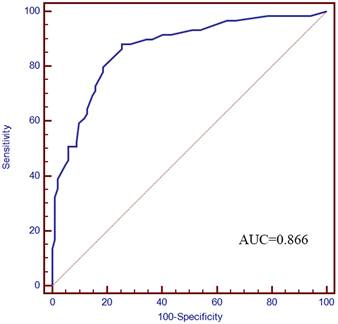
ROC curve. The AUC was 0.866 (95% CI: 0.803-0.914).
Age and CEA have been confirmed to be important clinical risk factors for developing MLM of CRC 7,8,11. The present study demonstrated that age was independently associated with the development of MLM. Previous studies reported the association between preoperative serum CEA levels and LM, prognosis, and recurrence of patients with CRC 7,8,11. Generally, increased serum CEA levels before surgery have been related to MLM of CRC 28,29. Nevertheless, preoperative serum CEA was not associated with MLM in the univariable logistic regression analysis, which might be because serum CEA levels are influenced by several factors 28,29, including tumor size, tumor CEA contents, CEA production rates, tumor location, and the rate of CEA elimination 29-31, and their results contradict the suggestion that CEA levels increase with more advancing stages of CRC.
Figure 4
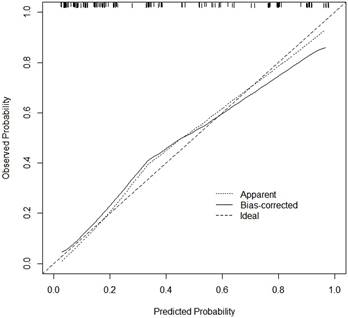
Calibration curve of the nomogram. The x-axis represents the predicted MLM probability. The y-axis represents the actual diagnosed MLM probability.
Figure 5
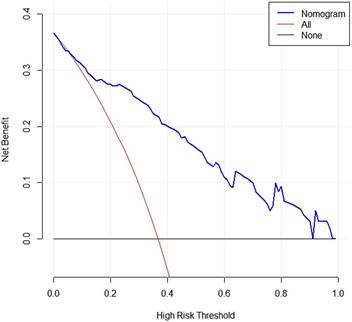
DCA curve of the nomogram. When the risk threshold probability is >1% and <91%, using this nomogram to identify MLM could achieve a net clinical beneft.
Previous studies reported that pathological factors such as higher T stage, positive N stage, and positive vascular invasion were associated with MLM of CRC 7-11. A higher T stage means that the tumor cells infiltrate the intestinal wall deeper, resulting in a higher probability of infiltration of blood vessels and lymphatic vessels and a higher risk of distant metastasis. In the multivariable logistic regression analysis, the N2 stage and positive vascular invasion were independently associated with MLM. In contrast, the T stage was associated with the univariable analysis but not the multivariable one. The limited sample size could explain these results. In this study, 23% of the patients with the T1-2 stage (n = 7), 47% of the patients with the T3 stage (n = 33), and 32% of the patients with the T4 stage (n = 19) developed MLM.
Tumor deposits are defined as discrete tumor nodules without histologic evidence of a residual LN identified in the pericolic or perirectal tissue away from the leading edge of the tumor 32. In the latest 7th and 8th editions of the American Joint Committee on Cancer (AJCC) TNM staging system, if there is a positive tumor deposit but no concurrent LN metastasis, the N stage should be categorized as the N1c stage 32. Positive tumor deposits are associated with recurrence, metastasis, and poorer survival outcomes in CRC patients 33-35. In the present study, positive tumor deposit was independently associated with the development of MLM by multivariable logistic regression analysis. In line with this result, Wu et al. 33 retrospectively analyzed two large independent cohorts of patients with CRC and showed that tumor deposits were an independent predictor of liver metastasis (OR: 4.662, CI:2.743-7.923). For CRC patients whose postoperative pathological results suggest the presence of positive tumor deposits, more rigorous follow-up might be needed.
Current studies on predicting MLM of CRC based on imaging of liver parenchyma or primary tumor are rare. Beckers et al. 24,25 analyzed the CT images of the liver parenchyma of patients with CRC based on texture analysis and got limited results. Indeed, uniformity had the potential to predict LM during the first postoperative 6 months but not beyond 6 months 25. In addition, there were no additional effects found for texture assessment on a segmental level 24. Still, several factors may influence imaging measurement of the liver parenchyma 25. On the other hand, the imaging characteristics of the primary CRC tumor are often less affected and more stable than liver parenchyma 14. After multivariable logistic regression analysis, the pericolic fat infiltration pattern was considered the most important predictor in the nomogram model. The linear and nodular patterns also indicated a higher risk of MLM. The explanation might be that the linear and nodular patterns are associated with deeper infiltration, resulting in more vascular invasion and LN metastasis. Previous studies reported that pericolic fat infiltration was correlated with the pathological variables of CRC 12,36,37. A study by Kim et al. 12 reported that PD colorectal adenocarcinoma demonstrated significantly more nodular pericolic fat infiltration than WD or MD. Sa et al. 36 analyzed the correlation between the T stage of CRC and nine CT imaging characteristics. Six CT variables, including pericolic fat infiltration, were positively correlated with the T stage. Zeina et al. 37 quantitatively analyzed the pericolic fat, including the maximal distance between tumor margins and normally appearing mesenteric fat and mean CT values of pericolic fat adjacent to the tumor. They found that the overall sensitivity, specificity, and accuracy of pericolic fat infiltration in detecting patients with ≥T3 stage were 95%, 20%, and 81.9%. Still, Ng et al. 38 reported that abnormal pericolic fat features were not a precise indicator of the extramuscular extension of the tumor. Therefore, the pericolic fat infiltration pattern of the primary CRC tumor, especially linear and nodular patterns, might help predict the development of MLM.
There were some limitations in this study. Firstly, the sample size was limited. Secondly, all patients were followed up for at least 3 years, but the follow-up was relatively short (<5 years). Therefore, it is possible that a longer follow-up would yield more cases of MLM. Furthermore, patients with advanced CRC generally receive chemotherapy after surgery, and the development of MLM might be affected by chemotherapy. It will have to be considered in future larger studies. Thirdly, although the nomogram showed good predictive efficiency, this study only used internal data. External validity remains to be evaluated. Fourthly, there are some molecular tumor markers, such as KRAS, NRAS, and BRAF, that might have promising relevance between LM and their positive value 39,40, but it was impossible to collect these data in the present study because those biomarkers were not performed in all cases during the study period. Fifthly, the CT features analyzed in this study were based on the features by Kim et al. 12 and Eurboonyanun et al. 13, including basic morphological and enhancement characteristics, but they might not be comprehensive enough. Other detailed CT features of primary CRC should be examined in the future.
Conclusion
This study established a nomogram model for predicting the risk of MLM development in patients with CRC based on clinical and pathological features (age, N stage, vascular invasion, and tumor deposits) and a radiological feature (pericolic fat infiltration pattern) with good calibration and good predictive efficiency. This model might help clinicians identify patients with a high risk of MLM development after CRC resection and adjust the follow-up accordingly.
Supplementary Material
Supplementary figures and tables.
Acknowledgements
Funding
This work was supported by the Suzhou Clinical Special Disease Diagnosis and Treatment Program (LCZX202346), Suzhou GuSu Medical Talent Project (GSWS2019077, GSWS2020108 and GSWS2022100), Suzhou Science and Technology Development Program (SYS2020058), and Changshu Science and Technology Development Program (CS202029).
Ethics approval and consent to participate
This study was approved by the Ethics Committee of Changshu No.1 People's Hospital (approval #(2020) LUN No. 012). The first author, Zhihua Lu, originally worked in the Changshu No.1 People's Hospital and was transferred to Dushu Lake Hospital Affiliated to Soochow University, after completing the project. The study was conducted in accordance with the Declaration of Helsinki. The requirement for individual informed consent was waived by the board.
Author contributions
Zhihua Lu and Jinbing Sun carried out the studies, participated in collecting data, performed the statistical analysis, and drafted the manuscript. Mi Wang and Heng Jiang participated in collecting data. Guangqiang Chen and Weiguo Zhang participated in the acquisition, analysis, or interpretation of data. All authors read and approved the final manuscript.
Competing Interests
The authors have declared that no competing interest exists.
References
1. Sung H, Ferlay J, Siegel RL. et al. Global Cancer Statistics 2020: GLOBOCAN Estimates of Incidence and Mortality Worldwide for 36 Cancers in 185 Countries. CA Cancer J Clin. 2021;71:209-49
2. Siegel RL, Miller KD, Goding Sauer A. et al. Colorectal cancer statistics, 2020. CA Cancer J Clin. 2020;70:145-64
3. Cervantes A, Adam R, Rosello S. et al. Metastatic colorectal cancer: ESMO Clinical Practice Guideline for diagnosis, treatment and follow-up. Ann Oncol. 2023;34:10-32
4. Okholm C, Mollerup TK, Schultz NA, Strandby RB, Achiam MP. Synchronous and metachronous liver metastases in patients with colorectal cancer. Dan Med J. 2018 65
5. Reboux N, Jooste V, Goungounga J, Robaszkiewicz M, Nousbaum JB, Bouvier AM. Incidence and Survival in Synchronous and Metachronous Liver Metastases From Colorectal Cancer. JAMA Netw Open. 2022;5:e2236666
6. Bartolini I, Ringressi MN, Melli F. et al. Analysis of Prognostic Factors for Resected Synchronous and Metachronous Liver Metastases from Colorectal Cancer. Gastroenterol Res Pract. 2018;2018:5353727
7. Hao M, Li H, Wang K, Liu Y, Liang X, Ding L. Predicting metachronous liver metastasis in patients with colorectal cancer: development and assessment of a new nomogram. World J Surg Oncol. 2022;20:80
8. Mo S, Cai X, Zhou Z. et al. Nomograms for predicting specific distant metastatic sites and overall survival of colorectal cancer patients: A large population-based real-world study. Clin Transl Med. 2020;10:169-81
9. Filip S, Vymetalkova V, Petera J. et al. Distant Metastasis in Colorectal Cancer Patients-Do We Have New Predicting Clinicopathological and Molecular Biomarkers? A Comprehensive Review. Int J Mol Sci. 2020 21
10. Leijssen LGJ, Dinaux AM, Amri R. et al. Impact of intramural and extramural vascular invasion on stage II-III colon cancer outcomes. J Surg Oncol. 2019;119:749-57
11. Chuang SC, Su YC, Lu CY. et al. Risk factors for the development of metachronous liver metastasis in colorectal cancer patients after curative resection. World J Surg. 2011;35:424-9
12. Kim JE, Lee JM, Baek JH. et al. Differentiation of poorly differentiated colorectal adenocarcinomas from well- or moderately differentiated colorectal adenocarcinomas at contrast-enhanced multidetector CT. Abdom Imaging. 2015;40:1-10
13. Eurboonyanun K, Lahoud RM, Kordbacheh H. et al. Imaging predictors of BRAF mutation in colorectal cancer. Abdom Radiol (NY). 2020;45:2336-44
14. Liang M, Cai Z, Zhang H. et al. Machine Learning-based Analysis of Rectal Cancer MRI Radiomics for Prediction of Metachronous Liver Metastasis. Acad Radiol. 2019;26:1495-504
15. Amin MB, Edge SB, Greene FL. et al. Meyer: AJCC Cancer Staging Manual. 8th ed. Springer International Publishing, Basel (2017).
16. Angelsen JH, Horn A, Sorbye H, Eide GE, Loes IM, Viste A. Population-based study on resection rates and survival in patients with colorectal liver metastasis in Norway. Br J Surg. 2017;104:580-9
17. Hackl C, Neumann P, Gerken M, Loss M, Klinkhammer-Schalke M, Schlitt HJ. Treatment of colorectal liver metastases in Germany: a ten-year population-based analysis of 5772 cases of primary colorectal adenocarcinoma. BMC Cancer. 2014;14:810
18. Ng WW, Cheung YS, Wong J, Lee KF, Lai PB. A preliminary analysis of combined liver resection with new chemotherapy for synchronous and metachronous colorectal liver metastasis. Asian J Surg. 2009;32:189-97
19. Engstrand J, Stromberg C, Nilsson H, Freedman J, Jonas E. Synchronous and metachronous liver metastases in patients with colorectal cancer-towards a clinically relevant definition. World J Surg Oncol. 2019;17:228
20. [China guideline for diagnosis and comprehensive treatment of colorectal liver metastases (version 2020)]. Zhonghua Wei Chang Wai Ke Za Zhi 2021;24:1-13
21. SB E, DR B, CC C. Colon and rectum. In: Edge SB, editor. AJCC cancer staging manual, 7th edn. New York: Springer. 2010:143-56
22. Xiao C, Zhou M, Yang X. et al. Accurate Prediction of Metachronous Liver Metastasis in Stage I-III Colorectal Cancer Patients Using Deep Learning With Digital Pathological Images. Front Oncol. 2022;12:844067
23. Li Y, Gong J, Shen X. et al. Assessment of Primary Colorectal Cancer CT Radiomics to Predict Metachronous Liver Metastasis. Front Oncol. 2022;12:861892
24. Beckers RCJ, Beets-Tan RGH, Schnerr RS. et al. Whole-volume vs. segmental CT texture analysis of the liver to assess metachronous colorectal liver metastases. Abdom Radiol (NY). 2017;42:2639-45
25. Beckers RCJ, Lambregts DMJ, Schnerr RS. et al. Whole liver CT texture analysis to predict the development of colorectal liver metastases-A multicentre study. Eur J Radiol. 2017;92:64-71
26. Li ZF, Kang LQ, Liu FH. et al. Radiomics based on preoperative rectal cancer MRI to predict the metachronous liver metastasis. Abdom Radiol (NY). 2023;48:833-43
27. Yip SS, Aerts HJ. Applications and limitations of radiomics. Phys Med Biol. 2016;61:R150-66
28. Li M, Li JY, Zhao AL. et al. Comparison of carcinoembryonic antigen prognostic value in serum and tumour tissue of patients with colorectal cancer. Colorectal Dis. 2009;11:276-81
29. Pakdel A, Malekzadeh M, Naghibalhossaini F. The association between preoperative serum CEA concentrations and synchronous liver metastasis in colorectal cancer patients. Cancer Biomark. 2016;16:245-52
30. Huang SC, Lin JK, Lin TC. et al. Concordance of Carcinoembryonic Antigen Ratio and Response Evaluation Criteria in Solid Tumors as Prognostic Surrogate Indicators of Metastatic Colorectal Cancer Patients Treated with Chemotherapy. Ann Surg Oncol. 2015;22:2262-8
31. Ding Y, Xuan W, Chen C. et al. Differences in carcinoembryonic antigen levels between colon and rectal cancer. Mol Clin Oncol. 2014;2:618-22
32. Jin M, Frankel WL. Lymph Node Metastasis in Colorectal Cancer. Surg Oncol Clin N Am. 2018;27:401-12
33. Wu W, Zeng S, Zhang X. et al. The value of tumor deposits in evaluating colorectal cancer survival and metastasis: a population-based retrospective cohort study. World J Surg Oncol. 2022;20:41
34. Wu WX, Zhang DK, Chen SX. et al. Prognostic impact of tumor deposits on overall survival in colorectal cancer: Based on Surveillance, Epidemiology, and End Results database. World J Gastrointest Oncol. 2022;14:1699-710
35. Liu F, Zhao J, Li C. et al. The unique prognostic characteristics of tumor deposits in colorectal cancer patients. Ann Transl Med. 2019;7:769
36. Sa S, Li J, Li X. et al. Development and validation of a preoperative prediction model for colorectal cancer T-staging based on MDCT images and clinical information. Oncotarget. 2017;8:55308-18
37. Zeina AR, Mahamid A, Walid S, Nachtigal A, Shapira-Rootman M. The diagnostic accuracy of pericolonic fat extension and attenuation for colorectal tumors. Eur J Radiol. 2015;84:1724-8
38. Ng CS, Doyle TC, Dixon AK, Miller R, Arends MJ. Histopathological correlates of abnormal pericolic fat on CT in the assessment of colorectal carcinoma. Br J Radiol. 2002;75:31-7
39. Govindarajan A, Paty PB. Predictive markers of colorectal cancer liver metastases. Future Oncol. 2011;7:299-307
40. Barbon C, Margonis GA, Andreatos N. et al. Colorectal Liver Metastases: Does the Future of Precision Medicine Lie in Genetic Testing? J Gastrointest Surg. 2018;22:1286-96
Author contact
![]() Corresponding author: Zhihua Lu. Department of Radiology, Dushu Lake Hospital Affiliated to Soochow University, Medical Center of Soochow University, Suzhou Dushu Lake Hospital, Suzhou, Jiangsu, 215123, China. E-mail: luzhihua4100edu.cn. TEL: +86-13862326176.
Corresponding author: Zhihua Lu. Department of Radiology, Dushu Lake Hospital Affiliated to Soochow University, Medical Center of Soochow University, Suzhou Dushu Lake Hospital, Suzhou, Jiangsu, 215123, China. E-mail: luzhihua4100edu.cn. TEL: +86-13862326176.
Citation styles
APA
Lu, Z., Sun, J., Wang, M., Jiang, H., Chen, G., Zhang, W. (2024). A nomogram prediction model based on clinicopathological combined radiological features for metachronous liver metastasis of colorectal cancer. Journal of Cancer, 15(4), 916-925. https://doi.org/10.7150/jca.88778.
ACS
Lu, Z.; Sun, J.; Wang, M.; Jiang, H.; Chen, G.; Zhang, W. A nomogram prediction model based on clinicopathological combined radiological features for metachronous liver metastasis of colorectal cancer. J. Cancer 2024, 15 (4), 916-925. DOI: 10.7150/jca.88778.
NLM
Lu Z, Sun J, Wang M, Jiang H, Chen G, Zhang W. A nomogram prediction model based on clinicopathological combined radiological features for metachronous liver metastasis of colorectal cancer. J Cancer 2024; 15(4):916-925. doi:10.7150/jca.88778. https://www.jcancer.org/v15p0916.htm
CSE
Lu Z, Sun J, Wang M, Jiang H, Chen G, Zhang W. 2024. A nomogram prediction model based on clinicopathological combined radiological features for metachronous liver metastasis of colorectal cancer. J Cancer. 15(4):916-925.
This is an open access article distributed under the terms of the Creative Commons Attribution License (https://creativecommons.org/licenses/by/4.0/). See http://ivyspring.com/terms for full terms and conditions.