Journal of Cancer
ISSN: 1837-9664
3.2
Impact Factor
ISSN: 1837-9664

 Global reach, higher impact
J Cancer 2024; 15(11):3284-3296. doi:10.7150/jca.95757 This issue Cite
Research Paper
Identification of crucial genes through WGCNA in the progression of gastric cancer
Rui Liu1,2,†, Jie Liu3,4,5,†, Qiang Cao6,†, Yanpeng Chu5,7,†, Hao Chi3,4, Jun Zhang5, Jiangping Fu8, Tianchi Zhang5, Linguang Fan5, Chaozhong Liang5, Xiufang Luo9, ![]() , Xiaoli Yang3,4,
, Xiaoli Yang3,4, ![]() , Bo Li3,4,
, Bo Li3,4, ![]()
1. Vascular surgery Department, The Affiliated Hospital of Southwest Medical University, Lu Zhou, China.
2. Department of gastrointestinal surgery, Meishan People 's Hospital, Meishan, China.
3. Department of General Surgery (Hepatopancreatobiliary Surgery), The Affiliated Hospital of Southwest Medical University, Sichuan, China.
4. Academician (Expert) Workstation of Sichuan Province, Metabolic Hepatobiliary and Pancreatic Diseases Key Laboratory of Luzhou City, The Affiliated Hospital of Southwest Medical University, Sichuan, China.
5. Department of general surgery, Dazhou Central Hospital, Dazhou, China.
6. School of Medicine, Macau University of Science and Technology, 999078, Macau, China.
7. Medical College, Sichuan University of Arts and Science, Dazhou, China.
8. Oncology department, Dazhou Central Hospital, Dazhou, China.
9. Geriatric department, Dazhou Central Hospital, Dazhou, China.
†These authors have contributed equally to this work.
Received 2024-2-27; Accepted 2024-4-11; Published 2024-4-23
Citation:
Liu R, Liu J, Cao Q, Chu Y, Chi H, Zhang J, Fu J, Zhang T, Fan L, Liang C, Luo X, Yang X, Li B. Identification of crucial genes through WGCNA in the progression of gastric cancer. J Cancer 2024; 15(11):3284-3296. doi:10.7150/jca.95757. https://www.jcancer.org/v15p3284.htm
Other stylesAbstract

Background: To explore the hub gene closely related to the progression of gastric cancer (GC), so as to provide a theoretical basis for revealing the therapeutic mechanism of GC.
Methods: The gene expression profile and clinical data of GSE15459 in Gene Expression Omnibus (GEO) database were downloaded. The weighted gene co-expression network analysis (WGCNA) was used to screen the key modules related to GC progression. Survival analysis was used to assess the influence of hub genes on patients' outcomes. CIBERSORT analysis was used to predict the tissue infiltrating immune cells in patients. Immunohistochemical staining was conducted to further verify the expression of hub genes.
Results: Through WGCNA, a total of 26 co-expression modules were constructed, in which salmon module and royalblue module had strong correlation with GC progression. The results of enrichment analysis showed that genes in the two modules were mainly involved in toll-like receptor signaling pathway, cholesterol metabolism and neuroactive ligand-receptor interaction. Six hub genes (C1QA, C1QB, C1QC, FCER1G, FPR3 and TYROBP) related to GC progression were screened. Survival analysis showed overall survival in the high expression group was significantly lower than that in the low expression group. CIBERSORT analysis revealed that immune characteristics difference between patients in early stage and advanced stage. Immunohistochemical results confirmed that C1QB, FCER1G, FPR3 and TYROBP were significantly associated with disease progression in GC.
Conclusion: Our study identified that C1QB, FCER1G, FPR3 and TYROBP played important roles in the progression of GC, and their specific mechanisms are worth further study.
Keywords: Gastric cancer, Tumor progression, WGCNA, Hub gene, Immunohistochemistry
1. Introduction
Gastric cancer (GC) is the fifth most common cancer in the world, with more than one million new cases occurring every year. The early symptoms of GC are not obvious, and about 50% of GC patients are already in the advanced stage when they are found, thus losing the best opportunity for surgical treatment. As GC is often diagnosed at an advanced stage, it has a high mortality rate, making it the third leading cause of cancer-related deaths, with 768,793 deaths worldwide in 2020 [1]. However, 25-40% of patients with treated GC will have recurrence and metastasis due to tumor heterogeneity [2], which is a major challenge in the treatment of GC.
GC is a heterogeneous disease with high histological and molecular diversity and a complex genomic landscape, thus challenging the definition of clinical and therapeutic strategies [2]. To date, there is no gold standard therapy for GC, and the treatment options are mainly based on the stage of disease and/or the presence of biomarkers. For the early-stage disease, surgery is the only curative approach in the treatment of GC. A large-scale study has demonstrated that the addition of chemotherapy in stage II and III patients can add a survival benefit compared to surgery alone [3]. Targeted therapies for GC are anti-human epidermal growth factor receptor 2 (HER2) and anti-vascular therapy [4]. Noteworthily, due to the known heterogeneity of GC cases, only specific subpopulations of GC would benefit from immune therapy [5]. Although various treatments such as radiotherapy and chemotherapy, neoadjuvant chemotherapy and immunotherapy can prolong the survival of patients to a certain extent, it is still difficult to significantly improve the overall survival rate of patients with advanced GC [6, 7]. Therefore, in-depth exploration of the molecular mechanism of GC metastasis and the search for molecular targets in the process of cancer metastasis and invasion are of significant clinical significance for the control of GC metastasis and the development of targeted therapeutic drugs.
Although many excellent algorithms have been proposed for the study of important molecules [8, 9], in the current study, we conducted a comprehensive bioinformatics analysis between early-stage GC tissues and advanced stage GC tissues via weighted gene co-expression network analysis (WGCNA) [10, 11]. And hub genes identification, biological processes and tumor immune status were determined based on comprehensive bioinformatics analyses. The relationship between hub genes and patient outcomes was also investigated. Finally, we validated the expression of the hub gene in our cohort by immunohistochemistry (IHC).
2. Materials and Methods
2.1 Data acquisition
The GC-related expression profiling by array data (GSE15459) and clinical information were downloaded from the Gene Expression Omnibus (GEO) database (https://www.ncbi.nlm.nih.gov/geo/). The data set included 192 primary tumor tissues from GC patients with an average age of 64.37 (23.4-92.4) years, and 125 patients were male and 67 patients were female. Among them, 31 patients were in stage 1, 29 patients were in stage 2, 72 patients were in stage 3 and 60 patients were in stage 4 at the time of surgery, respectively. The annotation information of GSE15459 was obtained through GPL570 [HG-U133_Plus_2] Affymetrix Human Genome U133 Plus 2.0 Array. After obtaining the gene expression matrix of GSE15459, the gene without gene name was deleted by comparing with the micro-array annotation information table. For the repeated genes in the matrix, the genes with the largest total sample mean were retained for subsequent analysis.
2.2 Weighted gene co-expression network analysis (WGCNA)
The “WGCNA” package of R (version: 3.6.3) was used to construct the co-expression network. Hierarchical clustering analysis was performed in the gene expression data of 192 GC samples to identify outliers. The R function “pickSoftThreshold” was applied to screen the appropriate soft threshold power β for standard scale free network establishment. In this study, the soft threshold was set to 10. The weighted adjacency matrix is transformed into a topological overlap metric matrix (TOM) to estimate its connectivity in the network. The clustering tree of TOM matrix was constructed by using the average link hierarchical clustering method. In this study, the minimum gene module size was set to 30 to obtain the appropriate module, and the threshold for merging similar modules was set to 0.25. The gene significance (GS) and module membership (MM) were calculated to relate modules to clinical traits. For the identified modules, the important modules that need further analysis were determined according to their correlation coefficients r and P values.
2.3 Gene Ontology (GO) and Kyoto Encyclopedia of Genes and Genomes (KEGG) pathways enrichment analysis
GO functional enrichment analysis and KEGG enrichment analysis were performed on the genes in the key modules related to GC progression using online STRING (https://string-db.org/). The false discovery rate ≤ 0.05 indicated that the enrichment results were statistically significant. The results of GO analysis mainly studied the related pathways of enrichment of these genes in biological processes, molecular functions and cellular components. The results of GO and KEGG were visualized by using the “ggplot2” package of R software. The results of top 10 in each GO terms of GO analysis were presented in the form of bar chart, and the enrichment results of KEGG were presented in the form of bubble chart.
2.4 Hub gene identification and survival analysis
The GS and MM values in the key gene module of GC were calculated respectively, and the key genes in the key module were screened according to the screening criteria recommended by the WGCNA official website (|MM| > 0.8 & |GS| > 0.2). The selected key genes were further subjected to expression analysis in the GEPIA (http://gepia.cancer-pku.cn/; Match TCGA normal and GTEx data) database to find genes significantly related to different stages of GC patients for subsequent verification. Meanwhile, Kaplan-Meier survival analysis followed by log-rank test was performed to evaluate the impact of hub genes on the prognosis of patients.
2.5 Gene Set Enrichment Analysis (GSEA) of hub genes
To study the potential function of hub genes, the “clusterProfiler” package of R was applied to perform GSEA analysis. The samples were divided into two groups according to the median expression of hub genes, and the h.all.v7.4.entrez.gmt was chosen for analysis. The “ggplot2” package was used to visualize the significant functional pathways involved in hub genes. And specific pathways were visualized with “enrichplot” package.
2.6 Evaluation of tissue infiltrating immune cells
The CIBERSORT deconvolution algorithm was employed to predict the immune cell fractions in GSE15459 datasets based on gene expression profiles, according to the known reference set LM22 (leukocyte signature matrix) [12]. The relationship of hub genes and tissue infiltrating immune cells were assessed via the method of Spearman analysis.
2.7 Immunohistochemical validation of hub genes
In this study, 20 patients with GC who were surgically removed between March 2022 and May 2022 from Dazhou Central Hospital were collected in accordance with the policy of the Ethics Committee of the Dazhou Central Hospital (No. 2022032). According to the tumor-node-metastasis (TNM) cancer staging system of the American Joint Committee on Cancer (Version 8), 10 patients were in early stage (with a mean age of 68.3; 60% were male) and 10 patients were in advanced stage (with a mean age of 68.7; 50% were male). The detailed demographic information of the patients is provided in Supplementary File 1. Tumor tissues were fixed with 4% paraformaldehyde, embedded in paraffin and sliced into 4 μm-thick sections following a standard protocol. C1QA monoclonal antibody (1:100, Cat.67063-1-Ig, Proteintech), C1QB rabbit pAb (1:100, Cat.382301, ZENBI0), C1QC polyclonal antibody (1:100, Cat.16889-1-AP, Proteintech), Anti-FPR3 (1:100, Cat.ab188785, abcam), DAP12 (TYROBP) rabbit pAb (1:100, Cat.383147, ZENBI0) and FCER1G (1:100, Cat.CQA4448, Cohesion) were used as primary antibodies, and working solution form Dako REAL™ EnVision™ test (Cat.K5007) were as secondary antibody. The tissue samples of two patients had been detached in the experiment, and the final experimental results could not be obtained. Therefore, only 9 patients in each group were included in the final immunohistochemical analysis. The results of the statistical analysis of IHC were performed by Aperio ImageScope software (Vista, CA, USA) and the difference was compared based on H-score.
3. Results
3.1 Construction of weighted gene co-expression network and key gene modules identification
Patients with different stages have significantly different prognosis, and in general, the earlier the stage (Early stage included stage 1 and stage 2 patients, advanced stage included stage 3 and stage 4 patients), the better the prognosis (Supplementary Figure 1). After preprocessing GSE15459 data, the expression matrix containing 21,653 genes was finally obtained for analysis. The average clustering method was used to cluster 192 samples. The height of clustering was set to 5e+5 (marked by red line) (Supplementary Figure 2A), and the abnormal sample GSM387791 was deleted according to the clustering tree. After removing the abnormal sample, sample clustering containing corresponding sample information was obtained for subsequent WGCNA analysis (Supplementary Figure 2B). Through the establishment of a scale-free network, gene modules highly related to disease stage were screened, and the soft threshold was selected as 10 (R2 = 0.95), and the modules were finally determined (non-clustering modules were gray) (Supplementary Figure 3). Finally, 26 gene modules were identified, among which 7 modules were significantly correlated with tumor stage in GC. ME-salmon (r=0.186, P=0.01) and ME-royalblue (r=-0.19, P=0.009) were selected as the modules with the largest correlation coefficient with tumor stage, which contained 164 genes (Figure 1).
Figure 1
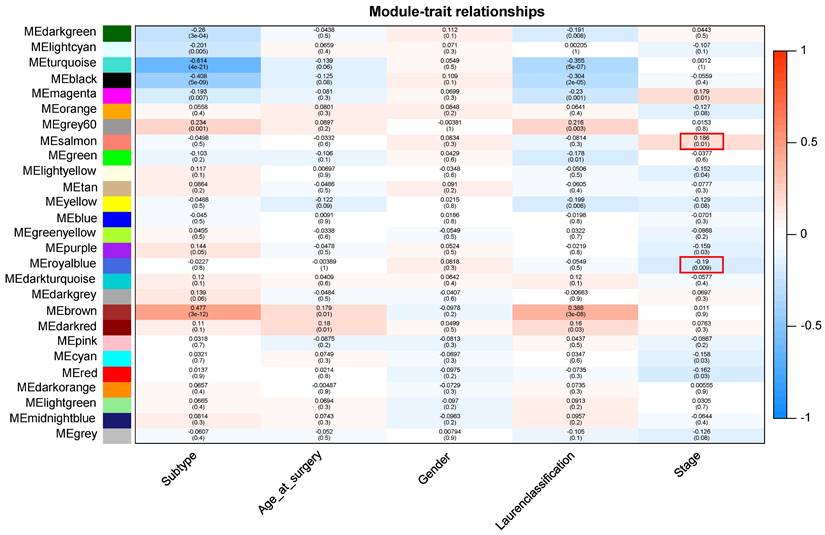
Module-trait relationship. Each row indicates a module eigengene and each column indicates a trait.
3.2 Gene function and pathway enrichment analysis
GO and KEGG enrichment analysis of 164 genes in salmon and royalblue modules to gain insight into biological significance of these genes. The results showed that GO functional annotation significantly enriched 360 biological process items, 47 cellular component items and 21 molecular function items (Detailed GO terms were in supplementary file 2). All significant molecular functions, cellular component, and top 10 biological processes are shown in bar charts in Figure 2A, mainly involved in Integral component of membrane, Signaling receptor activity, Immune response. Genes in the KEGG pathway enrichment analysis module were significantly enriched in 19 pathways, including Toll-like receptor signaling pathway, Neuroactive ligand-receptor interaction, Lysosome, Gastric acid secretion, Cholesterol metabolism (Figure 2B).
3.3 Identification and function analysis of hub genes
Fourteen hub genes were identified from the salmon and royalblue modules by setting the screening criteria of |MM| > 0.8 and |GS|> 0.2 (Figure 3A-B). The difference analysis results further demonstrated that C1QA, C1QB, C1QC, C3AR1, CD14, FCER1G, FCGR1B, FCGR2A, FPR3, HAVCR2, LAIR1 and TYROBP were significantly over-expressed in advanced patients, while FBXL13 and TMED6 were significantly over-expressed in early patients (Figure 3C). The GEPIA database was further used to analyze these genes and it was found that 12 genes except for FCGR1B and FBXL13 were significantly different between GC tissues and normal tissues (P<0.05). Among the 12 genes, C1QA, C1QB, C1QC, FCER1G, FPR3, HAVCR2, LAIR1 and TYROBP displayed obvious differences in different stages (P<0.05) (Supplementary Figure 4). According to the median expression of genes, those below this value are low-expression groups, and those above this value are high-expression groups. Kaplan-Meier survival analysis in GSE15459 cohort further indicated that the C1QA (HR=1.510, P=0.0472), C1QB (HR=1.765, P=0.0064), C1QC (HR=1.723, P=0.0091), FCER1G (HR=1.593, P=0.0248), FPR3 (HR=1.613, P=0.0215) and TYROBP (HR=1.654, P=0.0148) were significantly associated with overall survival of GC (Figure 4, Supplementary Figure 5). GSEA was performed to identify the functional enrichment of the above high expression genes and above low expression genes respectively (Figure 5). HALLMARK enrichment term exhibited that high expression of C1QA was mainly associated with interferon alpha response activation and oxidative phosphorylation suppression, high expression of C1QB, C1QC, FCER1G and FPR3 were all mainly associated with interferon gamma (INFγ) response activation and oxidative phosphorylation suppression, and high expression of TYROBP was mainly associated with epithelial mesenchymal transition activation and oxidative phosphorylation suppression (Figure 5A). These results suggested that these genes played a major role in INFγ response activation (Figure 5B) and oxidative phosphorylation suppression (Figure 5C).
3.4 Differences in immune characteristics between early and advanced stage
CIBERSORT analysis revealed that patients in early stage had significantly lower levels of T cells follicular helper, macrophages M1, and macrophages M2 than those in advanced stage. However, the levels of B cell naive, T cells CD4 memory resting, and NK cells resting were significantly higher than those in advanced stage (Figure 6A-B). The correlations between the 6 hub genes and immune cell types were also calculated for all patients (Figure 6C). Among the significant difference immune cell types, all six hub genes were significantly positive with macrophages M2, significantly negative with T cells CD4 memory resting, and NK cells resting. C1QA, C1QB, C1QC, FCER1G and FPR3 were significantly positive with macrophages M1.
3.5 Immunohistochemistry validation of hub genes
To verify the bioinformatics results, IHC experiments were further conducted. The results revealed that the protein expression levels of C1QB (P=0.024), FCER1G (P=0.019), FPR3 (P=0.024) and TYROBP (P=0.038) were significantly higher in the advanced stage group. The difference in the C1QA (P=0.354) and C1QC (P=0.402) expression between the two groups was not statistically significant (Figure 7). These finding indicated that the results of data mining were reliable and had potential research value.
4. Discussion
GC remains one of the world's most malignant cancers with heterogeneous characteristics. Although some studies have explored molecular and function related to its pathogenesis, diagnosis and prognosis, they are not sufficient to elucidate GC clearly. Therefore, we performed WGCNA analysis, GO and KEGG enrichment analysis, GSEA analysis through GC-related data in the GEO database, and through OS analysis, TCGA database analysis and IHC verification, we found that C1QB, FCER1G, FPR3 and TYROBP may be the core genes for the occurrence and development of GC, and their mechanism of action may involve toll-like receptor signaling pathway, neuroactive ligand-receptor interaction, lysosome, gastric acid secretion, cholesterol metabolism, INFγ response activation and oxidative phosphorylation suppression.
Figure 2
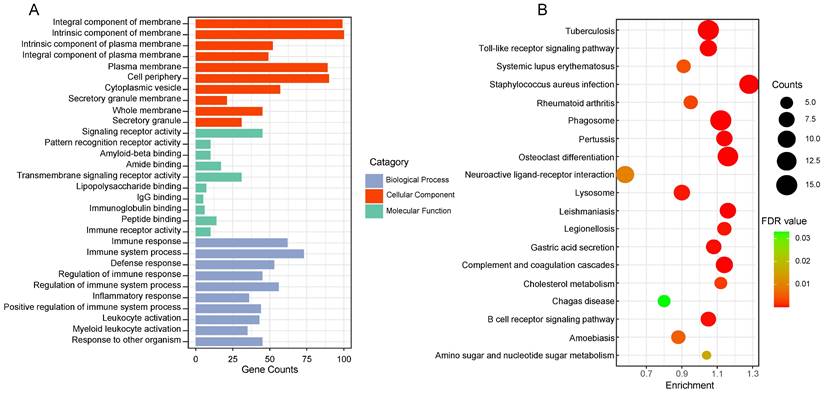
The functional enrichment analysis of gene in the two clinically important modules. (A) Top 10 GO terms in each category of GO enrichment analysis. (B) Significantly enriched KEGG pathways. FDR: false discovery rate.
Figure 3
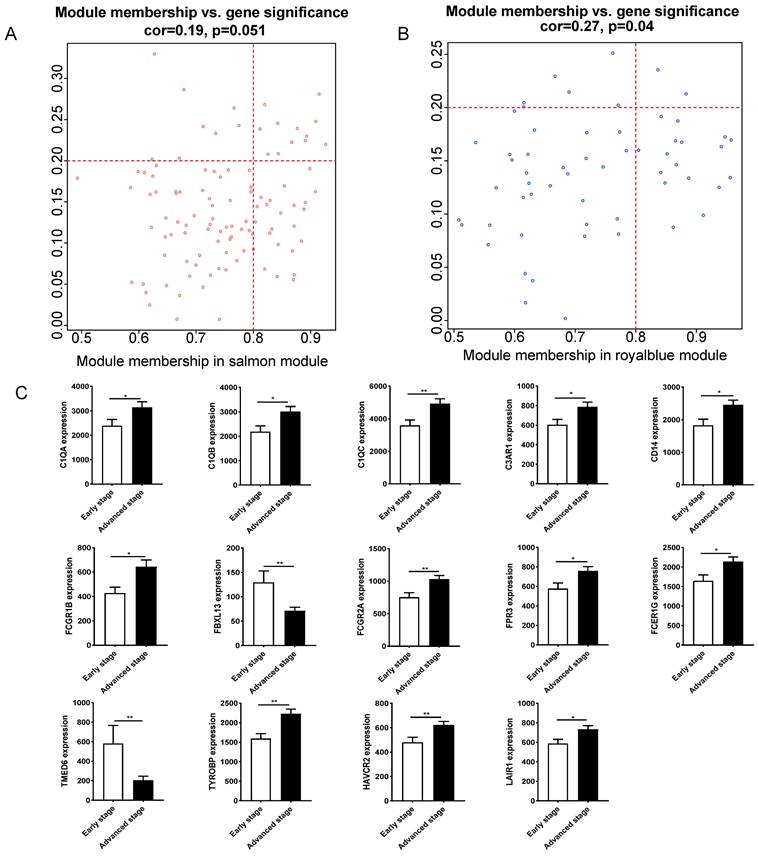
Hub gene identification between early stage and advanced stage of gastric cancer. (A)The scatterplot describing the relationship between MM and GS in salmon module. (B) The scatterplot describing the relationship between MM and GS in the royalblue module. (C) Fourteen hub genes expression between early stage and advanced stage of gastric cancer in GSE15459 cohort.
Through WGCNA, we identified modules likely to be important in GC development, whose genes were strongly related to toll-like receptor signaling pathway, cholesterol metabolism, INFγ response activation and oxidative phosphorylation suppression. Consistent with the predicted functional enrichment of genes in significant modules, the toll-like receptor signaling pathway has been shown to be associated with the pathogenesis of immune diseases and cancer through stimulating several downstream signaling pathways [13, 14]. Besides, toll-like receptor signaling pathway involved gene such as TLR4 expression is linked to several cancers. Huang et al. have reported that TLR4 is expressed in mouse tumor cells and activation of TLR4 in these cells induces the expression of a variety of soluble factors, making tumor cells resistant to Cytotoxic T lymphocyte attacks [15]. Additionally, toll-like receptors play a major role in early innate immune defense mechanisms through activating canonical and non-canonical pathways of inflammation [16]. Our study also highlighted the dysregulation of the toll-like receptors signaling pathway in the progression of GC and the differences in the composition of some innate immune system cells, such as T cells, NK cells, and macrophages, which indicated that the toll-like receptors signaling pathway and innate immune system regulation were involved in the occurrence and development of GC. In general, cholesterol and its metabolites (precursors and derivatives) play complex roles in tumors. In recent years, studies have reported the role of cholesterol metabolism in regulating tumor biological processes, especially carcinogenic signaling pathways and tumor microenvironment [17, 18]. Preclinical studies over the years have shown that manipulating the synthesis and uptake of cholesterol has an inhibitory effect on tumor growth, invasion and proliferation in a variety of cancers [18-20]. In addition, some new cholesterol metabolism molecules, such as SOAT1, SQLE and NPC1, have recently become promising drug targets for cancer treatment [21]. Some IFNγ signaling related genes, such as IRF family genes, play an important role in the prognosis of RCC by regulating cell cycle and inducing apoptosis [22]. Tumor cells are the key responders of IFN-γ in the tumor microenvironment [23]. The immune activation of IFN-γ on tumor cells is mainly attributed to the induction of tumor cells to express MHC class I, secrete chemokines, promote lymphocyte migration, and inhibit angiogenesis [24-26]. By directly killing gastric parietal cells, IFN-γ also appears to be a driver of disease progression to metaplasia during chronic gastritis [27].
Figure 4
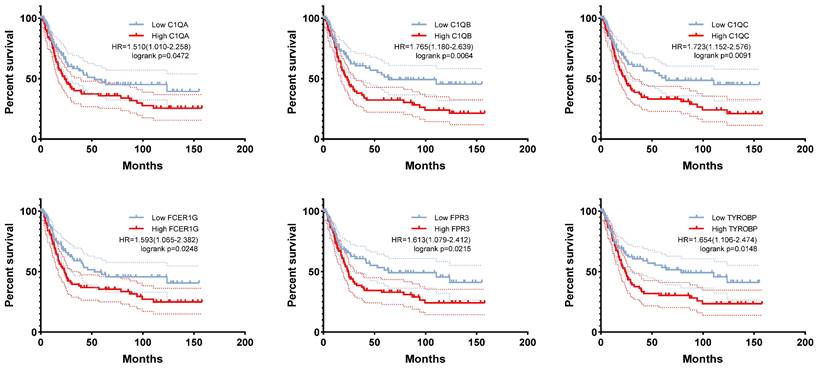
The correlation between C1QA, C1QB, C1QC, FCER1G, FPR3, TYROBP expression and the prognosis of gastric cancer was analyzed using GSE15459 cohort.
The TME is a highly structured ecosystem that includes a rich diversity of immune cells, cancer-associated fibroblasts, endothelial cells, pericytes, and other cell types that vary from tissue to tissue, such as fat cells and neurons [28-30]. As a key element in the evolutionary and ecological processes of tumorigenesis and treatment, the TME has received increasing attention in research and drug development. Previous studies have shown that high levels of immune cell infiltration are associated with a better prognosis for prostate cancer, cutaneous melanoma, and breast cancer. And increasing evidence indicated the implication the profound effects of TME in tumorigenesis, progression, and therapeutic resistance of cancers [31-33]. Researches have revealed that that inhibitory Tregs, tumor-associated stromal cells (TASCs), tumor-associated macrophages (TAMs), Tc17, and CD8+ depleted T cells are enriched in the tumor, while mast cells, endocrine, and follicular regulatory T cells are enriched in paracancer tissue through a comprehensive GC single cell transcriptome map. Notably, a higher proportion of TASCs was associated with worse prognosis [34]. Similarly, our analysis of TME landscape highlighted the enrichment of macrophages M1, macrophages M2 and follicular helper T cells in advanced stage tumor tissues while the levels of B cell naive, T cells CD4 memory resting, and NK cells resting were significantly decreased compared with that in early stage. Studies have proved that macrophages are players in the innate immune response and a major component of the leukocyte infiltrate present in solid tumors, which have two activated polarized states, namely classical (M1 polarization with tumor inhibitory function) and alternative (M2 polarization with tumor promoting and immunosuppression function) [35, 36]. Additionally, inducing M2 polarization and inhibiting M1 polarization in the TME of GC is one of the important factors in the formation of immune tolerance [36, 37]. We found higher distribution of both macrophages M1 and macrophages M2 in advanced stage patients. This may be due to the increase of M1 macrophages in tumor tissues of advanced patients to inhibit tumor growth, while the balance of TME in advanced tissues was destroyed, and M2 macrophages also increased and promoted tumor growth. NK cells can directly kill target cells and recognize tumor cells that CD8 + T cannot recognize. In GC patients, the infiltration level of NK cells in tumors and the infiltration level of NK cells in peripheral blood were positively correlated with the prognosis [38, 39]. Although the cytotoxicity of resting NK cells to GC is very low, NK cells induced by K562-mb15-41BBL cell line in vitro have strong cytotoxicity to GC and showed strong anti-tumor activity in animal experiments [40]. Our findings in this study were consisted with these results.
Figure 5
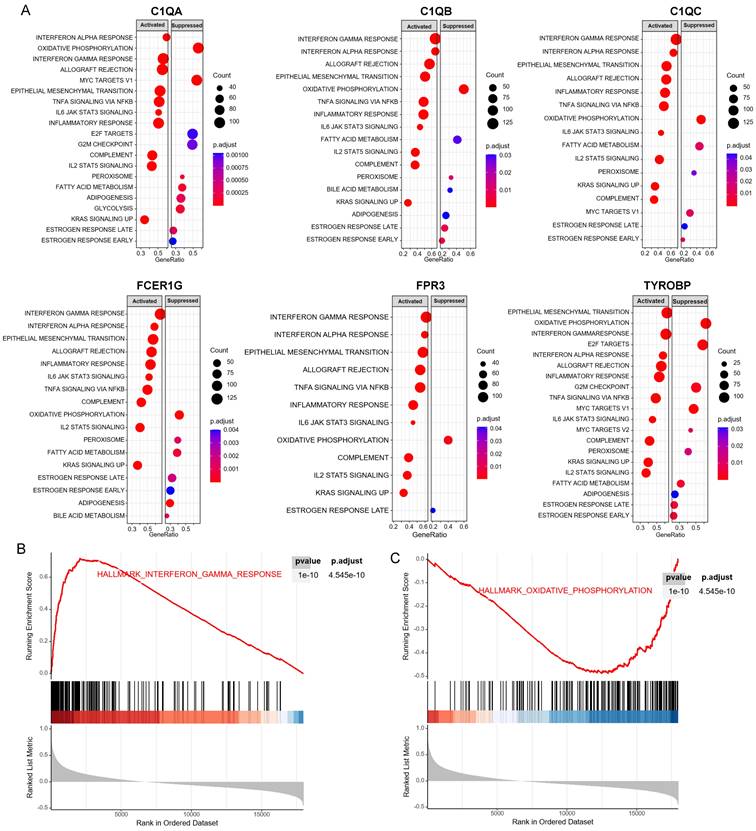
GSEA for samples with high hub gene expression and low hub gene expression. (A) The enriched gene sets in HALLMARK collection by samples of high C1QA, C1QB, C1QC, FCER1G, FPR3, TYROBP expression, respectively. (B) Gene set enriched in the interferon gamma response (p.adjust = 4.545e-10, NES =3.33, p-value = 1e-10). (C) Gene set enriched in the oxidative phosphorylation (p.adjust = 4.545e-10, NES =-2.39, p-value = 1e-10). NES: normalized enrichment score. GSEA: Gene Set Enrichment Analysis.
Figure 6
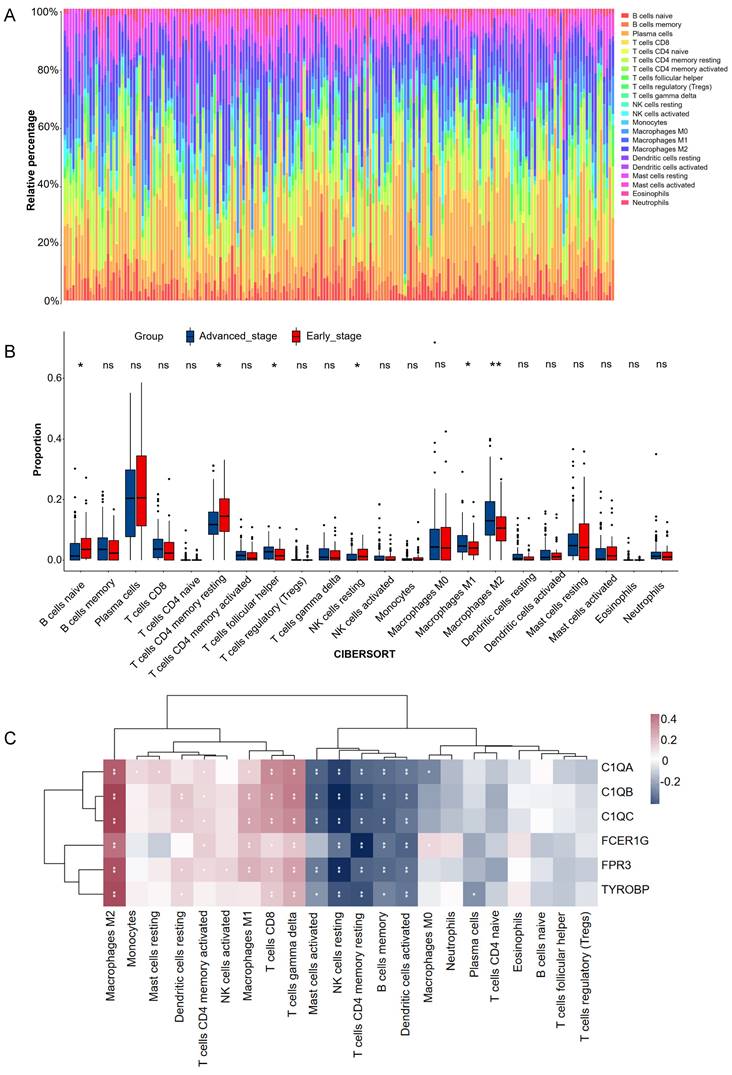
Estimation of tissues infiltrating immune cell types between early stage and advanced stage patients in the GSE15459 cohorts via CIBERSORT. (A) Stacked barplots show the relative composition of 22 immune cell subsets in 191 gastric cancer patients. (B) The boxplots show tissues infiltrating immune cell difference between early stage and advanced stage gastric cancer patients. Data were assessed via the method of wilcox test. * p-value < 0.05, ** p-value < 0.01, ns, no significance. (C) Heatmap of 6 hub genes and tissues infiltrating immune cell. Data were assessed via the method of Spearman analysis. * p-value < 0.05, ** p-value < 0.01.
Figure 7
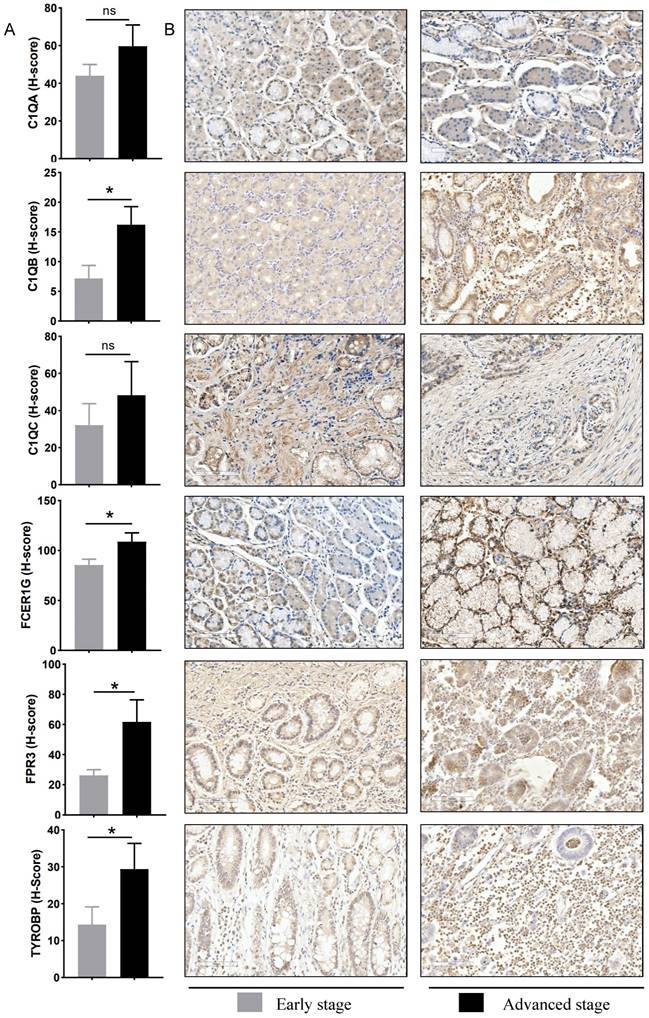
Experimental verification of six hub genes in different gastric cancer stage tissues. (A) Statistical analysis of immunohistochemistry results in early-stage tissues (n = 9) and advanced stage tissues (n = 9). Data were assessed via the method of Mann-Whitney U test. * p-value < 0.05, ns, no significance. (B) Representative images of immunohistochemical staining for C1QA, C1QB, C1QC, FCER1G, FPR3, and TYROBP between early stage and advanced stage gastric cancer patients. Scale bars = 100 μm.
In the present study, WGCNA networks revealed four common hub genes between early stage and advanced stage of GC patients, including C1QB, FCER1G, FPR3 and TYROBP. And these hub genes were strongly correlated with overall survival of GC patients. Previous studies have shown that C1q is the first recognition subcomponent of the complement classical pathway, which is comprised of three chains: C1qA, C1qB, and C1qC, and plays complex effects in the occurrence of various tumors, such as prostate cancer [41], ovarian cancer [42] and gliomas [43]. According to Yamada's report [44], high expressed C1QB was significantly related to poor prognosis in renal cell carcinoma. A similar scenario was also observed in the KM analysis of GC patients that C1QB was negatively associated with prognosis of patients. FCER1G is located on chromosome 1q23.3 and encodes the γ subunit of the crystalline (Fc) region (Fc R) of an immunoglobulin fragment, which participates in various immune responses such as phagocytosis and cytokine release [45, 46]. FCER1G appears to be altered in the progression of several cancers, such as esophageal squamous cell carcinoma, multiple myeloma, and clear cell renal cell carcinoma [46-48]. In addition, FCER1G has been linked to macrophage and T cell function in renal cancer [48]. These findings were consistent with our results that high expression of FCER1G was positively correlated with infiltration of M2 macrophages and negatively correlated with CD4 T cells, NK cells. Formyl-peptide receptors (FPRs) belong to the classical GPCR subfamily and three FPRs has been identified in humans: FPR1, FPR2 and FPR3. It has been reported that FPR1 and FPR2 are abnormally expressed in various tumors [49]. The expression of FPR1 in GC tissues is higher than that in normal tissues, which is closely related to the survival time of patients [50], and FPR2 is also highly expressed in endometrial and colon cancer [51]. However, little research has been done on FPR3. FPR3 is expressed in eosinophils, monocytes, macrophages, and dendritic cells, but its function is unclear [52]. Several ligands for FPR3 have been identified, including F2L, the acetylated n-terminal fragment of human heme-binding protein [53], and the neuroprotective peptide humanin [54]. Interestingly, FPR3 does not interact with formylated chemoattractants or ligands of FPR1 or FPR2. Therefore, FPR3 may have a unique functional role [55]. A recent study identified FPR3 as a key immune-related biomarker for predicting poor prognosis of breast cancer, possibly playing an important role in the progression of breast cancer by modulating the immune microenvironment [56]. Our study demonstrated the important role of FPR3 in GC progression. Moreover, our results revealed a positive correlation between TYROBP and tumor stage in GC. TYROBP, also known as DAP12 is notably positive with tumor progression in multiple cancers. Previous study has uncovered an association between high TYROBP expression with high-risk metastases as well as poor survival of breast cancer patients [57]. In our present study, TYROBP overexpression was associated with tumor stage and poor survival of GC patients. Additionally, results from interrelation analysis showed that TYROBP was positively associated with macrophage M2 and CD8 T cells, which negatively correlated with NK cells resting. This is consistent with some previous studies [58, 59]. These results indicated that TYROBP might be playing an immunosuppressive role to promote tumor immune escape in advanced GC.
The current study also has several limitations. Firstly, this study was based on bioinformatics analysis, and a relatively small cohort was recruited for hub genes verification, so further validation using large clinical cohorts should be performed to verify these results. Secondly, the results lacked vitro and vivo exploration to confirm the reliability of the mechanistic analysis. Therefore, a number of experiments should be conducted to demonstrate the mechanistic connections between these genes and GC progression in the future.
5. Conclusion
In conclusion, the current study identified 4 hub genes associated with GC progression and patients' prognosis through a series of bioinformatics analyses and validation. In addition, the four hub genes were significantly correlated with the infiltration of immune cells, which may help guide further studies to gain a comprehensive understanding of the network of hub genes involved in tumor progression and provide valuable clues for the treatment of GC.
Supplementary Material
Supplementary figures and tables.
Acknowledgements
Funding
The study was approved by Dazhou Science and Technology Bureau project (21ZDYF0025, 21ZDYF0023), Sichuan Medical Association Project (S21048), Sichuan Administration of Traditional Chinese Medicine project (2023MS141) and the "Chunhui Program" Cooperative Scientific Research Project of the Ministry of Education (HZKY20220562).
Data availability statement
The datasets analyzed during the current study are accessible via the GEO repository (GSE15459) [https://www.ncbi.nlm.nih.gov/geo/query/acc.cgi?acc=GSE15459]. The unprocessed data can be obtained from jianguoyun at the following link: https://www.jianguoyun.com/p/DQDavU4Qju6EDBjAnp8FIAA.
Author contributions
RL, BL, XLY, JL and YPC conceived the study. JZ, QC, JL and RL drafted the manuscript. XLY, TCZ and CZL performed the literature search and collected the data. XFL and RL analyzed and visualized the data. YPC, LGF, JPF and JZ completed in vitro experiment. HC, BL, QC, YPC and XFL helped with the final revision of this manuscript. All authors reviewed and approved the final manuscript.
Competing Interests
The authors have declared that no competing interest exists.
References
1. Sung H, Ferlay J, Siegel RL, Laversanne M, Soerjomataram I, Jemal A. et al. Global Cancer Statistics 2020: GLOBOCAN Estimates of Incidence and Mortality Worldwide for 36 Cancers in 185 Countries. CA Cancer J Clin. 2021;71:209-49
2. Cristescu R, Lee J, Nebozhyn M, Kim K-M, Ting JC, Wong SS. et al. Molecular analysis of gastric cancer identifies subtypes associated with distinct clinical outcomes. Nat Med. 2015;21:449-56
3. Sasako M, Sakuramoto S, Katai H, Kinoshita T, Furukawa H, Yamaguchi T. et al. Five-year outcomes of a randomized phase III trial comparing adjuvant chemotherapy with S-1 versus surgery alone in stage II or III gastric cancer. J Clin Oncol. 2011;29:4387-93
4. Raimondi A, Nichetti F, Peverelli G, Di Bartolomeo M, De Braud F, Pietrantonio F. Genomic markers of resistance to targeted treatments in gastric cancer: potential new treatment strategies. Pharmacogenomics. 2018;19:1047-68
5. Sexton RE, Al Hallak MN, Diab M, Azmi AS. Gastric cancer: a comprehensive review of current and future treatment strategies. Cancer Metastasis Rev. 2020;39:1179-203
6. Tan Z. Recent Advances in the Surgical Treatment of Advanced Gastric Cancer: A Review. Med Sci Monit. 2019;25:3537-41
7. Davidson M, Okines AFC, Starling N. Current and Future Therapies for Advanced Gastric Cancer. Clin Colorectal Cancer. 2015;14:239-50
8. Yao Z, Li F, Xie W, Chen J, Wu J, Zhan Y. et al. DeepSF-4mC: A deep learning model for predicting DNA cytosine 4mC methylation sites leveraging sequence features. Comput Biol Med. 2024;171:108166
9. Yao Z, Zhu G, Too J, Duan M, Wang Z. Feature Selection of OMIC Data by Ensemble Swarm Intelligence Based Approaches. Front Genet. 2021;12:793629
10. Langfelder P, Horvath S. WGCNA: an R package for weighted correlation network analysis. BMC Bioinformatics. 2008;9:559
11. Liu K, Chen S, Lu R. Identification of important genes related to ferroptosis and hypoxia in acute myocardial infarction based on WGCNA. Bioengineered. 2021;12:7950-63
12. Newman AM, Liu CL, Green MR, Gentles AJ, Feng W, Xu Y. et al. Robust enumeration of cell subsets from tissue expression profiles. Nat Methods. 2015;12:453-7
13. Tsan M-F. Toll-like receptors, inflammation and cancer. Semin Cancer Biol. 2006;16:32-7
14. Rakoff-Nahoum S, Medzhitov R. Toll-like receptors and cancer. Nat Rev Cancer. 2009;9:57-63
15. Huang B, Zhao J, Li H, He K-L, Chen Y, Chen S-H. et al. Toll-like receptors on tumor cells facilitate evasion of immune surveillance. Cancer Res. 2005;65:5009-14
16. van Bergenhenegouwen J, Plantinga TS, Joosten LAB, Netea MG, Folkerts G, Kraneveld AD. et al. TLR2 & Co: a critical analysis of the complex interactions between TLR2 and coreceptors. J Leukoc Biol. 2013;94:885-902
17. Mullen PJ, Yu R, Longo J, Archer MC, Penn LZ. The interplay between cell signalling and the mevalonate pathway in cancer. Nat Rev Cancer. 2016;16:718-31
18. Huang B, Song B-L, Xu C. Cholesterol metabolism in cancer: mechanisms and therapeutic opportunities. Nat Metab. 2020;2:132-41
19. Lyu J, Yang EJ, Head SA, Ai N, Zhang B, Wu C. et al. Pharmacological blockade of cholesterol trafficking by cepharanthine in endothelial cells suppresses angiogenesis and tumor growth. Cancer Lett. 2017 409
20. Costa GA, de Souza SB, da Silva Teixeira LR, Okorokov LA, Arnholdt ACV, Okorokova-Façanha AL. et al. Tumor cell cholesterol depletion and V-ATPase inhibition as an inhibitory mechanism to prevent cell migration and invasiveness in melanoma. Biochim Biophys Acta Gen Subj. 2018;1862:684-91
21. Xu H, Zhou S, Tang Q, Xia H, Bi F. Cholesterol metabolism: New functions and therapeutic approaches in cancer. Biochim Biophys Acta Rev Cancer. 2020;1874:188394
22. Zhang Q, Zhang L, Li L, Wang Z, Ying J, Fan Y. et al. Interferon regulatory factor 8 functions as a tumor suppressor in renal cell carcinoma and its promoter methylation is associated with patient poor prognosis. Cancer Lett. 2014;354:227-34
23. Kim EY, Ner-Gaon H, Varon J, Cullen AM, Guo J, Choi J. et al. Post-sepsis immunosuppression depends on NKT cell regulation of mTOR/IFN-γ in NK cells. J Clin Invest. 2020;130:3238-52
24. Kanda N, Shimizu T, Tada Y, Watanabe S. IL-18 enhances IFN-gamma-induced production of CXCL9, CXCL10, and CXCL11 in human keratinocytes. Eur J Immunol. 2007;37:338-50
25. Grasso CS, Tsoi J, Onyshchenko M, Abril-Rodriguez G, Ross-Macdonald P, Wind-Rotolo M. et al. Conserved Interferon-γ Signaling Drives Clinical Response to Immune Checkpoint Blockade Therapy in Melanoma. Cancer Cell. 2020 38
26. Muntjewerff EM, Meesters LD, van den Bogaart G, Revelo NH. Reverse Signaling by MHC-I Molecules in Immune and Non-Immune Cell Types. Front Immunol. 2020;11:605958
27. Osaki LH, Bockerstett KA, Wong CF, Ford EL, Madison BB, DiPaolo RJ. et al. Interferon-γ directly induces gastric epithelial cell death and is required for progression to metaplasia. J Pathol. 2019;247:513-23
28. Chi H, Xie X, Yan Y, Peng G, Strohmer DF, Lai G. et al. Natural killer cell-related prognosis signature characterizes immune landscape and predicts prognosis of HNSCC. Front Immunol. 2022;13:1018685
29. Chi H, Gao X, Xia Z, Yu W, Yin X, Pan Y. et al. FAM family gene prediction model reveals heterogeneity, stemness and immune microenvironment of UCEC. Front Mol Biosci. 2023;10:1200335
30. Xiong J, Chi H, Yang G, Zhao S, Zhang J, Tran LJ. et al. Revolutionizing anti-tumor therapy: unleashing the potential of B cell-derived exosomes. Front Immunol. 2023;14:1188760
31. Zeng D, Zhou R, Yu Y, Luo Y, Zhang J, Sun H. et al. Gene expression profiles for a prognostic immunoscore in gastric cancer. Br J Surg. 2018;105:1338-48
32. Zeng D, Li M, Zhou R, Zhang J, Sun H, Shi M. et al. Tumor Microenvironment Characterization in Gastric Cancer Identifies Prognostic and Immunotherapeutically Relevant Gene Signatures. Cancer Immunol Res. 2019;7:737-50
33. Zeng D, Ye Z, Wu J, Zhou R, Fan X, Wang G. et al. Macrophage correlates with immunophenotype and predicts anti-PD-L1 response of urothelial cancer. Theranostics. 2020;10:7002-14
34. Sun K, Xu R, Ma F, Yang N, Li Y, Sun X. et al. scRNA-seq of gastric tumor shows complex intercellular interaction with an alternative T cell exhaustion trajectory. Nat Commun. 2022;13:4943
35. Biswas SK, Mantovani A. Macrophage plasticity and interaction with lymphocyte subsets: cancer as a paradigm. Nat Immunol. 2010;11:889-96
36. Chen D, Zhang X, Li Z, Zhu B. Metabolic regulatory crosstalk between tumor microenvironment and tumor-associated macrophages. Theranostics. 2021;11:1016-30
37. Liu Y, Li C, Lu Y, Liu C, Yang W. Tumor microenvironment-mediated immune tolerance in development and treatment of gastric cancer. Front Immunol. 2022;13:1016817
38. Li T, Zhang Q, Jiang Y, Yu J, Hu Y, Mou T. et al. Gastric cancer cells inhibit natural killer cell proliferation and induce apoptosis via prostaglandin E2. Oncoimmunology. 2016;5:e1069936
39. Xie M-Z, Tang Y-P, Hu B-L, Li K-Z, Li J-L, Liang X-Q. Percentage of Natural Killer (NK) Cells in Peripheral Blood Is Associated with Prognosis in Patients with Gastric Cancer: A Retrospective Study from a Single Center. Med Sci Monit. 2021;27:e927464
40. Mimura K, Kamiya T, Shiraishi K, Kua L-F, Shabbir A, So J. et al. Therapeutic potential of highly cytotoxic natural killer cells for gastric cancer. Int J Cancer. 2014;135:1390-8
41. Hong Q, Sze C-I, Lin S-R, Lee M-H, He R-Y, Schultz L. et al. Complement C1q activates tumor suppressor WWOX to induce apoptosis in prostate cancer cells. PLoS One. 2009;4:e5755
42. Agostinis C, Vidergar R, Belmonte B, Mangogna A, Amadio L, Geri P. et al. Complement Protein C1q Binds to Hyaluronic Acid in the Malignant Pleural Mesothelioma Microenvironment and Promotes Tumor Growth. Front Immunol. 2017;8:1559
43. Mangogna A, Belmonte B, Agostinis C, Zacchi P, Iacopino DG, Martorana A. et al. Prognostic Implications of the Complement Protein C1q in Gliomas. Front Immunol. 2019;10:2366
44. Yamada Y, Arai T, Kojima S, Sugawara S, Kato M, Okato A. et al. Regulation of antitumor miR-144-5p targets oncogenes: Direct regulation of syndecan-3 and its clinical significance. Cancer Sci. 2018;109:2919-36
45. Andreu P, Johansson M, Affara NI, Pucci F, Tan T, Junankar S. et al. FcRgamma activation regulates inflammation-associated squamous carcinogenesis. Cancer Cell. 2010;17:121-34
46. Fu L, Cheng Z, Dong F, Quan L, Cui L, Liu Y. et al. Enhanced expression of FCER1G predicts positive prognosis in multiple myeloma. J Cancer. 2020;11:1182-94
47. Xu T, Dai T, Zeng P, Guo Y, He K. A novel immune-related gene signature predicts survival in esophageal squamous cell carcinoma. Transl Cancer Res. 2021;10:2354-67
48. Dong K, Chen W, Pan X, Wang H, Sun Y, Qian C. et al. FCER1G positively relates to macrophage infiltration in clear cell renal cell carcinoma and contributes to unfavorable prognosis by regulating tumor immunity. BMC Cancer. 2022;22:140
49. Prevete N, Liotti F, Visciano C, Marone G, Melillo RM, de Paulis A. The formyl peptide receptor 1 exerts a tumor suppressor function in human gastric cancer by inhibiting angiogenesis. Oncogene. 2015;34:3826-38
50. Yang Y, Liu Y, Yao X, Ping Y, Jiang T, Liu Q. et al. Annexin 1 released by necrotic human glioblastoma cells stimulates tumor cell growth through the formyl peptide receptor 1. Am J Pathol. 2011;179:1504-12
51. Cocco E, Bellone S, El-Sahwi K, Cargnelutti M, Buza N, Tavassoli FA. et al. Serum amyloid A: a novel biomarker for endometrial cancer. Cancer. 2010;116:843-51
52. Dorward DA, Lucas CD, Chapman GB, Haslett C, Dhaliwal K, Rossi AG. The role of formylated peptides and formyl peptide receptor 1 in governing neutrophil function during acute inflammation. Am J Pathol. 2015;185:1172-84
53. Migeotte I, Riboldi E, Franssen J-D, Grégoire F, Loison C, Wittamer V. et al. Identification and characterization of an endogenous chemotactic ligand specific for FPRL2. J Exp Med. 2005;201:83-93
54. Harada M, Habata Y, Hosoya M, Nishi K, Fujii R, Kobayashi M. et al. N-Formylated humanin activates both formyl peptide receptor-like 1 and 2. Biochem Biophys Res Commun. 2004;324:255-61
55. Rabiet M-J, Macari L, Dahlgren C, Boulay F. N-formyl peptide receptor 3 (FPR3) departs from the homologous FPR2/ALX receptor with regard to the major processes governing chemoattractant receptor regulation, expression at the cell surface, and phosphorylation. J Biol Chem. 2011;286:26718-31
56. Qi J, Liu Y, Hu J, Lu L, Dou Z, Dai H. et al. Identification of FPR3 as a Unique Biomarker for Targeted Therapy in the Immune Microenvironment of Breast Cancer. Front Pharmacol. 2020;11:593247
57. Shabo I, Olsson H, Stål O, Svanvik J. Breast cancer expression of DAP12 is associated with skeletal and liver metastases and poor survival. Clin Breast Cancer. 2013;13:371-7
58. Chanmee T, Ontong P, Konno K, Itano N. Tumor-associated macrophages as major players in the tumor microenvironment. Cancers (Basel). 2014;6:1670-90
59. Jiang J, Ding Y, Wu M, Lyu X, Wang H, Chen Y. et al. Identification of TYROBP and C1QB as Two Novel Key Genes With Prognostic Value in Gastric Cancer by Network Analysis. Front Oncol. 2020;10:1765
Author contact
![]() Corresponding authors: liboer2002edu.cn (Bo Li); 344920646com (Xiaoli Yang); 278480383com (Xiufang Luo).
Corresponding authors: liboer2002edu.cn (Bo Li); 344920646com (Xiaoli Yang); 278480383com (Xiufang Luo).
Citation styles
APA
Liu, R., Liu, J., Cao, Q., Chu, Y., Chi, H., Zhang, J., Fu, J., Zhang, T., Fan, L., Liang, C., Luo, X., Yang, X., Li, B. (2024). Identification of crucial genes through WGCNA in the progression of gastric cancer. Journal of Cancer, 15(11), 3284-3296. https://doi.org/10.7150/jca.95757.
ACS
Liu, R.; Liu, J.; Cao, Q.; Chu, Y.; Chi, H.; Zhang, J.; Fu, J.; Zhang, T.; Fan, L.; Liang, C.; Luo, X.; Yang, X.; Li, B. Identification of crucial genes through WGCNA in the progression of gastric cancer. J. Cancer 2024, 15 (11), 3284-3296. DOI: 10.7150/jca.95757.
NLM
Liu R, Liu J, Cao Q, Chu Y, Chi H, Zhang J, Fu J, Zhang T, Fan L, Liang C, Luo X, Yang X, Li B. Identification of crucial genes through WGCNA in the progression of gastric cancer. J Cancer 2024; 15(11):3284-3296. doi:10.7150/jca.95757. https://www.jcancer.org/v15p3284.htm
CSE
Liu R, Liu J, Cao Q, Chu Y, Chi H, Zhang J, Fu J, Zhang T, Fan L, Liang C, Luo X, Yang X, Li B. 2024. Identification of crucial genes through WGCNA in the progression of gastric cancer. J Cancer. 15(11):3284-3296.
This is an open access article distributed under the terms of the Creative Commons Attribution License (https://creativecommons.org/licenses/by/4.0/). See http://ivyspring.com/terms for full terms and conditions.