Impact Factor ISSN: 1837-9664

 Global reach, higher impact
J Cancer 2026; 17(4):771-786. doi:10.7150/jca.131997 This issue Cite
Research Paper
High PMS2 Expression-Based Nomogram for Risk Stratification in Resected Hepatocellular Carcinoma: Application to Recurrence and Neoadjuvant Therapy Selection
Wenchen Gong1,2#, Ruyu Han1,3#, Liyu Sun1,3#, Yingrui Gao1,2#, Zhiqiang Han1,4, Yimeng Wang1,3, Yuren Xia1,5, Yukun Wei1,3, Tianqiang Song1,3, Lu Chen1,3 ![]() , Xiangdong Tian1,6
, Xiangdong Tian1,6 ![]()
1. Tianjin Medical University Cancer Institute and Hospital, National Clinical Research Center for Cancer, Tianjin Key Laboratory of Digestive Cancer, Tianjin's Clinical Research Center for Cancer, State Key Laboratory of Druggability Evaluation and Systematic Translational Medicine, Tianjin 300060, China.
2. Department of Pathology, Tianjin Medical University Cancer Institute and Hospital, Tianjin 300060, China.
3. Department of Hepatobiliary Cancer, Liver Cancer Research Center, Tianjin Medical University Cancer Institute and Hospital, Tianjin 300060, China.
4. Department of Anesthesiology, Tianjin Medical University Cancer Institute and Hospital, Tianjin 300060, China.
5. Department of Pediatric Oncology, Tianjin Medical University Cancer Institute and Hospital, Tianjin 300060, China.
6. Department of Endoscopy, Tianjin Medical University Cancer Institute and Hospital, Tianjin 300060, China.
# These authors contributed equally to this work.
Received 2026-1-23; Accepted 2026-3-17; Published 2026-3-25
Abstract

Hepatocellular carcinoma (HCC) progresses rapidly with a poor prognosis due to the lack of reliable recurrence risk markers. Accurate prognostic stratification and individualized recurrence prediction remain major clinical challenges, hindering treatment optimization, particularly for adjuvant or neoadjuvant therapy. Although defects in mismatch repair (MMR) mechanisms are well studied, the role of elevated MMR protein expression—particularly post-meiotic segregation increased 2 (PMS2)—has remained unclear. This study aimed to investigate the prognostic value of PMS2 overexpression and develop an integrated predictive model to improve risk stratification and guide therapy selection. We analyzed 173 HCC patients and demonstrated that elevated PMS2 expression was significantly associated with poorer disease-free survival (DFS) (p < 0.001) and overall survival (OS) (p < 0.001). Cellular and animal models confirmed the pro-proliferative role of PMS2 in HCC progression. Multivariate analysis identified high PMS2 expression [HR: 3.109 (2.019-4.786), p < 0.001], high Phosphorylated-Protein Kinase B (p-AKT) expression [HR: 2.201 (1.304-3.715), p = 0.003], Barcelona Clinic Liver Cancer (BCLC) stage [HR: 2.635 (1.156-5.992), p = 0.021], and poor pathological differentiation [HR: 1.729 (1.098-2.722), p = 0.018] as independent risk factors for poor DFS. The nomogram based on these factors demonstrated good predictive performance and effectively stratified patients into high-risk and low-risk groups (p < 0.001). In an exploratory analysis of a separate cohort receiving neoadjuvant immunotherapy, preliminary data suggested that high-risk patients might derive greater survival benefit (p=0.044). These findings highlight PMS2 overexpression as a potential prognostic biomarker and provide a promising predictive tool for personalized treatment planning in HCC, warranting further validation in prospective studies.
Keywords: PMS2, hepatocellular carcinoma, p-AKT, prognosis, proliferation
1. Introduction
Primary liver cancer is one of the most common causes of death globally and the second leading cause of cancer-related deaths [1]. Hepatocellular carcinoma (HCC) accounts for 90% of primary liver cancers, and its incidence in China has risen significantly in recent years [2]. Despite some improvements in diagnosis and treatment, the current standard treatment or neoadjuvant therapy often falls short. For patients with HCC, recurrence and metastasis are the major challenges [3]. Research indicates that the poor prognosis of HCC is primarily linked to the high tumor cell heterogeneity [4]. Current postoperative prognostic parameters are limited to clinical stage and histopathological grading. The lack of reliable markers for more accurate stratification of HCC impairs a clinician's ability to plan appropriate treatment regimens; therefore, novel biomarkers are urgently needed.
While deficiency of mismatch repair (MMR) proteins is well-characterized in oncology, the clinical significance of MMR protein overexpression remains poorly understood. In mammalian cells, the crucial protein complex for post-replication DNA MMR comprises MutL homolog 1 (MLH1), MutS homolog 2 (MSH2), MutS homolog 6 (MSH6), and PMS2 [5]. MMR corrects DNA mismatches and small indels, thereby maintaining genomic stability [6, 7]. MMR deficiency causes microsatellite instability (MSI), which disrupts genes and drives cancer development by accumulating mutations. [8, 9]. Deficient MMR (dMMR) is identified by detecting the loss of MMR protein expression via immunohistochemistry (IHC). It serves as an important biomarker and therapeutic target in cancers like colorectal, lung, and cholangiocarcinoma [10-12]. In clinical practice, MMR-proficient (MMRp) tumors often show variable MMR protein expression. While PMS2 is usually faint, it can be strongly positive in some cases. However, the significance of PMS2 overexpression in tumors remains unclear. Our recent study identified specifically elevated PMS2 expression in a subset of patients with short-term recurrent HCC, consistent with previous studies indicating a negative correlation between elevated PMS2 levels and the prognosis of prostate cancer and esophageal squamous cell carcinoma [13, 14]. Recent studies in ovarian cancer show that AKT directly targets and degrades PMS2 [15, 16]. The PI3K-AKT pathway, which promotes tumor proliferation, cycle progression, and metastasis [17], also plays a key role in driving non-alcoholic steatohepatitis to HCC progression via AKT phosphorylation, contributing to aggressive tumor behavior and poor prognosis [18, 19]. However, the prognostic significance of integrated elevated PMS2 and phosphorylated AKT assessment in HCC remains unclear.
Neoadjuvant therapy represents an evolving paradigm for patients with potentially resectable HCC, aiming to reduce tumor burden and eradicate micrometastases prior to curative-intent surgery [20]. While promising, its clinical implementation faces significant challenges: approximately 30% of patients experience suboptimal response leading to missed surgical opportunities, primarily due to the absence of validated biomarkers for patient stratification [21]. Current neoadjuvant strategies for HCC include dual immune checkpoint inhibition (PRIME-HCC, NCT03682276), PD-1/TIGIT bispecific antibodies (e.g., Rilvegostomig, CTR20251317), and adoptive cell therapy (Liocyx-M004). These modalities have shown promising major pathological response (MPR) rates of 35-52% and encouraging recurrence-free survival (RFS) trends [22]. However, patient selection and response prediction remain challenging due to the limited predictive utility of conventional biomarkers like PD-L1 and AFP (AUC < 0.65) [23, 24].
To address this limitation, we focused on establishing integrated biomarker profiles to more accurately assess treatment benefit and identify potential beneficiary populations. Accordingly, this study aimed to investigate the relationship between PMS2 expression and clinicopathological features in HCC and to preliminarily elucidate its role in promoting HCC progression. We further enhanced risk prediction by integrating expression profiles of PMS2 and phosphorylated AKT (p-AKT), constructing a model that successfully stratified patients into high- and low-risk subgroups. We further explored the potential predictive value of this model in an independent, albeit small, cohort of 33 patients receiving neoadjuvant immunotherapy. Preliminary observations suggested that high-risk individuals identified by the model might derive greater benefit from such treatment. This exploratory analysis highlights the potential of our model as a tool for risk stratification and warrants further investigation into its utility for precision treatment decision-making—particularly in selecting candidates who may benefit most from neoadjuvant immunotherapy.
2. Materials and Methods
2.1 TCGA and GEO datasets
To obtain raw HCC data, we downloaded relevant datasets from the Cancer Genome Atlas (TCGA, https://portal.gdc.cancer.gov/) database, through the National Cancer Institute website (www.tcga-data.nci.nih.gov/tcga) and the Gene Expression Omnibus (GEO, www.ncbi.nlm.nih.gov/geo/) database, through the National Center for Biotechnology Information (NCBI) website (www.ncbi.nlm.nih.gov/geo). Subsequently, the data were normalized using R software (https://www.r-project.org/). We analyzed PMS2 expression across multiple tumor types and adjacent non-tumor tissues using data from TCGA. Furthermore, we examined the correlation between PMS2 expression and the prognosis of patients with HCC. Additionally, we used GEO datasets, specifically GSE36376, GSE6764, and GSE54236, to validate the disparities in PMS2 expression between HCC tumors and adjacent non-tumor tissues.
2.2 Gene set enrichment analysis (GSEA)
Gene Set Enrichment Analysis (GSEA) was conducted to ascertain whether PMS2 mRNA levels were correlated with cellular proliferation and prognosis using the GSEA 4.3.3 software (The Broad Institute of MIT and Harvard, Cambridge, MA, USA). This analysis was based on the GSE36376 and GSE116174 HCC datasets.
2.3 Patients and tissue samples
This study evaluated 173 patients with HCC who underwent hepatectomy at Tianjin Medical University Cancer Institute and Hospital, Tianjin, China, between January 2017 and December 2021. Additionally, 33 patients who received preoperative neoadjuvant therapy with either tislelizumab monotherapy or tislelizumab combined with lenvatinib between April 2023 and June 2024 were recruited as a validation group. This study specifically enrolled patients with early-stage hepatocellular carcinoma who presented with low tumor burden and well-preserved liver function, with the primary objective of identifying the optimal candidate population for neoadjuvant immunotherapy prior to surgical resection. Patients who underwent palliative resection only, transcatheter arterial embolization, or radiotherapy were excluded. All patients had complete medical records and follow-up data. Disease-free survival (DFS) was defined as the interval between surgery and the detection of recurrence. Overall survival (OS) was defined as the time from the surgery date to the death date or last follow-up. Two board-certified pathologists reviewed all HCC cases, with both diagnosis and histological grading based on the criteria of the World Health Organization. All patients provided written informed consent, and the Research Ethics Committee of Tianjin Medical University Cancer Institute and Hospital approved the present study (No. bc20240059). Patients were consecutively screened using uniform inclusion/exclusion criteria to enhance temporal representativeness. Blinded evaluation and tissue microarray (TMA) were applied for standardized processing, accompanied by unified immunohistochemistry protocols and interpretation criteria to ensure objective and consistent measurement of biomarkers and clinical outcomes. Multivariable Cox models will adjust for key clinicopathological variables (e.g., tumor size, stage, liver function) to evaluate the independent prognostic value of the biomarkers.
2.4 Immunohistochemical (IHC) staining
Paraffin sections of patient tissues were dewaxed and hydrated, immersed in EDTA repair solution, and the antigen was repaired at 95 °C for 10 min. To block endogenous peroxidase activity, 3% hydrogen peroxide was added dropwise at room temperature and the mixture was incubated for 10 min. The primary antibody was added dropwise and the mixture was incubated at room temperature for 90 min. Subsequently, PicTure PV6001 and PV6002 staining systems (Zhongshan Chemical Co., Beijing, China) were used to detect PMS2 (Clone A16-4, REF 790-5094, Ventana Medical Systems, Tucson, AZ, USA), p-AKT (bs-10134R, Bioss Antibodies, Beijing, China), and Ki-67 (Clone 30-9, REF 790-4286, Ventana Medical Systems, Tucson, AZ, USA) expression levels. After washing thrice, 3,3'-Diaminobenzidine (DAB) was added and developed for 5-10 min and the sections were counterstained with hematoxylin. Negative controls were incubated with PBS without the primary antibody.
2.5 IHC analyses
IHC sections were individually evaluated by two pathologists. The degree of staining was assessed using a staining index (SI; the product of staining intensity and staining percentage). The staining percentage was classified into four categories: no significant positive cells scored 0, positive cell rate ≤ 25% scored 1, positive cell rate of 25%-50% scored 2, and a positive cell rate > 50% scored 3. The staining intensity was classified into four categories: 0 points for insignificant staining, 1 point for light staining, 2 points for moderate staining, 3 points for intense staining. To rigorously establish the most clinically relevant threshold for PMS2 expression, we employed a data-driven, clinical outcome-oriented approach. All included cases demonstrated positive PMS2 expression by IHC. This comprehensive analysis established that a threshold of > 4 for high expression and ≤ 4 for low expression provided optimal prognostic discrimination, with low expression corresponding to weakly positive staining and no completely negative cases included in our cohort.
2.6 Cell culture and transfection
Hep3B and HepG2 cells were purchased from the American Type Culture Collection (Manassas, VA, USA). The Huh7, PLC, HLE, MHCC-97H, MHCC-97L and MHCC-LM3 cell lines were purchased from the Health Science Research Resources Bank (Shanghai, China). The cells were cultured in Dulbecco's modified Eagle's medium (DMEM) containing 10% fetal bovine serum (FBS) and 1% penicillin-streptomycin in a 5% CO2 incubator at 37 °C. Huh7 cells were infected with lentivirus to produce stable PMS2 or SCR cells, which were selected using puromycin.
2.7 Western blotting
Treated cells were lysed using RIPA lysis buffer on ice for 30 min, followed by centrifugation at 4 °C and 12,000×g for 15 min. The supernatant was collected and the protein concentration was determined using a BCA protein quantitative kit (40203ES60, Yeasen Biotechnology, Shanghai, China). The loading buffer was added to the protein solution and the mixture was boiled in a water bath for 10 min. Equal amounts of protein were separated using sodium dodecyl sulfate-polyacrylamide gel electrophoresis (Millipore, MA, USA). The corresponding primary and secondary antibodies were added according to the manufacturer's instructions, followed by exposure to a chemiluminescence imaging system (LI-COR, Lincoln, NE, USA).
2.8 Cell proliferation assay
The cells demonstrating good growth were collected and a suspension of 2×10³ cells were prepared in the culture medium. The cells were inoculated into 96-well plates according to experimental groups, and an equal volume of the same medium was used as a blank control. Into each well, we added 10 μL of Cell Counting Kit-8 (CK04, Dojindo Laboratories, Kumamoto, Japan) solution and 90 μL of DMEM. After a 4-h incubation period, a microplate reader (BioTek Instruments, Winooski, VT, USA) was used to detect the OD value at 450 nm. OD data were recorded continuously for 4-5 days and the cell proliferation rate were calculated.
2.9 Colony formation assay
After trypsin treatment, the cell suspensions were evenly seeded into six-well plates at a density of 300 cells per well. The cells were then incubated at 37 °C and cultured in 5% CO2 for two weeks. The cell colonies were fixed in methanol and stained with 0.5% crystal violet. The number of cell colonies were imaged under a 100× microscope (Nikon Instruments Inc., Shinagawa, Japan).
2.10 Mouse xenograft tumor model
Three-week-old male BALB/c nude mice (n = 10) with specific pathogen-free certification were purchased from the Biomedical Research Institute, Nanjing, China and randomly divided into experimental and control groups using a computer-generated randomization sequence. Huh7 cells in the logarithmic growth phase were treated with trypsin and suspended in a serum-free medium. The cells (5×10⁶) were mixed with Matrigel at a ratio of 1:1 and subcutaneously injected into each group of nude mice. Six weeks later (predefined endpoint: tumor ulceration or body weight loss ≥ 15%), the mice were sacrificed by cervical dislocation following isoflurane anesthesia and tumors were removed. The animal experiments were approved by the Ethics Committee of Tianjin Medical University Cancer Institute and Hospital (Approval No. LLSP2019-030) in accordance with NIH Guidelines for Animal Research.
2.11 Statistical analyses
All in vitro and in vivo experiments were performed with a minimum of three independent replicates. Data are presented as mean ± standard deviation. Statistical significance between groups was determined by Student's t-test or one-way analysis of variance (ANOVA), as appropriate. A two-sided p-value < 0.05 was considered statistically significant. For clinical data evaluation, R version 4.3.1 (R Foundation for Statistical Computing, Vienna, Austria) and SPSS 26.0 for Windows (SPSS Inc., Chicago, IL, USA) were used for data evaluation. The univariate Kaplan-Meier method and multivariate Cox regression analysis were used to assess independent risk factors and generate survival curves for patients with HCC. The prognostic nomogram was developed based on independent risk factors. The internal validation of the nomogram was performed to assess its potential performance in future samples drawn from the same underlying population. We employed the bootstrap method with 1,000 resamples to correct for overfitting and obtain optimism-corrected estimates of the model's discrimination and calibration. Following this validation, the resulting scores were analyzed using X-tile software, identifying a cutoff of 180 that maximized Youden's index and thus optimally distinguished prognostic groups in our cohort. The chi-square test or Fisher exact test was used for intergroup comparisons of categorical variables. To minimize potential confounding effects from baseline variables on outcome assessment, we employed propensity score matching to balance intergroup baseline characteristics based on clinical and pathological variables including gender, age, PMS2 expression, p-AKT expression, tumor size, AFP level, BCLC stage, and histological grade. A two-sided p-value < 0.05 indicated statistically significance differences (*p < 0.05, **p < 0.01, ***p < 0.001, ****p < 0.0001).
3. Results
3.1 The elevation of PMS2 in HCC indicated poor prognosis
To investigate the role of PMS2 in cancer progression, the expression pattern of PMS2 was assessed in multiple cancer types using TCGA datasets. The results revealed higher expression of PMS2 in tumor tissues than in adjacent normal tissues in most types of cancer, including 49 paired HCC samples (Figures 1A, B). Consistently, the analysis of multiple GEO datasets (GSE36376, GSE6764, and GSE54236) also revealed an increasing trend in PMS2 expression between tumor tissues in HCC and adjacent normal tissues (Figure 1C).
The expression of PMS2 in HCC and its association with prognosis. (A) Pan-cancer data obtained from the TCGA datasets were utilized to assess the PMS2 mRNA expression levels. (B) The difference in expression of PMS2 between HCC tissues and matched normal tissues was examined within TCGA datasets. (C) Differences in expression of PMS2 between HCC tissues and matched normal tissues were assessed using GEO datasets. (D, E) The Kaplan-Meier survival curve of the TCGA dataset validates the correlation between PMS2 expression and the DFS and OS of patients with HCC. (F) GSEA of the correlation between the expression level of PMS2 and OS in HCC. PMS2, post-meiotic segregation increased 2; HCC, hepatocellular carcinoma; TCGA, The Cancer Genome Atlas; GEO, Gene Expression Omnibus; DFS, disease-free survival; OS, overall survival; ***p < 0.001.
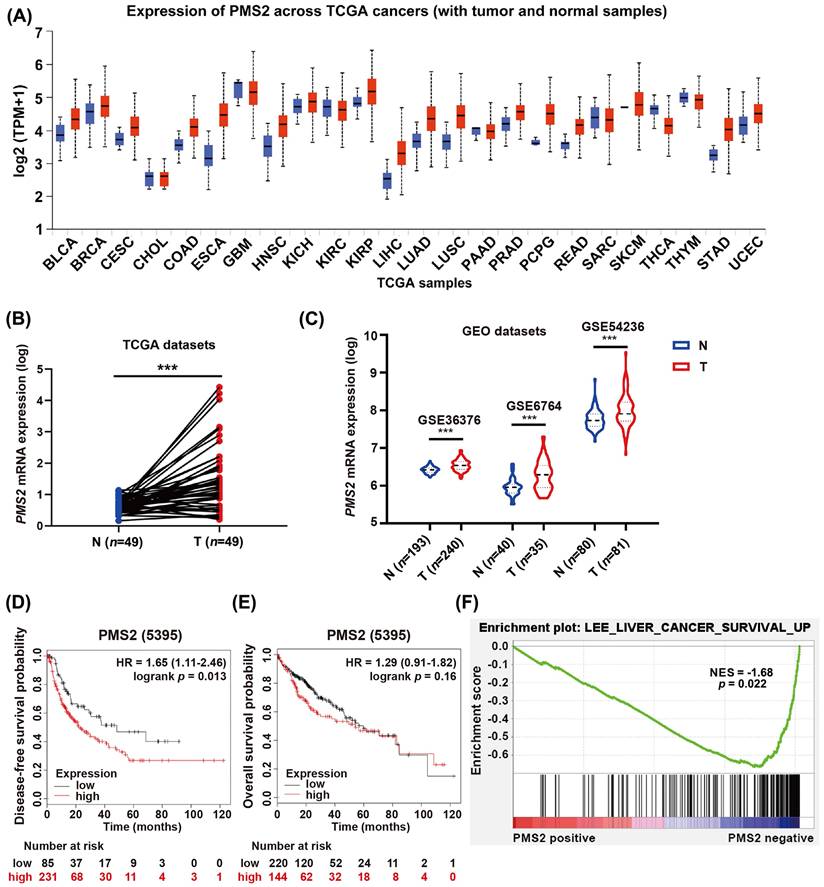
Next, we explored the clinical significance of PMS2 elevation in HCC according to survival data acquired from the Kaplan-Meier database (http://www.kmplot.com). Patients with low PMS2 levels had longer DFS compared to those with high PMS2 levels [HR = 1.65 (1.11-2.46), p = 0.013; Figure 1D], whereas the difference in OS between the two groups was not statistically significant [HR = 1.29 (0.91-1.82), p = 0.160; Figure 1E]. Further, GSEA based on GSE116174 mRNA data indicated that high PMS2 expression was negatively associated with good survival in HCC (p = 0.022, Figure 1F).
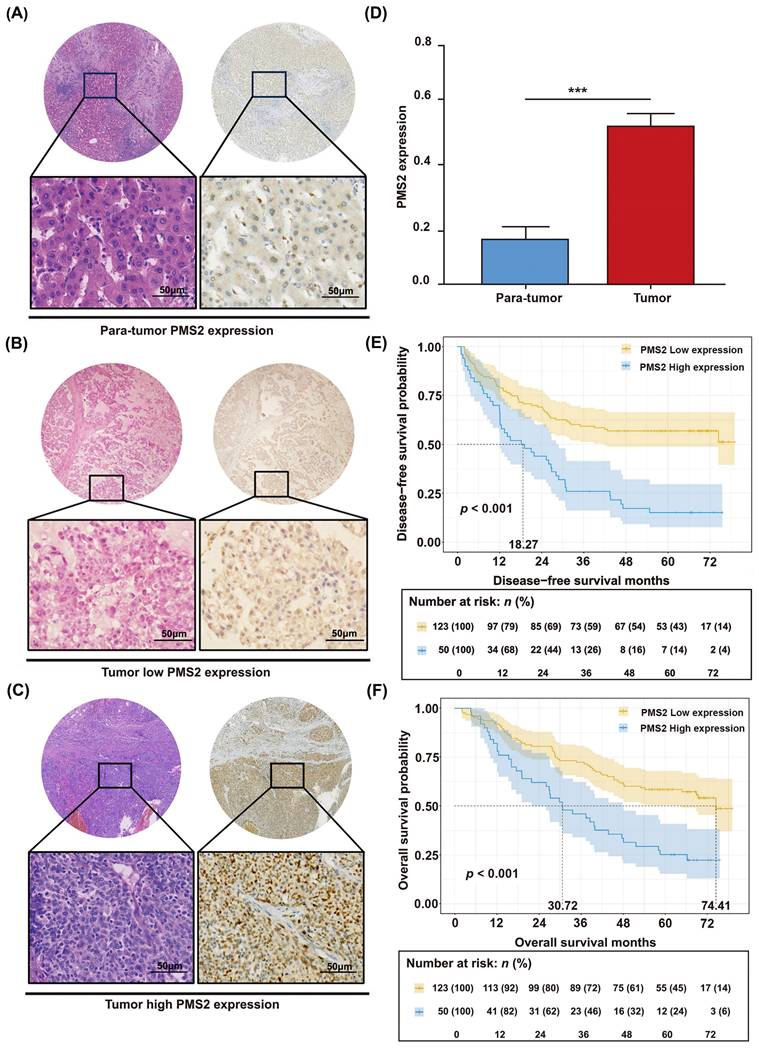
The unique relationship between the expression of PMS2 and HCC prognosis was validated in another HCC cohort. IHC staining was conducted on a set of tissue microarrays, comprising 173 pairs of HCC tumor tissues and adjacent normal tissues. PMS2 expression was dramatically increased in most HCC tumor tissues (p < 0.001), and the positive expression of PMS2 was mainly localized to the nucleus (Figures 2A-D). Separate analysis revealed that 123 of the 173 patients (71%) showed low PMS2 staining and 50 patients (29%) exhibited high staining. Subsequently, survival analysis was performed according to PMS2 staining to construct Kaplan-Meier curves. To further determine whether PMS2 expression is an independent risk factor, we performed univariate and multivariate Cox regression analyses. Consistent with the Kaplan-Meier observations, the multivariate analysis confirmed that high PMS2 immunostaining in HCC tissues was an independent risk factor for poor prognosis (Table 1). As expected, high PMS2 expression was associated with early recurrence (p < 0.001) and short OS (p < 0.001) according to our 5-year follow-up data (Figures 2E, F). Consistently, the median DFS and OS of patients with HCC and high PMS2 expression were 18.27 months (± 9.76) and 30.72 months (± 11.92), respectively, which were significantly shorter than those in the low PMS2 expression group (median DFS: not reached; median OS: 74.41 months). Therefore, we suggest that the abnormal elevation of PMS2 might serve as an indicator of poor prognosis in patients with HCC.
Immunohistochemical analysis of PMS2 expression in HCC and its prognostic significance. (A) IHC staining of PMS2 in tumor-adjacent normal tissues. (B) Low expression of PMS2 in HCC tissues. (C) High expression of PMS2 in HCC tissues. (D) Stacked column chart showing the differential expression of PMS2 between HCC tissues and adjacent normal tissues. (E, F) Kaplan-Meier survival analysis conducted for DFS and OS of patients with HCC based on PMS2 expression levels. Scale bars represent 50 μm. PMS2, post-meiotic segregation increased 2; HCC, hepatocellular carcinoma; IHC, immunohistochemistry; DFS, disease-free survival; OS, overall survival; ***p < 0.001.
Univariate and multivariate analysis of prognostic factors associated with OS and DFS in 173 HCC patients.
| HCC patients (n=173) | DFS | OS | ||||||||||
|---|---|---|---|---|---|---|---|---|---|---|---|---|
| Univariate Analysis | Multivariate Analysis | Univariate Analysis | Multivariate Analysis | |||||||||
| HR | 95% CI | p-value | HR | 95% CI | p -value | HR | 95% CI | p-value | HR | 95% CI | p -value | |
| Age (years) ≥55/<55 | 1.023 | 0.682-1.533 | 0.913 | 0.949 | 0.630-1.429 | 0.800 | ||||||
| Sex male/female | 1.078 | 0.645-1.799 | 0.775 | 1.164 | 0.696-1.948 | 0.562 | ||||||
| HBV Y/N | 0.930 | 0.563-1.537 | 0.778 | 0.953 | 0.575-1.578 | 0.852 | ||||||
| HCV Y/N | 0.709 | 0.175-2.878 | 0.631 | 1.125 | 0.356-3.558 | 0.841 | ||||||
| AFP (ng/ml) | 1.000 | 1.000-1.000 | 0.934 | 1.000 | 1.000-1.000 | 0.867 | ||||||
| Histological grade | 1.600 | 1.024-2.500 | 0.020* | 1.729 | 1.098-2.722 | 0.018* | 1.984 | 1.271-3.097 | 0.003* | 2.262 | 1.431-3.576 | <0.001* |
| Satellite nodule Y/N | 1.246 | 0.830-1.870 | 0.289 | 1.030 | 0.684-1.552 | 0.887 | ||||||
| Tumor size (cm) >5/≤5 | 0.799 | 0.534-1.196 | 0.276 | 0.846 | 0.563-1.273 | 0.423 | ||||||
| Cirrhosis Y/N | 1.099 | 0.732-1.650 | 0.649 | 1.077 | 0.713-1.625 | 0.725 | ||||||
| MaVI Y/N | 1.920 | 1.088-3.390 | 0.024* | 1.027 | 0.412-2.559 | 0.954 | 1.831 | 1.017-3.295 | 0.044* | 0.937 | 0.366-2.396 | 0.892 |
| MVI Y/N | 1.123 | 0.746-1.691 | 0.579 | 1.148 | 0.756-1.744 | 0.518 | ||||||
| BCLC stage 0&A/B&C | 1.901 | 1.170-3.087 | 0.009* | 2.635 | 1.156-5.992 | 0.021* | 1.837 | 1.119-3.015 | 0.016* | 2.821 | 1.228-6.482 | 0.015* |
| Lymph node metastasis Y/N | 1.197 | 0.167-8.593 | 0.858 | 1.233 | 0.172-8.865 | 0.835 | ||||||
| Ki-67 high/low | 1.719 | 1.147-2.575 | 0.009* | 1.182 | 0.769-1.817 | 0.445 | 1.588 | 1.055-2.390 | 0.027* | 1.093 | 0.707-1.691 | 0.688 |
| p-AKT high/low | 1.475 | 0.940-2.314 | 0.091 | 2.201 | 1.304-3.715 | 0.003* | 1.671 | 1.043-2.678 | 0.033* | 2.635 | 1.516-4.579 | 0.001* |
| PMS2 high/low | 2.673 | 1.778-4.018 | <0.001* | 3.109 | 2.019-4.786 | <0.001* | 2.707 | 1.797-4.078 | <0.001* | 3.189 | 2.036-4.994 | <0.001* |
Abbreviation: OS, overall survival; DFS, disease-free survival; HCC, hepatocellular carcinoma; HR, hazard ratio; CI, confidence interval; Y, yes; N, no; HBV, hepatitis B virus; HCV, hepatitis C virus; AFP, alpha-fetoprotein; MaVI, macrovascular invasion; MVI, microvascular invasion; BCLC, Barcelona Clinic Liver Cancer; p-AKT, phosphorylated-protein kinase B; PMS2, Postmeiotic Segregation Increased 2.
3.2 Overexpression of PMS2 in HCC promoted HCC cell proliferation in vitro and in vivo
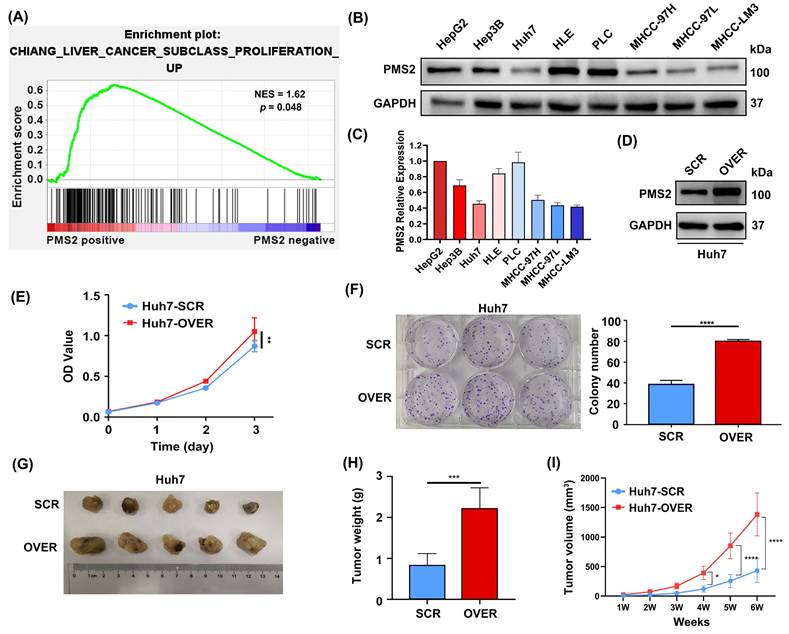
GSEA based on mRNA data from GSE36376 was performed to investigate the biological functions of PMS2 in HCC progression and recurrence. The data indicated that the expression of PMS2 was positively associated with proliferation (p = 0.048, Figure 3A), which is consistent with our data (Table 2) showing that the expression of PMS2 is significantly positively correlated with the expression of Ki-67. Subsequently, we determined PMS2 expression levels in eight HCC cell lines and found that the expression of PMS2 was relatively low in Huh7, MHCC-97L, and MHCC-LM3 cells compared to the other five cell lines (Figures 3B, C). Huh7 cells were selected to establish a stable overexpression cell line and the efficiency of PMS2 overexpression was confirmed using western blotting (Figure 3D). As expected, CCK-8 and clone formation assays in Huh7 cells demonstrated that elevated expression of PMS2 significantly promoted HCC cell proliferation in vitro (Figures 3E, F). To further investigate the role of PMS2 in tumorigenesis in vivo, non-obese diabetic (NOD)-severe combined immunodeficiency (SCID) nude mice were subcutaneously implanted with PMS2/SCR and PMS2/OVER cells (5×10⁶ cells per mouse, with five mice in each group). After six weeks, all mice from both groups were sacrificed for the assessment of tumor volume and weight. Notably, PMS2 overexpression in Huh7 cells also accelerated tumorigenesis in vivo (Figures 3G, H, I). Overall, both in vitro and in vivo data demonstrate that the abnormal elevation of PMS2 expression increases HCC cell malignancy by promoting tumor cell proliferation.
Overexpression of PMS2 promotes HCC cell proliferation in vitro and tumorigenesis in vivo. (A) GSEA data demonstrates a positive association between PMS2 expression and cell proliferation. (B, C) WB analysis illustrates PMS2 expression levels across eight HCC cell lines, with Huh7, MHCC-97L, and MHCC-LM3 exhibiting relatively lower expression. (D) WB confirms efficient PMS2 overexpression in Huh7 cells. (E) CCK-8 assays compare cell proliferation between the PMS2/over and SCR groups. (F) Clone formation assays were performed in the PMS2/over and SCR groups. (G) Images of tumors from NOD-SCID nude mice in both the SCR and PMS2/over groups. (H) The tumor weight comparison between the two groups. (I) The tumor volume in the two groups was measured weekly. PMS2, post-meiotic segregation increased 2; HCC, hepatocellular carcinoma; GSEA, Gene Set Enrichment Analysis; WB, western blotting; CCK-8, cell counting kit-8; PMS2/over, PMS2 overexpression; SCR, scramble control; *p < 0.05, **p < 0.01, ***p < 0.001, ****p < 0.0001.
Clinicopathological characteristics of patients in the Neoadjuvant therapy group.
| Characteristics | Neoadjuvant therapy group | |
|---|---|---|
| Age (years) | ||
| ≥ 55 | 20 | |
| < 55 | 13 | |
| Sex | ||
| Male | 28 | |
| Female | 5 | |
| PMS2 expression | ||
| High | 15 | |
| Low | 18 | |
| p-AKT expression | ||
| High | 21 | |
| Low | 12 | |
| Tumor size (cm) | ||
| ≥ 5 | 6 | |
| < 5 | 27 | |
| AFP (ng/ml) | ||
| ≥ 400 | 4 | |
| < 400 | 29 | |
| BCLC stage | ||
| 0&A | 32 | |
| B&C | 1 | |
| Histological grade | ||
| High/Median | 23 | |
| Low | 10 |
Abbreviation: PMS2, Postmeiotic Segregation Increased 2; p-AKT, phosphorylated-protein kinase B; AFP, alpha-fetoprotein; BCLC, Barcelona Clinic Liver Cancer.
3.3 The prognostic impact of PMS2 expression and other clinicopathological features in HCC
Considering the role of PMS2 in promoting HCC progression in vitro and in vivo, as demonstrated by the aforementioned experimental studies, we further investigated the prognostic impact of PMS2 protein immunostaining and other clinicopathological features in 173 HCC patients (Table 1). The results showed that univariate analysis using DFS as the outcome variable identified the following variables with p-values < 0.157: PMS2 expression level [HR: 2.673 (1.778-4.018), p < 0.001], p-AKT expression level [HR: 1.475 (0.940-2.314), p = 0.091], Ki-67 expression level [HR: 1.719 (1.147-2.575), p = 0.009], macrovascular invasion [HR: 1.920 (1.088-3.390), p = 0.024], BCLC stage [HR: 1.901 (1.170-3.087), p = 0.009], and histological grade [HR: 1.600 (1.024-2.500), p = 0.020]. These variables were included in the multivariate analysis. The results identified high PMS2 expression [HR: 3.109 (2.019-4.786), p < 0.001], high p-AKT expression [HR: 2.201 (1.304-3.715), p = 0.003], BCLC stage [HR: 2.635 (1.156-5.992), p = 0.021], and poor pathological differentiation [HR: 1.729 (1.098-2.722), p = 0.018] as independent risk factors for DFS.
Univariate analysis using OS as the outcome variable identified the following variables with p-values < 0.157: PMS2 expression level [HR: 2.707 (1.797-4.078), p < 0.001], p-AKT expression level [HR: 1.671 (1.043-2.678), p = 0.033], Ki-67 expression level [HR: 1.588 (1.055-2.390), p = 0.027], macrovascular invasion (MVI) [HR: 1.831 (1.017-3.295), p = 0.044], BCLC stage [HR: 1.837 (1.119-3.015), p = 0.016], and histological grade [HR: 1.984 (1.271-3.097), p = 0.003]. These variables were incorporated into the multivariate analysis. High PMS2 expression [HR: 3.189 (2.036-4.994), p < 0.001], high p-AKT expression [HR: 2.635 (1.516-4.579), p = 0.001], BCLC stage [HR: 2.821 (1.228-6.482), p = 0.015], and poor pathological differentiation [HR: 2.262 (1.431-3.576), p < 0.001] were also confirmed as independent risk factors for OS. These findings are consistent with those of previous studies, indicating that a low histological grade and an advanced BCLC stage are considered the most critical independent risk factors for poor prognosis in HCC [25].
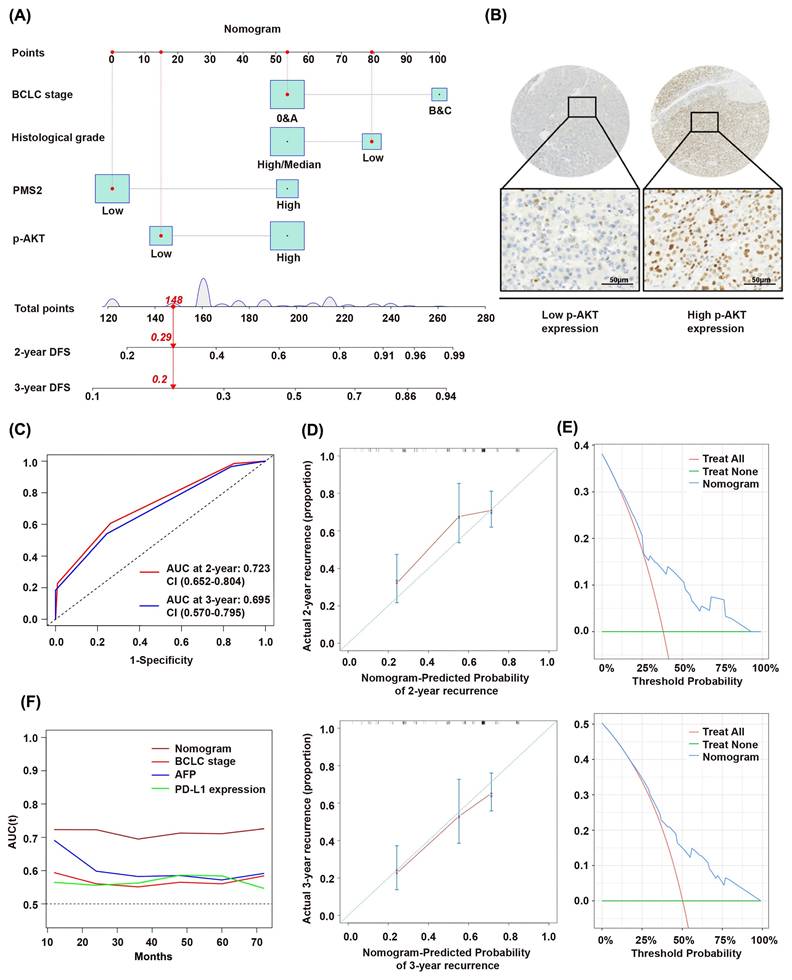
Considering that other diseases, unexpected events, and different treatments received after recurrence frequently affect overall survival, we established a prognostic model using DFS as the outcome variable based on the multivariate analysis results (Figure 4A). This model incorporated PMS2 expression, p-AKT expression (Figure 4B), BCLC stage, and histological grade. The model is presented as a nomogram for predicting DFS. The time-dependent receiver operating characteristic (ROC) curves demonstrated AUC values of 0.723 (0.652-0.804) and 0.695 (0.570-0.795) for 2- and 3-year DFS predictions, respectively (Figure 4C). This indicates that the prediction model has good discriminatory power and can effectively predict patient prognostic risk. Calibration curves indicated high concordance between nomogram-predicted probabilities and actual outcomes (Figure 4D). Decision curve analysis (DCA) further confirmed favorable clinical utility of the nomogram (Figure 4E). The nomogram demonstrates a higher AUC value compared to traditional staging and predictive indicators, such as the BCLC stage, AFP level, and PD-L1 expression (Figure 4F).
Prognostic impact of PMS2 expression and other clinicopathological features in HCC. (A) Nomogram for predicting 2- and 3-year disease-free survival. (B) Representative IHC staining images showing high and low p-AKT expression in HCC tissues. (C) ROC curves for 2-year and 3-year recurrence prediction. (D) Calibration plots for 2-year and 3-year disease-free survival. (E) DCA results for 2-year and 3-year recurrence. (F) Time-dependent AUC curves of the nomogram and conventional indicators (BCLC stage, AFP, and PD-L1). PMS2, post-meiotic segregation increased 2; HCC, hepatocellular carcinoma; p-AKT, phosphorylated AKT; DFS, disease-free survival; BCLC, Barcelona Clinic Liver Cancer; ROC, Receiver Operating Characteristic Curve; DCA, Decision Curve Analysis.
3.4 Stratification of HCC patients based on the nomogram results
Based on a nomogram score cutoff of 180 points, the cohort was stratified into high-risk and low-risk groups. Survival curve analysis revealed significantly worse prognosis in the high-risk group compared to that in the low-risk group (p < 0.001; Figure 5A). To further investigate the clinical utility of the nomogram, we collected data from 33 patients with HCC who received preoperative neoadjuvant immunotherapy (Table 2). However, when stratifying these neoadjuvant-treated patients using the same nomogram score, no significant survival difference was observed between the high-risk and low-risk groups (p = 0.830; Figure 5B). This suggests that neoadjuvant therapy exerted differential effects between the two groups, leading to this outcome.
Stratification of HCC patients based on nomogram. (A) Kaplan-Meier curves between the low-risk group and the high-risk group in the non-neoadjuvant therapy group. (B) Kaplan-Meier curves between the low-risk group and the high-risk group in the neoadjuvant therapy group. (C) Comparison of survival curves between low-risk patients who received neoadjuvant therapy and those who did not. (D) Comparison of survival curves between high-risk patients who received neoadjuvant therapy and those who did not.
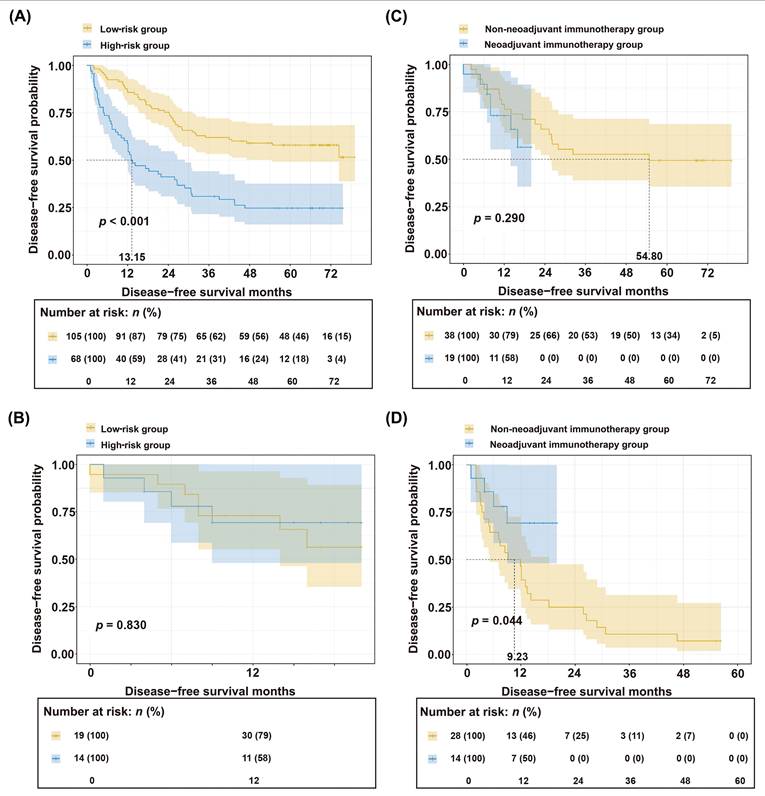
To further investigate the differential benefits of neoadjuvant therapy across patient subgroups, we first stratified the entire cohort of 206 patients (33 who received preoperative neoadjuvant immunotherapy and 173 who underwent direct surgery) into high-risk and low-risk strata based on preoperative indicators. Then, within each risk stratum, patients were further subdivided into treated and untreated subgroups based on their receipt of neoadjuvant therapy. Independent PSM was then performed to balance clinicopathological characteristics within each risk stratification (Tables 3, 4). Survival analysis demonstrated no significant difference between the treated and untreated subgroups in the low-risk group (p = 0.290; Figure 5C). In contrast, the high-risk group showed significantly improved survival with neoadjuvant therapy compared to untreated controls (p = 0.044; Figure 5D).
Clinicopathological characteristics of patients in the low-risk group after PSM: Neoadjuvant therapy versus upfront surgery.
| Characteristics | Total | Neoadjuvant therapy group | non-neoadjuvant therapy group | R | p -value | |
|---|---|---|---|---|---|---|
| 57 | ||||||
| Age (years) | 1.746 | 0.186 | ||||
| ≥55 | 32 | 13 | 19 | |||
| <55 | 25 | 6 | 19 | |||
| Sex | 0.148 | 0.700 | ||||
| Male | 48 | 15 | 33 | |||
| Female | 9 | 4 | 5 | |||
| PMS2 expression | 2.562 | 0.109 | ||||
| High | 10 | 6 | 4 | |||
| Low | 47 | 13 | 34 | |||
| p-AKT expression | 2.369 | 0.124 | ||||
| High | 35 | 9 | 26 | |||
| Low | 22 | 10 | 12 | |||
| Tumor size (cm) | 0.018 | 0.893 | ||||
| ≥ 5 | 8 | 2 | 6 | |||
| < 5 | 49 | 17 | 32 | |||
| AFP (ng/ml) | 0.020 | 0.887 | ||||
| ≥ 400 | 7 | 3 | 4 | |||
| < 400 | 50 | 16 | 34 | |||
| BCLC stage | 1.000 | |||||
| 0&A | 56 | 19 | 37 | |||
| B&C | 1 | 0 | 1 | |||
| Histological grade | 1.000 | |||||
| High/Median | 56 | 19 | 37 | |||
| Low | 1 | 0 | 1 |
Abbreviation: PMS2, Postmeiotic Segregation Increased 2; p-AKT, phosphorylated-protein kinase B; AFP, alpha-fetoprotein; BCLC, Barcelona Clinic Liver Cancer.
Clinicopathological characteristics of patients in the high-risk group after PSM: Neoadjuvant therapy versus upfront surgery.
| Characteristics | Total | Neoadjuvant therapy group | Non-neoadjuvant therapy group | R | p-value | |
|---|---|---|---|---|---|---|
| 42 | ||||||
| Age (years) | 0.000 | 1.000 | ||||
| ≥ 55 | 21 | 7 | 14 | |||
| < 55 | 21 | 7 | 14 | |||
| Sex | 0.536 | 0.464 | ||||
| Male | 35 | 13 | 22 | |||
| Female | 7 | 1 | 6 | |||
| PMS2 expression | 0.438 | 0.508 | ||||
| High | 24 | 9 | 15 | |||
| Low | 18 | 5 | 13 | |||
| p-AKT expression | 0.000 | 1.000 | ||||
| High | 37 | 12 | 25 | |||
| Low | 5 | 2 | 3 | |||
| Tumor size (cm) | 1.750 | 0.186 | ||||
| ≥ 5 | 18 | 4 | 14 | |||
| < 5 | 24 | 10 | 14 | |||
| AFP (ng/ml) | 1.985 | 0.159 | ||||
| ≥ 400 | 10 | 1 | 9 | |||
| < 400 | 32 | 13 | 19 | |||
| BCLC stage | 0.536 | 0.464 | ||||
| 0&A | 35 | 13 | 22 | |||
| B&C | 7 | 1 | 6 | |||
| Histological grade | 1.235 | 0.266 | ||||
| High/Median | 17 | 4 | 13 | |||
| Low | 25 | 10 | 15 |
Abbreviation: PMS2, Postmeiotic Segregation Increased 2; p-AKT, phosphorylated-protein kinase B; AFP, alpha-fetoprotein; BCLC, Barcelona Clinic Liver Cancer.
In this exploratory analysis, a differential pattern of survival benefit was observed between risk strata. Within the limitations of a small sample size, neoadjuvant therapy was associated with significantly improved survival in the high-risk stratum but not in the low-risk stratum. These preliminary observations suggest the hypothesis that patients stratified as high-risk by our model might derive greater benefit from neoadjuvant immunotherapy. However, given the limited cohort size (n = 33) and the exploratory nature of this comparison, these results require cautious interpretation and validation in larger, prospective studies before any clinical implications can be drawn.
4. Discussion
A significant challenge in HCC management is the imprecise postoperative risk stratification and ineffective interventions, which are associated with early recurrence and poor long-term survival [26, 27]. Similarly, refining patient selection for neoadjuvant therapy is critical. Consequently, identifying novel biomarkers to accurately predict prognosis and direct treatment strategies is an urgent necessity. While MMR deficiency is well characterized, the significance of overexpression of MMR components remains uncertain. In the present study, analyses of TCGA and GEO datasets showed that the expression of PMS2 in HCC tumor tissues was significantly higher than that in corresponding adjacent tissues, correlating with significantly shorter survival times. Our study involving 173 patients with HCC found that high PMS2 expression was significantly associated with poor prognosis, with shorter median DFS and OS compared to low PMS2 expression cases. These findings align with previous reports, where high PMS2 expression was identified as an independent prognostic factor in multivariate survival analyses of esophageal and oral squamous cell carcinoma [28]. However, previous research indicates that PMS2 overexpression exhibits paradoxical roles in malignant tumor progression, both across and within cancer types. For instance, studies have shown that elevated PMS2 levels in pre-neoplastic and cancerous lesions are associated with poor outcomes in prostate cancer [29, 30]; however, subsequently, Fukuhara et al. reported PMS2 decreases prostate cancer cell proliferation both in vitro and in vivo [31]. Similarly, Raza et al. found that reduced PMS2 expression is associated with early H. pylori-induced gastric cancer progression [32]. Taken together, these results indicate that the role of PMS2 may be highly context-specific to tumor type and remains subject to ongoing debate, warranting further investigation.
To explore the mechanisms by which PMS2 promotes poor prognosis in HCC, we performed GSEA, which indicated a positive correlation between PMS2 expression and cell proliferation. This observation was consistent with our observation of a significant link between PMS2 and Ki-67 expression. In vitro experiments were conducted to explore the potential association between PMS2 and HCC cell proliferation. These experiments lend preliminary support to the conclusion that increased PMS2 expression significantly promoted the proliferation of liver cancer cells in vitro and enhanced the proliferation of transplanted tumors in NOD-SCID nude mice. A previous study demonstrated that PMS2 overexpression disrupts cytotoxic signaling pathways, interacts non-productively with apoptotic factors, and increases tolerance to DNA damage [33]. Additionally, PMS2 overexpression can lead to genomic instability, disruption of the MMR pathway, and an increased risk of carcinogenesis and tumor progression [33, 34]. Our results suggest that abnormally high PMS2 expression promotes tumor cell proliferation both in vitro and in vivo, thereby contributing to HCC progression. Based on these findings, we hypothesized that PMS2 overexpression leads to genomic instability, leading to abnormal repair and proliferation of HCC cells; however, the specific mechanism requires further investigation.
AKT, a critical protein kinase and key downstream effector of PI3K, forms the core of the PI3K/AKT signaling pathway. Its phosphorylated active form, p-AKT, promotes tumor malignancy by facilitating neovascularization, invasion, and metastasis. Aberrant activation and overexpression of p-AKT are closely linked to tumor initiation and progression [35, 36]. Our previous research demonstrated the significant role of the PI3K/AKT signaling pathway activation in HCC cell proliferation and metastasis [17]. In the present study, we found that both high PMS2 and p-AKT expression levels were independent risk factors affecting prognosis, suggesting that combining PMS2 and p-AKT provides greater predictive benefits than using either marker alone. However, a previous study reported that activated AKT in ovarian cancer cell lines can bind directly to PMS2, leading to PMS2 degradation [18]. While both PMS2 overexpression and AKT pathway activation are subject to complex regulatory mechanisms, the specific interplay between them in HCC remains to be fully elucidated. The results of our multivariate Cox regression analysis indicated that high PMS2 expression, high p-AKT expression, BCLC stage, and histological grade were independent risk factors for DFS and OS.
Based on analyses of TCGA and GEO datasets, this study integrated clinical data, pathological evaluation, and functional experimental evidence to develop a predictive model incorporating molecular markers (PMS2, p-AKT) and clinical indicators (BCLC stage, differentiation grade). The resulting nomogram not only enables accurate prognostic risk stratification but, more importantly, identifies high-risk patients who are likely to benefit significantly from neoadjuvant immunotherapy. Moreover, the nomogram demonstrates a higher predictive accuracy, reflected by a higher AUC value, compared to traditional staging and predictive indicators such as BCLC stage, AFP level, and PD-L1 expression, indicating significant potential for clinical translation. Advances in immunotherapy have established a promising neoadjuvant strategy for HCC. However, suboptimal responses to neoadjuvant immunotherapy may delay definitive surgical intervention in some patients. Thus, appropriate patient selection is critical for optimizing outcomes within this therapeutic paradigm. Although some studies suggest that dMMR tumors exhibit increased sensitivity to immunotherapy [37, 38], there are currently no established screening tools to identify ideal candidates for neoadjuvant immunotherapy. In our analysis of the neoadjuvant cohort, no significant survival difference was observed between high- and low-risk patients as stratified by the nomogram. However, further analysis revealed that neoadjuvant therapy significantly improved survival outcomes specifically in the high-risk population, whereas no substantial benefit was detected in the low-risk group. This finding suggests that neoadjuvant treatment effectively improved the prognosis of high-risk patients, bringing their survival outcomes closer to those of the low-risk group and thereby largely abrogating the initial inter-group difference. This observation aligns with the subsequent propensity score matching analysis, which demonstrated significant survival improvement in high-risk patients receiving neoadjuvant therapy. Together, these results highlight the potential of the proposed model not only effectively identifies high-risk patients with poor prognosis but, more importantly, may further refine the selection of individuals most likely to derive benefit from neoadjuvant immunotherapy. Collectively, these findings indicate that biomarkers such as PMS2 expression, p-AKT expression, tumor differentiation status, and BCLC stage can be utilized to identify patients who are most likely to benefit from neoadjuvant therapy. This approach facilitates tailored treatment strategies and optimizes therapeutic outcomes for HCC patients.
This study has several important limitations. First, the relatively small sample size of the neoadjuvant therapy cohort (n = 33) limited the statistical power of the subgroup analyses following risk stratification, thereby increasing the potential for statistical instability. Second, the exclusive use of a single immunotherapeutic agent (tislelizumab) and the retrospective nature of the study design may restrict the generalizability of the findings. Therefore, the observed differences in therapeutic outcomes between risk groups should be interpreted strictly as preliminary and hypothesis-generating observations, intended primarily to provide a rationale for future investigations rather than to inform current clinical decision-making. Future studies should prioritize well-designed prospective, multi-center randomized controlled trials incorporating standardized treatment protocols and long-term follow-up. Such studies will be essential to further validate the predictive performance of our model and to determine its applicability across diverse immunotherapeutic strategies.
In conclusion, our study suggests that high PMS2 expression is significantly associated with shorter DFS and OS in HCC patients. We further revealed that aberrant upregulation of PMS2 promotes tumor cell proliferation both in vitro and in vivo. Based on high PMS2 expression, elevated p-AKT levels, BCLC stage, and histological grade, we developed a nomogram for predicting DFS. The model demonstrated promising predictive performance in this study, effectively stratifying patients into distinct risk categories and providing preliminary, hypothesis-generating data identifying those who might benefit from neoadjuvant therapy. Collectively, these findings indicate that high PMS2 expression serves not only as a potential prognostic biomarker but also as a target worthy of further exploration. Within a multidisciplinary team (MDT) setting, collaboration with pathology departments could enable routine PMS2 IHC testing on biopsy samples alongside conventional diagnostics. The resulting data, integrated into our predictive model, may help identify patients suitable for direct surgery or those who could be considered for neoadjuvant therapy in the context of clinical trials, potentially paving the way for more refined diagnostic and therapeutic approaches in HCC.
Acknowledgements
We extend our gratitude to the patients and surgeons at the Tianjin Medical University Cancer Institute and Hospital for their invaluable contributions to this study. Special thanks go to L.C., who would like to express appreciation to the National Center for Global Health and Medicine of Japan for enhancing his skills in various areas and for financially supporting his research through the International Hepato-Pancreato-Biliary Association (IHPBA) 2023/2024 Kenneth Warren Fellowship.
Funding
This work was supported by grants from the National Natural Science Foundation of China (82203423 to W.G., 82373365 to L.C., 82472991 to X.T. and 82403771 to Y.X.), Joint Funds of the Natural Science Foundation Tianjin (No.25JCLMJC00720 to L.C.), Special Project for Collaborative Innovation in Beijing-Tianjin-Hebei (25242602D to L.C.), Natural Science Foundation of Tianjin (23JCYBJC00600 to X.T.), The Science & Technology Development Fund of Tianjin Education Commission for Higher Education (2023KJ079 to L.C.), and Tianjin Key Medical Discipline Construction Project (TJYXZDXK-3-003A and -016C).
Data availability
The study's original contributions are comprehensively documented in the article. For any additional inquiries or clarifications, interested parties may contact the corresponding authors directly.
Author contributions
Tian XD, Chen L, Gong WC, and Han RY designed research; Tian XD, Chen L, Gong WC, Han RY, Sun LY, Gao YR, Han ZQ, Wang YM, Xia YR, and Wei YK performed research; Gao YR, Gong WC, Sun LY, Wang YM, Xia YR, Wei YK, Song TQ, and Tian XD analyzed data; Chen L, Gong WC, Han RY, Sun LY, and Gao YR wrote the paper; Gong WC, Chen L, Tian XD, and Xia YR obtained funding. All authors read and approved the final manuscript. Gong WC, Han RY, Sun LY and Gao YR contributed equally to this work as co-first authors.
Ethics approval
The human component of this study involving patient participation was approved by the Ethics Committee of Tianjin Medical University Cancer Institute and Hospital (Approval No. bc20240059) in accordance with the Declaration of Helsinki. The animal experiments were approved by the same ethics committee (Approval No. LLSP2019-030) in accordance with NIH Guidelines for Animal Research.
Competing Interests
The authors have declared that no competing interest exists.
References
1. Rumgay H, Arnold M, Ferlay J, Lesi O, Cabasag CJ, Vignat J. et al. Global burden of primary liver cancer in 2020 and predictions to 2040. Journal of hepatology. 2022;77:1598-606
2. Donne R, Lujambio A. The liver cancer immune microenvironment: Therapeutic implications for hepatocellular carcinoma. Hepatology. 2023;77:1773-96
3. Chen S, Huang C, Liao G, Sun H, Xie Y, Liao C. et al. Distinct single-cell immune ecosystems distinguish true and de novo HBV-related hepatocellular carcinoma recurrences. Gut. 2023;72:1196-210
4. Calderaro J, Di Tommaso L, Maillé P, Beaufrère A, Nguyen CT, Heij L. et al. Nestin as a diagnostic and prognostic marker for combined hepatocellular-cholangiocarcinoma. Journal of hepatology. 2022;77:1586-97
5. Amodio V, Lamba S, Chilà R, Cattaneo CM, Mussolin B, Corti G. et al. Genetic and pharmacological modulation of DNA mismatch repair heterogeneous tumors promotes immune surveillance. Cancer cell. 2023;41:196-209.e5
6. Touat M, Li YY, Boynton AN, Spurr LF, Iorgulescu JB, Bohrson CL. et al. Mechanisms and therapeutic implications of hypermutation in gliomas. Nature. 2020;580:517-23
7. Chen PJ, Hussmann JA, Yan J, Knipping F, Ravisankar P, Chen PF. et al. Enhanced prime editing systems by manipulating cellular determinants of editing outcomes. Cell. 2021;184:5635-52.e29
8. Baretti M, Le DT. DNA mismatch repair in cancer. Pharmacology & therapeutics. 2018;189:45-62
9. Latham A, Srinivasan P, Kemel Y, Shia J, Bandlamudi C, Mandelker D. et al. Microsatellite Instability Is Associated with the Presence of Lynch Syndrome Pan-Cancer. Journal of clinical oncology: official journal of the American Society of Clinical Oncology. 2019;37:286-95
10. Bando H, Ohtsu A, Yoshino T. Therapeutic landscape and future direction of metastatic colorectal cancer. Nature reviews Gastroenterology & hepatology. 2023;20:306-22
11. Westcott PMK, Muyas F, Hauck H, Smith OC, Sacks NJ, Ely ZA. et al. Mismatch repair deficiency is not sufficient to elicit tumor immunogenicity. Nature genetics. 2023;55:1686-95
12. Marabelle A, Le DT, Ascierto PA, Di Giacomo AM, De Jesus-Acosta A, Delord JP. et al. Efficacy of Pembrolizumab in Patients with Noncolorectal High Microsatellite Instability/Mismatch Repair-Deficient Cancer: Results from the Phase II KEYNOTE-158 Study. Journal of clinical oncology: official journal of the American Society of Clinical Oncology. 2020;38:1-10
13. Norris AM, Gentry M, Peehl DM, D'Agostino R Jr, Scarpinato KD. The elevated expression of a mismatch repair protein is a predictor for biochemical recurrence after radical prostatectomy. Cancer epidemiology, biomarkers & prevention: a publication of the American Association for Cancer Research, cosponsored by the American Society of Preventive Oncology. 2009;18:57-64
14. Jiang D, Song Q, Wei X, Yu Z, Liu Y, Wang H. et al. PMS2 Expression with Combination of PD-L1 and TILs for Predicting Survival of Esophageal Squamous Cell Carcinoma. Frontiers in oncology. 2022;12:897527
15. Jia J, Wang Z, Cai J, Zhang Y. PMS2 expression in epithelial ovarian cancer is posttranslationally regulated by Akt and essential for platinum-induced apoptosis. Tumour biology: the journal of the International Society for Oncodevelopmental Biology and Medicine. 2016;37:3059-69
16. Jia J, Zhang Y, Cai J, Wang J, Ding H, Zhou J. et al. A novel function of protein kinase B as an inducer of the mismatch repair gene hPMS2 degradation. Cellular signalling. 2013;25:1498-504
17. Tewari D, Patni P, Bishayee A, Sah AN, Bishayee A. Natural products targeting the PI3K-Akt-mTOR signaling pathway in cancer: A novel therapeutic strategy. Seminars in cancer biology. 2022;80:1-17
18. Bu L, Zhang Z, Chen J, Fan Y, Guo J, Su Y. et al. High-fat diet promotes liver tumorigenesis via palmitoylation and activation of AKT. Gut. 2024;73:1156-68
19. Chen L, Liu D, Yi X, Qi L, Tian X, Sun B. et al. The novel miR-1269b-regulated protein SVEP1 induces hepatocellular carcinoma proliferation and metastasis likely through the PI3K/Akt pathway. Cell death & disease. 2020;11:320
20. Yin Z, Chen D, Liang S, Li X. Neoadjuvant Therapy for Hepatocellular Carcinoma. Journal of hepatocellular carcinoma. 2022;9:929-46
21. Zhao HT, Cai JQ. Chinese expert consensus on neoadjuvant and conversion therapies for hepatocellular carcinoma. World journal of gastroenterology. 2021;27:8069-80
22. Shen KY, Zhu Y, Xie SZ, Qin LX. Immunosuppressive tumor microenvironment and immunotherapy of hepatocellular carcinoma: current status and prospectives. Journal of hematology & oncology. 2024;17:25
23. Bareche Y, Kelly D, Abbas-Aghababazadeh F, Nakano M, Esfahani PN, Tkachuk D. et al. Leveraging big data of immune checkpoint blockade response identifies novel potential targets. Annals of oncology: official journal of the European Society for Medical Oncology. 2022;33:1304-17
24. Jia J, Ga L, Liu Y, Yang Z, Wang Y, Guo X. et al. Serine Protease Inhibitor Kazal Type 1, A Potential Biomarker for the Early Detection, Targeting, and Prediction of Response to Immune Checkpoint Blockade Therapies in Hepatocellular Carcinoma. Frontiers in immunology. 2022;13:923031
25. Trevisani F, Vitale A, Kudo M, Kulik L, Park JW, Pinato DJ. et al. Merits and boundaries of the BCLC staging and treatment algorithm: Learning from the past to improve the future with a novel proposal. Journal of hepatology. 2024;80:661-9
26. Han Z, Han R, Wang Y, Zhu K, Tian X, Chen P. et al. Sorafenib combined with TACE improves survival in patients with hepatocellular carcinoma with vascular invasion. Bioscience trends. 2024;18:457-64
27. Sim YK, Chong MC, Gandhi M, Pokharkar YM, Zhu Y, Shi L. et al. Real-World Data on the Diagnosis, Treatment, and Management of Hepatocellular Carcinoma in the Asia-Pacific: The INSIGHT Study. Liver Cancer. 2024;13:298-313
28. Decker JM, Filho OV, Freitas MO, Silva-Fernandes IJ, Dantas TS, Campêlo CS. et al. PMS2: a potential prognostic protein marker in oral squamous cell carcinoma. Medicina oral, patologia oral y cirugia bucal. 2021;26:e451-e8
29. Norris AM, Woodruff RD, D'Agostino RB Jr, Clodfelter JE, Scarpinato KD. Elevated levels of the mismatch repair protein PMS2 are associated with prostate cancer. The Prostate. 2007;67:214-25
30. Wilczak W, Rashed S, Hube-Magg C, Kluth M, Simon R, Büscheck F. et al. Up-regulation of mismatch repair genes MSH6, PMS2 and MLH1 parallels development of genetic instability and is linked to tumor aggressiveness and early PSA recurrence in prostate cancer. Carcinogenesis. 2017;38:19-27
31. Fukuhara S, Chang I, Mitsui Y, Chiyomaru T, Yamamura S, Majid S. et al. Functional role of DNA mismatch repair gene PMS2 in prostate cancer cells. Oncotarget. 2015;6:16341-51
32. Raza Y, Ahmed A, Khan A, Chishti AA, Akhter SS, Mubarak M. et al. Helicobacter pylori severely reduces expression of DNA repair proteins PMS2 and ERCC1 in gastritis and gastric cancer. DNA repair. 2020;89:102836
33. Gibson SL, Narayanan L, Hegan DC, Buermeyer AB, Liskay RM, Glazer PM. Overexpression of the DNA mismatch repair factor, PMS2, confers hypermutability and DNA damage tolerance. Cancer letters. 2006;244:195-202
34. Nicolaides NC, Littman SJ, Modrich P, Kinzler KW, Vogelstein B. A naturally occurring hPMS2 mutation can confer a dominant negative mutator phenotype. Molecular and cellular biology. 1998;18:1635-41
35. Revathidevi S, Munirajan AK. Akt in cancer: Mediator and more. Seminars in cancer biology. 2019;59:80-91
36. Song M, Bode AM, Dong Z, Lee MH. AKT as a Therapeutic Target for Cancer. Cancer research. 2019;79:1019-31
37. Svensson MC, Borg D, Zhang C, Hedner C, Nodin B, Uhlén M. et al. Expression of PD-L1 and PD-1 in Chemoradiotherapy-Naïve Esophageal and Gastric Adenocarcinoma: Relationship with Mismatch Repair Status and Survival. Frontiers in oncology. 2019;9:136
38. Zong L, Sun Z, Mo S, Lu Z, Yu S, Xiang Y. et al. PD-L1 expression in tumor cells is associated with a favorable prognosis in patients with high-risk endometrial cancer. Gynecologic oncology. 2021;162:631-7
Author contact
![]() Corresponding authors: Xiangdong Tian and Lu Chen, Tianjin Medical University Cancer Institute and Hospital, West HuanHu Road, Ti Yuan Bei, Hexi District, Tianjin 300060, China; E-mail: xiangdongtianedu.cn; chenluedu.cn.
Corresponding authors: Xiangdong Tian and Lu Chen, Tianjin Medical University Cancer Institute and Hospital, West HuanHu Road, Ti Yuan Bei, Hexi District, Tianjin 300060, China; E-mail: xiangdongtianedu.cn; chenluedu.cn.