Impact Factor ISSN: 1837-9664

 Global reach, higher impact
J Cancer 2010; 1:14-22. doi:10.7150/jca.1.14 This volume Cite
Research Paper
Tumor Suppressor RARRES1 Regulates DLG2, PP2A, VCP, EB1, and Ankrd26
Ziad J. Sahab1, Michael D. Hall1, Lihua Zhang2, Amrita K. Cheema2, Stephen W. Byers1 ![]()
1. Georgetown University Medical Center, Lombardi Comprehensive Cancer Center, Department of Oncology, Washington, DC, 20007, USA;
2. Proteomics and Metabolomics Shared Resource, Lombardi Comprehensive Cancer Center, Washington, DC 20007, USA
Published 2010-6-2
Abstract
Retinoic Acid Receptor Responder (RARRES1) initially identified as a novel retinoic acid receptor regulated gene in the skin is a putative tumor suppressor of unknown function. RARRES1 was knocked down in immortalized human prostatic epithelial cell line PWR-1E cells and differential protein expression was identified using differential in-gel electrophoresis (DIGE) followed by matrix-assisted laser desorption ionization (MALDI) mass spectrometry and western Blot analysis excluding highly abundant proteins routinely identified in almost all proteomics projects. Knock-down of RARRES1: 1- down-regulates PP2A, an enzyme involved in the negative regulation of the growth hormone-stimulated signal transduction pathways; 2- down-regulates Valosin-containing protein causing impaired autophagy; 3- up-regulates the tumor suppressor disks large 2; 4- up-regulates Ankrd26 that belongs to the POTE family of genes that are highly expressed in cancer patients with poor outcome; and 5- down-regulates EB1, a protein that is involved in spindle dynamics and chromosome alignment during mitosis.
Keywords: Retinoic Acid Receptor Responder, RARRES1, tumor suppressor
1. Introduction
Retinoic acids (RA) are ligands which signal through a family of six nuclear ligand-activated receptors, termed retinoic acid receptors (RARα, β, and γ) and retinoid X receptors (RXRα, β, and γ) (1). These receptors form RXR/RXR homodimers or RAR/RXR heterodimers and bind to retinoic acid response elements (RARE) in DNA (1, 2). In the absence of RA, the RAR/RXR heterodimers bind to RARE and mediate a transcriptional repression of target genes (3). In contrast, when stimulated with physiological levels of RA, the ligand binding induces a conformational change in the dimer and causes a release of the corepressor complex and a subsequent recruitment of transcriptional coactivators, thereby stimulating transcription of target genes such as HOX family members. Interestingly, RXRs have proven quite promiscuous, having been shown to facilitate binding of thyroid hormone receptor (TR) and the vitamin D receptor (VDR) to their respective response elements in DNA, indicating a broad role in the transcriptional events of many cell types (2). RA has a profound impact on vertebrate embryogenesis. RA has been described as a morphogen which is fundamental in proper embryonic patterning, especially in the rhombomeric region of the developing brain (4). Embryonic RA signaling is also crucial in the augmentation of cell survival, proliferation and differentiation (5). These observations have made RA the focus of research into its use as a front-line therapy in the treatment of human cancers.
RARRES1 was initially identified as a novel retinoic acid receptor (RARβ/γ) regulated gene in the skin (6). Several reports have implicated RARRES1 as a putative tumor suppressor genes based largely on the hypermethylation of its promoter in many tumor types and ageing normal tissues (7-14). Studies involving the re-expression of RARRES1 have also pointed to its tumor suppressive function, as it decreased the growth of aggressive PC-3M prostate cancer cells and Ishikawa endometrial cancer cells (10, 16). RARRES1 also greatly reduced the in vitro invasiveness and in vitro tumor growth of the PC-3M prostate cancer cells in nude mice (16). Recently, RARRES1 expression has been linked to the proliferation and differentiation of adult adipose-derived mesenchymal stem cells (17). RARRES1 expression was substantially reduced in the majority of cancer cell lines and was undetectable in 7 of them; furthermore, a significant reduction of RARRES1 has been observed in advanced and poorly differentiated tumors (18).
Here we report the mimicking of RARRES1 hypermethylation by knocking it down in PWR-1E cells. Proteins were then extracted from the knocked-down and control samples, were subjected to 2-D DIGE followed by MALDI-TOF/TOF analysis to identify the differentially expressed proteins secondary to the knock down. Since proteins don't act individually but rather in a network, we identified the proteins that are affected by the down-regulation of RARRES1 to be: Disk-large-2, PP2A, VCP, EB1, and Ankrd26.
2. Materials and Methods
2.1 Cell Culture and Nucleofection
PWR-1E cells passage 18 (ATCC CRL-11611) were cultured in Keratinocyte Serum Free Medium (K-SFM) supplemented with 0.05mg/mL of bovine pituitary extract (BPE) and 5ng/mL epidermal growth factor (EGF). Cells were nucleofected using the Cell line Nucleofector Kit V (Amaxa inc., Gaithersburg , MD), program T-20, and 200 picomole of RARRES1 or scrambled siRNA per million cells according to the manufacturer's instructions. A total of four biological replicates were performed for each sample and control.
2.2 Protein Extraction and Quantitation
Cells were harvested 48 hrs after nucleofection. Cells that were cultured in 100mm dishes were briefly rinsed with PBS, incubated with 3mL of a 0.05% trypsin - 0.53 mM EDTA solution, diluted 1:1 with PBS and incubated for 5 minutes at 37ºC. Cells were then transferred to a centrifuge tube, washed 3 times with PBS, each time centrifuging and discarding the supernatant. Cells were then collected and lysed with a buffer composed of 30 mM Tris-HCl, 7 M Urea, and 4% CHAPS. The lysates were then vortexed for 1 hour at 4ºC followed by a centrifugation at 15,000xg for 15 minutes. Unsoluble pellets were discarded. Proteins were then quantified as described previously (19) using a Protein Assay (cat # 500-0006) according to the manufacturer's description (Bio-Rad, Hercules, CA). Protein concentrations were then diluted with the same lysis buffer to a final concentration of 5mg/mL.
2.3 Protein-Dye Labeling for 2D-DIGE Analysis
CyDye DIGE Fluor minimal dyes were reconstituted in water free DMF to a final concentration of 200pmole/µL. 25µg of each of the 4 biological replicates of RARRES1 Knockdown or control samples were labeled with 200 pmoles of either Cy3 or Cy5. Cy3 and Cy5 were equally swapped among RARRES1 Knockdown and control samples. Upon addition of the dyes, samples were vigorously vortexed and kept on ice in the dark for 30 min. The labeling reaction was quenched by adding 10 µL of a 10 mM lysine solution followed by vortexing. An internal standard sample composed of equal amounts of both conditions was labeled with Cy2 dye using the same procedure. Labeled proteins were pooled into 4 different fractions according to Table 1. Each fraction was diluted with rehydration buffer (50 mM Tris-HCl pH 8.8, 6 M Urea, 4% CHAPS (w/v), 1% DTT (w/v), 1% Bio-lyte 3/10 Ampholyte) to a final volume of 450 µL.
Sample mixture loaded on each gel: Each sample was composed of equal amounts of RARRES1 knock-down PWR-1E and control lysates. Cy3 and Cy5 dyes were equally swapped among RARES1 knock-down and control samples. The internal standard was labeled with Cy2 and consisted of 12.5 µg of each knock-down and control. The sample loaded on the pick-gel was composed of 300 µg of each sample and control.
| RARRES1 KNOCKDOWN SAMPLE | CONTROL | INTERNAL STANDARD | |
|---|---|---|---|
| Fraction 1/GEL 1 | 25 µg labeled with Cy3 | 25 µg labeled with Cy5 | 25 µg labeled with Cy2 |
| Fraction 2/GEL 2 | 25 µg labeled with Cy3 | 25 µg labeled with Cy5 | 25 µg labeled with Cy2 |
| Fraction 3/GEL 3 | 25 µg labeled with Cy5 | 25 µg labeled with Cy3 | 25 µg labeled with Cy2 |
| Fraction 4/GEL 4 | 25 µg labeled with Cy5 | 25 µg labeled with Cy3 | 25 µg labeled with Cy2 |
| PICK GEL | 300 µg non-labeled | 300 µg non-labeled |
Identified proteins: Table of proteins that were differentially expressed across the 4 biological replicates with a t value < 0.05 and that were identified with a significant MASCOT interval of confidence (p < 0.05). Among the identified proteins, 31 highly abundant, structural proteins, HSPs as well as proteins that are repeatedly identified as being differentially-expressed were omitted from this list.
| T-test | Av. Ratio | Protein Name |
|---|---|---|
| 0.0054 | -1.36 | P55072|TERA_HUMAN Transitional endoplasmic reticulum ATPase - Homo sapiens (Human) |
| 0.044 | -1.36 | P13798|ACPH_HUMAN Acylamino-acid-releasing enzyme - Homo sapiens (Human) |
| 0.0072 | 1.21 | Q15700|DLG2_HUMAN Disks large homolog 2 - Homo sapiens (Human) |
| 1.20E-05 | -1.73 | P30153|2AAA_HUMAN Serine/threonine-protein phosphatase 2A 65 kDa regulatory subunit A alpha isoform - (Human) |
| 0.031 | -1.14 | O00303|EIF3F_HUMAN Eukaryotic translation initiation factor 3 subunit F - Homo sapiens (Human) |
| 0.048 | 1.19 | A5A3E0|A26CB_HUMAN ANKRD26-like family C member 1B - Homo sapiens (Human) |
| 0.047 | -1.19 | Q15293|RCN1_HUMAN Reticulocalbin-1 precursor - Homo sapiens (Human) |
| 0.0032 | -1.49 | Q9UNZ2|NSF1C_HUMAN NSFL1 cofactor p47 - Homo sapiens (Human) |
| 0.042 | -1.23 | P08700|IL3_HUMAN Interleukin-3 precursor - Homo sapiens (Human) |
| 0.0039 | 1.17 | Q99829|CPNE1_HUMAN Copine-1 - Homo sapiens (Human) |
| 0.0041 | 1.18 | P06748|NPM_HUMAN Nucleophosmin - Homo sapiens (Human) |
| 0.034 | -1.18 | Q15691|MARE1_HUMAN Microtubule-associated protein RP/EB family member 1 - Homo sapiens (Human) |
| 0.042 | -1.24 | P49411|EFTU_HUMAN Elongation factor Tu, mitochondrial precursor - Homo sapiens (Human) |
| 0.049 | 1.1 | P63104|1433Z_HUMAN 14-3-3 protein zeta/delta - Homo sapiens (Human) |
| 0.02 | -1.27 | P62714|PP2AB_HUMAN Serine/threonine-protein phosphatase 2A catalytic subunit beta isoform - Homo sapiens (Human) |
| 0.039 | -1.15 | P21796|VDAC1_HUMAN Voltage-dependent anion-selective channel protein 1 - Homo sapiens (Human) |
| 0.048 | 1.15 | Q9HCY8|S10AE_HUMAN Protein S100-A14 - Homo sapiens (Human) |
| 0.027 | 1.25 | P31949|S10AB_HUMAN Protein S100-A11 - Homo sapiens (Human) |
| 0.035 | 1.44 | P31949|S10AB_HUMAN Protein S100-A11 - Homo sapiens (Human) |
2.4 2D DIGE
Isoelectric focusing (IEF) was performed by rehydrating the 24 cm IPG strips pH 3-10 non-linear for 8 hours at 50 V in 450 µL of sample in rehydration buffer. The rehydration step was followed by focusing the proteins using the following series of step and hold voltages: 250 V for 30 min, 500 V for 30 min, 1000 V for 1 hr, 3000 V for 3 hrs. An 8000 V was then maintained for a total of 65,000 Vh. IPG strips were then incubated in a reducing buffer composed of 50 mM Tris-HCl pH 8.8, 6 M Urea, 2% SDS (w/v), and 1% DTT (w/v) for 15 min. A second incubation was performed in an alkylating buffer composed of 50 mM Tris-HCl pH 8.8, 6 M Urea, 2% SDS (w/v), and 4% iodoacetamide (w/v) and 0.01% bromophenol blue for 15 min. Strips were then placed onto a 5-20% gradient gel that has 2 built-in spot picking references (Nextgensciences, Ann Arbor, MI). Gels were then loaded into an Ettan DALTsix buffer tank (GE Healthcare) filled with SDS electrophoresis buffer. Proteins were electrophoresed overnight at 8 W until the solvent front reached the bottom of the gel. The buffer temperature was maintained at 10ºC throughout the separation. The analytical gels (Gels 1 to 4 Table 1) were scanned right after the end of the separation as described below while the “pick gel” (Gel 5, Table 1) was fixed for 6 hrs with a solution containing 30% methanol and 7.5% acetic acid followed by overnight incubation with Sypro Ruby stain (Bio-Rad, Hercules, CA). The gel was then incubated in destaining solution (10% methanol, 7% acetic acid) for 3 hrs before proceeding with the scanning step.
2.5 Gel Scanning and Image Analysis
Gels were scanned using an Ettan DIGE Imager (GE Healthcare) at 100µm size. Appropriate laser exposure times were used so that no protein spot is saturated and all spot intensities fall within the linear range. The analytical gel images were cropped using ImageQuant TL (GE Healthcare) to get rid of the smears on gel edges. Image analysis was then performed using DeCyderTM2D 6.5 software. Cropped images of the analytical gels were loaded using the Image Loader tool of the software and spot detection and matching was performed using the Batch Processor tool while applying the following spot filtering parameters: Slope > 1.1 ; Area < 100 ; Peak Height < 100 ; and Volume < 65,000. Automatic spot matching was followed by a manual confirmation and rematching of unmatched or mistakenly matched spots. Inter-gel analysis and calculation of average protein abundance ratios were performed using the Biological Variation Analysis (BVA) tool. A Student's t-test was applied to generate a list of differentially-expressed spots between control and RARRES1 Knockdown PWR-1E protein extracts.
2.6 Spot Excision and Digestion
The “pick gel” image was matched with the analytical gel images using the BVA tool of the DeCyderTM2D v.6.5 software. A spot pick list coordinates was generated for proteins that were differentially-expressed within the 4 biological replicates with a p value of 0.05 or less. The coordinates of the 2 internal references were included in the pick list that was exported into the Spot Picker v1.2 which is the driver for the Ettan Spot Picker instrument (GE Healthcare). The “Pick Gel” was then placed in the gel holder plate. The spot picker was calibrated using the internal references and spots were than excised in ultrapure water and transferred into a 96-well ZiplateC18 (Cat # ZPC180010, Millipore, Bedford, MA). Protein digestion and peptide recovery procedures were modified from the manufacturer's instructions as follows: Gel pieces were dehydrated by adding 200 µL of acetonitrile to each well followed by 10 minute incubation. Full vacuum was then applied to elute the acetonitrile through the C18 resin forming the bottom of the Ziplate. Gel pieces were then rehydrated by adding 15 µL of a 25 mM ammonium bicarbonate containing 5 ng/µL of modified trypsin. After overnight incubation at 37ºC, 8 µL of acetonitrile was added to the resin. After 12 minutes of incubation, 100 µL of 0.2% TFA ultrapure water solution was added to each well and incubated for 30 minutes. The 96-well plate was then placed on a vacuum plate holder to empty wells. A final washing step was performed with a 100 µL of 0.2% TFA ultrapure water solution followed by vacuum to empty wells. The Zipplate was then placed upon a low retention 96-well “V” bottom plate (cat# 2897, Corning Inc., Corning, NY) and tryptic digests were eluted by adding 8 µL of acetonitrile followed by centrifugation at 3000xg. The bottom plate was left to air dry. Peptides were reconstituted with 2 µL of a 2.5 mg/mL α-cyano-4-hydroxycinnamic acid matrix solution. The matrix solvent was composed of 49.95% water, 49.95% acetonitrile, and 0.1% TFA (v/v/v). The peptide-matrix mixture was then deposited onto a MALDI target plate and allowed to air dry.
2.7 MALDI TOF and TOF/TOF Analysis
MS and MS/MS analysis were performed using a 4800 MALDI TOF/TOF mass spectrometer (Applied Biosystems, Foster city, CA). The instrument was calibrated using Applied Biosystems calibration standards. MALDI-TOF spectra were acquired by accumulating 1000 laser shots in reflector mode for positive ion detection between 800 and 4000 m/z. The most intense 15 peaks with S/N of 10 or higher were selected for MS/MS analysis excluding the commonly observed peaks for trypsin. Argon was used as the collision gas.
2.8 Protein Identification
Protein were identified as described previously (20). Briefly, MS and MS/MS Mass lists were picked by the GPS Explorer v3.5 software and submitted to the MASCOT v.2.0.00 search engine. The settings that were used were the following: database: Swiss-Prot; Taxonomy: homo sapiens; Enzyme: trypsin; Variable modifications: carbamidomethyl (C) and Oxidation (M); MS/MS fragment tolerance: 0.3Da; Precursor mass tolerance: 75 ppm; Maximum missed cleavage allowed: 1. Only proteins with MASCOT confidence interval higher than 95% (p < 0.05) were considered. Experimental molecular mass and pI were used to confirm protein identities.
2.9 Western Blotting
Western Blotting was performed as described previously (21) using the following antibodies: Rabbit monoclonal to PP2A (cat. ab32141, Abcam, Cambridge, MA); Rabbit polyclonal to PSD93 (cat. ab2930, Abcam, Cambridge, MA); Goat polyclonal to RARRES1 (R&D systems, Mineapolis, MN); Mouse monoclonal to VCP (cat. ab11433, Abcam, Cambridge, MA).
3. Results and Discussion
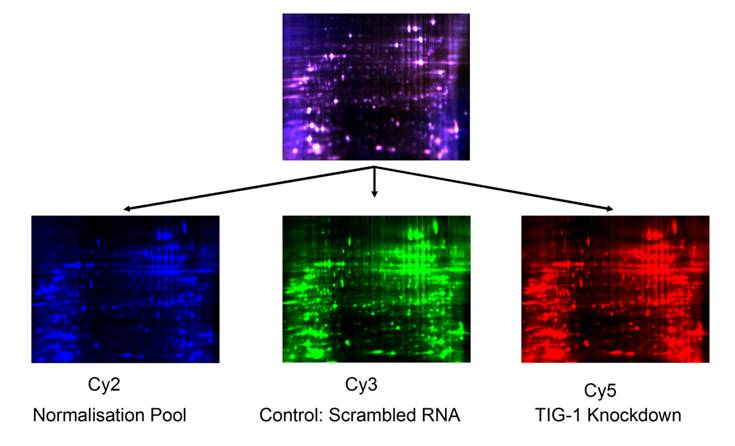
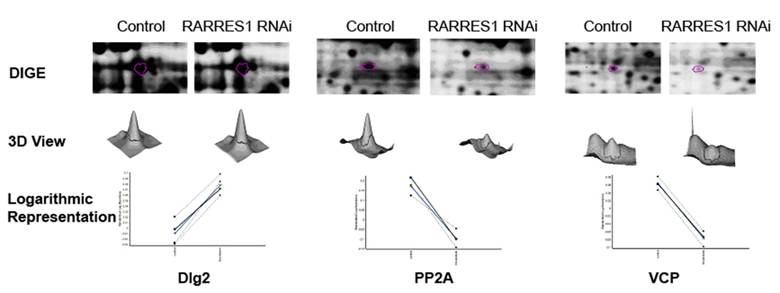
RARRES1 knockdown in PWR-1E cells was validated using western blot that shows the significant decrease in RARRES1 expression as a result of RARRES1 siRNA nucleofection when compared to RARRES1 expression in the scrambled siRNA nucleofected cells. Relative protein expression change that resulted from RARRES1 knockdown in PWR-1E cells was assessed by DIGE. A total of 8121 spots were detected on the 2-dimensional gels (Figure 1) of which 97 spots were consistently differentially-expressed with a p < 0.05 across the 4 biological replicates. An advantage of DIGE over regular 2-D gel techniques is the elimination of gel to gel variations since both sample and control are run on the same gel and normalized based on the internal standard pool which is also run on the same gel. Only spots with level changes of 10% or more were considered. These spots were matched and excised from the pick gel (Figure 2) and processed for MALDI-MS/MS analysis (21) that allowed for the identification of 50 proteins. Differentially-expressed proteins that were identified included highly abundant proteins (e.g. tubulin), heat shock proteins (e.g. HSP 90) in addition to other proteins that are repeatedly identified as being differentially-expressed (e.g. peroxiredoxins, enolases, piruvate kinases) (22). These proteins were not considered in the study. Emphasis was given to proteins that are involved in the regulation of cell cycle. Of particular interest were Disks large homolog 2 (Dlg-2), Serine/threonine-protein phosphatase (PP2A), and Valosin containing protein (VCP) (Figure 3).
DIGE data: Representation set of one of the 4 biological replicates. 25 µg of control PWR-1E cells lysates labeled with 200 pmoles of Cy3 (green); 25 µg of RARRES1 knock-down PWR-1E cells labeled with 200 pmoles of Cy5 (red) and a normalization pool composed of a 50:50 mixture of sample and control labeled with Cy2 (blue). The first dimension separation was performed on a 24 cm non-linear IPG strips and the second dimension separation was accomplished on a 5-20% gradient polyacrylamide gel with 2 built-in spot picking references. Gels were scanned at a 100 µm resolution using excitation and emission wavelength that corresponds to each dye. Combined Cy2, Cy3, and Cy5 signals are represented in the top gel.
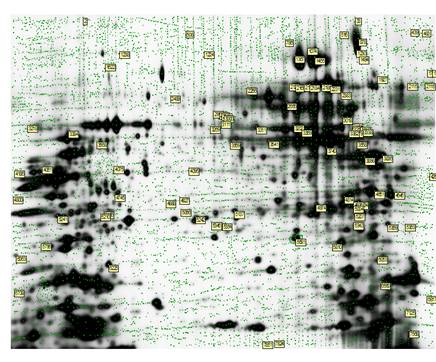
Sypro Ruby Pick gel: loaded with 300µg of PWR-1E RARRES1 knock-down protein extracts and 300µg of control sample. The green dots represent the proteins that were detected by the Decyder software. Annotated proteins are those that were picked for mass spectrometry analysis. These spots were identified as differentially-expressed across the 4 biological replicates in the analytical gels. The coordinates of these spots were recorded, matched, and excised from the Pick gel for identification.
Differentially expressed proteins: a) 2- Cropped DIGE; b) three-dimensional view, and c) logarithmic representation of the 4 four biological replicates of Dlg-2 upregulation, PP2A and VCP down-regulation as a result of RARRES1 knock-down in PWR-1E cells.
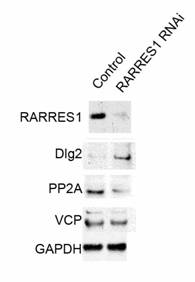
Retinoic Acid Receptor Responder 1 (RARRES1) is a putative carboxypeptidase inhibitor and tumor suppressor which gene is frequently silenced in cancer and aging normal cells. RARRES1 knock-down in PWR-1E cells resulted in the upregulation of disks large 2 (Dlg2), a neoplastic tumor suppressor that acts as a scaffold at cell-cell junctions (23-25). Dlg2 consists exclusively of protein-protein interaction domains and PDZ domains implicated in cell polarity control and is localized basal to the adherens junctions (26, 27). Dlg2 homologue was found to be upregulated in oncocytoma, a benign tumor of the kidney and is therefore considered an oncogene (28). RARRES1 knock-down resulted also in the down-regulation of serine/threonine-protein phosphatase 2A (PP2A) in addition to its catalytic subunit. PP2A has broad substrate specificity. It targets proteins of oncogenic signaling cascades including Raf, Mek, and Akt (29). PP2A is a negative regulator of the growth hormone stimulated signal transduction pathways. Mutation of this enzyme has been identified in several types of cancer including lung (30, 31) and breast (32-36). Its down-regulation secondary to RARRES1 knock-down results in a decreased targeting of Raf, Mek, and Akt. Furthermore Valosin-containing Protein (VCP) was also down-regulated as a result of RARRES1 knock-down. Mutation of VCP causes inappropriate activation of NFκB signaling cascade (37) as well as impaired autophagy (38). End-bindin protein-1 (EB1) was found to be down-regulated as a result of RARRES1 knock-down. EB1 is mainly involved in the regulation of spindle dynamics and chromosome alignment during mitosis (39) and promotes microtubule growth by suppressing catastrophes (40). It was recently shown to promote colony formation and enhancing tumor growth in nude cells while its knock-down resulted in the inhibition of cancer cell proliferation suggesting an oncogenic role (41). As for Ankrd26, it belongs to the POTE family of genes containing ankyrin repeat and coiled coil domains (42). Ankrd1 has recently been found to be expressed in the majority of ovarian adenocarcimoas and found at high levels in patients with worse outcome (43). Western blotting was performed to validate the upregulation of Dlg-2 and down-regulation of PP2A and VCP (Figure 4) as a result of RARRES1 knock-down.
Western Blot Validation: of a) RARRES1 knock-down, b) Dlg2 homologue, c) PP2A, d) VCP and e) GAPDH loading control. Lane 1 scrambled siRNA nucleofected PWR-1E lysates; lane 2 RARRES1 siRNA nucleofected PWR-1E lysates.
While the down-regulation of VCP and PP2A and the up-regulation of Ankrd26 are consistent with the knock-down of tumor suppressor RARRES1, oncogenic EB1 down-regulation and tumor suppressor dlg2 up-regulation following RARRES1 knock-down are thought to have occurred to compensate for the loss of RARRES1 expression.
Conclusion
Our analysis shows that knock-down of RARRES1 exhibits a consistent change in the expression level of several proteins notably up-regulation of Dlg2, a neoplastic tumor suppressor, down-regulation of VCP that results in the activation of NFκB signaling cascade, down-regulation of PP2A that results in a decreased targeting of oncogenes Raf, Mek, and Akt, up-regulation of Ankrd26, a member of the POTE family of genes, and down-regulation of EB1. This data highlights the role of RARRES1 and as a consequence that of retinoic acid as a tumor suppressor. More studies are required to test which one of these molecules interacts directly with RARRES1 to elucidate its mechanism of tumor suppressing.
Acknowledgements
This study was funded by NIH R01CA129813, NIH 1 P01 CA130821. The authors wish to acknowledge the support of the following Lombardi Cancer Center Core Facilities (NIH P30 CA51008): Tissue culture and proteomics and metabolomics.
Conflict of Interest
The authors have declared that no conflict of interest exists.
References
1. Leid M, Kastner P, Chambon P. Multiplicity Generates Diversity in the Retinoic Acid Signaling Pathways. Trends Biochem Sci. 1992;17:427-33
2. Chambon P. A decade of molecular biology of retinoic acid receptors. Faseb J. 1996;10:940-54
3. Chen JD, Umesono K, Evans RM. SMRT isoforms mediate repression and anti-repression of nuclear receptor heterodimers. Proc Natl Acad Sci USA. 1996;93:7567-71
4. Glover JC, Renaud JS, Rijli FM. Retinoic acid and hindbrain patterning. J Neurobiol. 2006;66:705-25
5. Mark M, Ghyselinck NB, Chambon P. Function of retinoid nuclear receptors. Lessons from genetic and pharmacological dissections of the retinoic acid signaling pathway during mouse embryogenesis. Annu Rev Pharmacol Toxicol. 2006;46:451-80
6. Nagpal S, Patel S, Asano AT, Johnson AT, Duvic M, Chandraratna RAS. Tazarotene-induced gene 1 (TIG1), a novel retinoic acid receptor-responsive gene in skin. J Invest Dermatol. 1996;106:269-74
7. Youssef EM, Chen XQ, Higuchi E, Kondo Y, Garcia-Manero G, Lotan R, Issa JPJ. Hypermethylation and silencing of the putative tumor suppressor Tazarotene-induced gene 1 in human cancers. Cancer Res. 2004;64:2411-7
8. Bonazzi VF, Irwin D, Hayward NK. Identification of Candidate Tumor Suppressor Genes Inactivated by Promoter Methylation in Melanoma. Genes Chromosomes Cancer. 2009;48:10-21
9. Mizuiri H, Yoshida K, Toge T, Oue N, Aung PP, Noguchi T, Yasui W. DNA methylation of genes linked to retinoid signaling in squamous cell carcinoma of the esophagus: DNA methylation of CRBP1 and TIG1 is associated with tumor stage. Cancer Sci. 2005;96:571-7
10. Takai N, Kawamata N, Walsh CS, Gery S, Desmond JC, Whittaker S. et al. Discovery of epigenetically masked tumor suppressor genes in endometrial cancer. Mol Cancer Res. 2005;3:261-9
11. Yanatatsaneejit P, Chalermchati T, Kerekhanjanarong V, Shotelersuk K, Supiyaphun P, Mutirangura A, Sriuranpong V. Promoter hypermethylation of CCNA1, RARRES1, and HRASLS3 in nasopharyngeal carcinoma. Oral Oncol. 2008;44:400-6
12. Ellinger J, Bastian PJ, Jurgan T, Biermann K, Kahl P, Heukamp LC. et al. CpG island hypermethylation at multiple gene sites in diagnosis and prognosis of prostate cancer. Urology. 2008;71:161-7
13. So KJ, Tamura G, Honda T, Homma N, Waki T, Togawa N. et al. Multiple tumor suppressor genes are increasingly methylated with age in non-neoplastic gastric epithelia. Cancer Sci. 2006;97:1155-8
14. Wu CC, Shyu RY, Chou JM, Jao SW, Chao PC, Kang JC. et al. RARRES1 expression is significantly related to tumor differentiation and staging in colorectal adenocarcinoma. Eur J Cancer. 2006;42:557-65
15. Shutoh M, Oue N, Aung PP, Noguchi T, Kuraoka K, Nakayama H. et al. DNA methylation of genes linked with retinoid signaling in gastric carcinoma - Expression of the retinoid acid receptor beta, cellular retinol-binding protein 1, and tazarotene-induced gene 1 genes is associated with DNA methylation. Cancer. 2005;104:1609-19
16. Jing C, El-Ghany MA, Beesley C, Foster CS, Rudland PS, Smith P, Ke Y. Tazarotene-induced gene 1 (TIG1) expression in prostate carcinomas and its relationship to tumorigenicity. J Natl Cancer Inst. 2002;94:482-90
17. Ohnishi S, Okabe K, Obata H, Otani K, Ishikane S, Ogino H. et al. Involvement of tazarotene-induced gene 1 in proliferation and differentiation of human adipose tissue-derived mesenchymal stem cells. Cell Prolif. 2009;42:309-16
18. Son MS, Kang MJ, Park HC, Chi SG, Kim YH. Expression and Mutation Analysis of TIG1 (Tazarotene-Induced Gene 1) in Human Gastric Cancer. Oncol Res. 2009;17:571-80
19. Sahab ZJ, Suh Y, Sang QXA. Isoelectric point-based prefractionation of proteins from crude biological samples prior to two-dimensional gel electrophoresis. Journal of Proteome Research. 2005;4:2266-72
20. Sahab ZJ, Semaan SM, Sang QXA. Methodology and Applications of Disease Biomarker Identification in Human Serum. Biomarker Insights. 2007;2:21-43
21. Sahab ZJ, Iczkowski KA, Sang QXA. Anion exchange fractionation of serum proteins versus albumin elimination. Analytical Biochemistry. 2007;368:24-32
22. Petrak J, Ivanek R, Toman O, Cmejla R, Cmejlova J, Vyoral D. et al. Deja vu in proteomics. A hit parade of repeatedly identified differentially expressed proteins. Proteomics. 2008;8:1744-9
23. Bilder D, Li M, Perrimon N. Cooperative regulation of cell polarity and growth by Drosophila tumor suppressors. Science. 2000;289:113-6
24. Woods DF, Bryant PJ. The Disks-Large Tumor Suppressor Gene of Drosophila Encodes a Guanylate Kinase Homolog Localized at Septate Junctions. Cell. 1991;66:451-64
25. Woods DF, Hough C, Peel D, Callaini G, Bryant PJ. Dlg protein is required for junction structure, cell polarity, and proliferation control in Drosophila epithelia. J Cell Biol. 1996;134:1469-82
26. Peng CY, Manning L, Albertson R, Doe CQ. The tumour-suppressor genes lgl and dlg regulate basal protein targeting in Drosophila neuroblasts. Nature. 2000;408:596-600
27. Ohshiro T, Yagami T, Zhang C, Matsuzaki F. Role of cortical tumour-suppressor proteins in asymmetric division of Drosophila neuroblast. Nature. 2000;408:593-6
28. Zubakov D, Stupar Z, Kovacs G. Differential expression of a new isoform of DLG2 in renal oncocytoma. BMC Cancer. 2006;6:106
29. Ory S, Zhou M, Conrads TP, Veenstra TD, Morrison DK. Protein phosphatase 2A positively regulates ras signaling by dephosphorylating KSR1 and Raf-1 on critical 14-3-3 binding sites. Current Biology. 2003;13:1356-64
30. Negrini M, Rasio D, Hampton GM, Sabbioni S, Rattan S, Carter SL. et al. Definition and Refinement of Chromosome-11 Regions of Loss of Heterozygosity in Breast-Cancer - Identification of a New Region at 11q23.3. Cancer Res. 1995;55:3003-7
31. Wang SSQ, Virmani A, Gazdar AF, Minna JD, Evans GA. Refined mapping of two regions of loss of heterozygosity on chromosome band 11q23 in lung cancer. Genes Chromosomes Cancer. 1999;25:154-9
32. Kerangueven F, Eisinger F, Noguchi T, Allione F, Wargniez V, Eng C. et al. Loss of heterozygosity in human breast carcinomas in the ataxia telangiectasia, Cowden disease and BRCA1 gene regions. Oncogene. 1997;14:339-47
33. Koreth J, Bakkenist CJ, McGee JO. Allelic deletions at chromosome 11q22-q23.1 and 11q25-qterm are frequent in sporadic breast but not colorectal cancers. Oncogene. 1997;14:431-7
34. Monaco C, Negrini M, Sozzi G, Veronese ML, Vorechovsky I, Godwin AK, Croce CM. Molecular cloning and characterization of LOH11CR2A, a new gene within a refined minimal region of LOH at 11q23. Genomics. 1997;46:217-22
35. Laake K, Launonen V, Niederacher D, Gudlaugsdottir S, Seitz S, Rio P. et al. Loss of heterozygosity at 11q23.1 and survival in breast cancer: Results of a large European study. Genes Chromosomes Cancer. 1999;25:212-21
36. Esplin ED, Ramos P, Martinez B, Tomlinson GE, Mumby MC, Evans GA. The glycine 90 to aspartate alteration in the A beta subunit of PP2A (PPP2R1B) associates with breast cancer and causes a deficit in protein function. Genes Chromosomes Cancer. 2006;45:182-90
37. Custer SK, Neumann M, Lu HB, Wright AC, Taylor JP. Transgenic mice expressing mutant forms VCP/p97 recapitulate the full spectrum of IBMPFD including degeneration in muscle, brain and bone. Human Molecular Genetics. 2010;19:1741-55
38. Ju JS, Fuentealba RA, Miller SE, Jackson E, Piwnica-Worms D, Baloh RH, Weihl CC. Valosin-containing protein (VCP) is required for autophagy and is disrupted in VCP disease. Journal of Cell Biology. 2009;187:875-88
39. Green RA, Wollman R, Kaplan KB. APC and EB1 function together in mitosis to regulate spindle dynamics and chromosome alignment. Mol Biol Cell. 2005;16:4609-22
40. Komarova Y, De Groot CO, Grigoriev I, Gouveia SM, Munteanu EL, Schober JM. et al. Mammalian end binding proteins control persistent microtubule growth. J Cell Biol. 2009;184:691-706
41. Dong X, Liu FF, Sun L, Liu M, Li DW, Su D. et al. Oncogenic function of microtubule end-binding protein I in breast cancer. J Pathol. 2010;220:361-9
42. Hahn Y, Bera TK, Pastan IH, Lee B. Duplication and extensive remodeling shaped POTE family genes encoding proteins containing ankyrin repeat and coiled coil domains. Gene. 2006;366:238-45
43. Scurr LL, Guminski AD, Chiew YE, Balleine RL, Sharma R, Lei Y. et al. Ankyrin Repeat Domain 1, ANKRD1, a Novel Determinant of Cisplatin Sensitivity Expressed in Ovarian Cancer. Clin Cancer Res. 2008;14:6924-32
Author contact
![]() Corresponding author: Stephen W. Byers, Ph.D. Department of Oncology, Lombardi Comprehensive Cancer Center, Georgetown University Medical Center, 3970 Reservoir Rd NW Suite E415, Washington DC 20007; Tel: 1-202-687-1813; Fax: 1-202-687-7505; E-mail: byerssedu
Corresponding author: Stephen W. Byers, Ph.D. Department of Oncology, Lombardi Comprehensive Cancer Center, Georgetown University Medical Center, 3970 Reservoir Rd NW Suite E415, Washington DC 20007; Tel: 1-202-687-1813; Fax: 1-202-687-7505; E-mail: byerssedu