Impact Factor ISSN: 1837-9664

 Global reach, higher impact
J Cancer 2010; 1:54-62. doi:10.7150/jca.1.54 This volume Cite
Research Paper
BP1 Homeoprotein Enhances Metastatic Potential in ER-negative Breast Cancer
Yebo Fu1*, Yi Lian1*, Kyung Soon Kim1, Lei Zhang2, A. Katharine Hindle3, Fred Brody3, Robert S. Siegel1, Timothy A. McCaffrey1, Sidney W. Fu1, 3 ![]()
1. Department of Medicine, Division of Genomic Medicine, George Washington University Medical Center, Washington, DC, USA
2. Center for Vaccine Development, University of Maryland, Baltimore, MD, USA
3. Department of Surgery, George Washington University Medical Center, Washington, DC, USA
* YF and YL contributed equally to this work.
Published 2010-6-24
Abstract
Tumor invasion and metastasis remain a major cause of mortality in breast cancer patients. It was reported that BP1, a homeobox isoform of DLX4, is overexpressed in 80% of breast cancer patients and in 100% of estrogen receptor negative (ER-) tumors. The prevalence of BP1 positive cells and the intensity of BP1 immunoreactivity increased with the extent of ductal proliferation and tumorigenesis. These findings imply that BP1 may play an important role in ER- breast cancer. We sought to determine the effects and mechanisms of BP1 on cell proliferation and metastasis using ER- Hs578T cells as a model. Cells were transfected with either pcDNA3.2 plasmid containing BP1 gene, or pcDNA3.2 vector, then selected and cloned. Overexpression of BP1 increased cell proliferation rate by 2-5 fold (p<0.005), and enhanced the in vitro invasive activity by 25-65 fold (p<0.001). Microarray experiments were performed to identify differentially expressed genes when BP1 is overexpressed. The gene expression profile of the transfected cell lines were compared, resulting in 71 differentially expressed genes with a fold-change of >=2.0. Of those genes, 49 were up-regulated and 22 were down-regulated. Significant pathways were identified involving cell proliferation and metastasis. These data demonstrated that overexpression of BP1 significantly enhanced cell proliferation and metastatic potential in ER- Hs578T cells. Further analysis with more ER- cell lines and patient samples is warranted to establish BP1 as a therapeutic target for ER- breast cancer.
Keywords: BP1, homeobox gene, ER, microarray, breast cancer
INTRODUCTION
Breast cancer is one of the most common malignancies affecting women and was expected to be diagnosed in approximately 192,370 new cases of invasive tumor, as well as an estimated 62,280 additional cases of in situ tumor in the United States in 2009, and about 40,170 women were expected to die from the disease [1]. Homeobox genes that were originally identified in Drosophila, encode a family of transcriptional factors essential for axial and appendicular patterning and organogenesis [2]. Further studies demonstrated that homeobox genes are an important class of master regulatory genes responsible for orchestrating developmental processes in many species. These genes are characterized by a common 180-nucleotide sequence coding for a 60-amino-acid domain known as homeodomain, which contains a helix-turn-helix DNA binding motif. This motif directs specific binding of downstream target genes that may be activated or repressed. In vitro assays show that all HOX proteins can bind to similar DNA motifs with a core sequence of TAAT [3] [4]. Homeobox genes are divided into families on the basis of the level of similarity among their respective homeodomains [5]. It is estimated that the human genome includes at least 200 homeobox genes [6]. Homeobox genes are classified into two groups. A large family of homeobox genes, also referred to as HOX genes, are structurally and functionally homologous to the homeotic complex (HOM-C) of Drosophila [2]. In mice (Hox genes) and humans (HOX genes), there are at least 39 of them, organized in four clusters, localized on different chromosomes (HOXA at 7p15.3, HOXB at 17q21.3, HOXC at 12q13.3, and HOXD at 2q31), [7] each containing 9 to 11 genes arranged in a homologous sequence. A small family, such as MSX and Engrailed (EN) groups only has two or three members. Most homeobox gene families, such as the NKX, PAX and Distal-less (DLX) groups, are intermediate in size and contain five to nine members. In humans, there have been at least seven members discovered in the DLX group, to which BP1/DLX4 belongs. DLX4 has at least two distinct spliced variants [8]. Recently, many homeobox genes were found to be aberrantly expressed in a variety of cancers, including those of the breast, kidney, skin and leukemia, suggesting that they may also contribute to the progression of tumors [9] [10] [11] [12]. Studies of loss of function or deregulation of homeobox genes in breast cancer strongly implicate a role for these genes in cellular transformation, alterations in cell cycle and apoptosis, and progression to a metastatic phenotype. Homeobox genes are expressed in carcinoma cell lines, as well as the corresponding embryonic tissues from which these tumor cells are derived [13] [14]. The deregulated expression of homeobox genes has been described in many solid tumors and derivative cell lines.
BP1, a splice variant of DLX4, is mapped to chromosome 17q21[8] and is involved in the regulation of diverse pathways. It was reported that BP1 is overexpressed in 81% breast tumor tissues and, noticeably, in 100% ER- breast tumors. Interestingly, high levels of BP1 expression in breast cancer cell lines strongly correlate with its tumorigenic potential [15], and BP1 expression increases with the progression of breast cancer [16]. Recent study found that the stable overexpression of BP1 led to inhibition of apoptosis in MCF7 breast cancer cells challenged with TNFα [17].
The ER negative (ER-) cancers account for about one-third of breast cancers, approximately 65,000 a year in the United States [18]. While drugs exist that can sharply reduce the risk of ER positive (ER+) breast cancers, these drugs have no effect on cancers that are not hormone sensitive. Drugs such as selective estrogen receptor modulators (e.g. tamoxifen) and aromatase inhibitors are used to treat or prevent breast cancer in patients with ER+ tumors by directly inhibiting or lowering the activity or production of either estrogen or estrogen receptors. Unfortunately, no drug therapies exist that have an impact on ER- cancer [19]. It is likely that the growth and spread of ER- cancer cells is driven by factors other than estrogen. Because BP1 is expressed in all ER- breast cancers, it may have the potential to be a new therapeutic target. This study focuses on the functional role of BP1 in the proliferation and metastatic potential of ER- Hs578T cells, which expresses low BP1 [15].
MATERIALS AND METHODS
Cell culture and transfection: Human breast carcinoma cell line Hs578T were cultured in Dulbecco's modified Eagle's medium supplemented with 10% fetal bovine serum and 0.01 mg/ml bovine insulin, in a 37°C humidified incubator with 5% CO2. Hs578T cells were stably transfected with BP1 (pcDNA3.2-BP1), or pcDNA3.2 (Invitrogen, USA) by FuGENE 6 transfection reagent (Roche Applied Science) according to the manufacturer's instructions. Successfully transfected cells were selected in culture medium with the addition of 800 µg/ml G418 antibiotics (Invitrogen) for two weeks before the individual clones were isolated. Three overexpressors (O3, O6 and O7) and two controls (V1 and V2) were established and maintained in the medium containing 400 µg/ml of G418.
RNA isolation and quantitative real-time RT-PCR (QPCR): Total RNA was isolated from the cell clones, using Trizol reagent (Invitrogen) according to the manufacturer's instruction and purified with RNeasy kit (Quiagen). The RNA 6000 Nano Chip kit (Agilent) was used for the quality control and quantitation of the RNA samples. One microgram of total RNA was used for reverse transcription using the iScript cDNA Synthesis Kit (Bio-Rad). To verify gene expression in transfected cell clones, QPCR was performed using the ABI 7300 Real-Time PCR System (Applied Biosystems). A final volume of 25µl for each reaction consisted of 12.5µl SYBR Green PCR Master Mix (Applied Biosystems), 1µl (10µM) of each primer (IDT, Coralville, IA, USA), 1µl of cDNA and 9.5µl nuclease-free water. The conditions for QPCR were 50°C for 2 minutes, 95°C for 10 minutes, followed by 40 cycles of 95°C for 15 seconds and 60°C for 60 seconds. Dissociation curves were generated for each primer set to confirm the specificity of amplifications. The Mean Quantity values of target genes mRNA expression were normalized by 18S ribosome RNA. The primer sequences are for BP1: forward, 5'-CCTCCCCCAATTTGTCCTACTC-3' and reverse, 5'-GGTTGCTGGCAGGACAGGTA-3'; for 18S: forward, 5'-GCCGCTAGAGGTGAAATTCTTG-3'and reverse, 5'-CATT CTTGGCAAATGCTTTCG-3'.
Western blot analysis: Proteins were isolated from the cell lines using the T-PER Tissue Protein Extraction Reagent (Fisher Scientific). A 30 µg protein from each sample was separated by a 4-20% sodium dodecyl sulfate polyacrylamide gel electrophoresis (Bio-Rad Laboratories, Hercules, CA, USA) before transferring to a nitrocellulose membrane. Rabbit-anti-BP1 primary antibody (Novus Biologicals, Littleton, CO, USA) was diluted in TNE-Tween20 buffer (1:1000) followed by incubating with the membranes overnight at 4°C. After washing 3 times for 15 minutes each, the membrane was incubated in a 1:1,000 diluted anti-rabbit secondary antibody (Pierce/Fisher Scientific) for 2h at room temperature. The membranes were submerged in SuperSignal West Pico Chemiluminescent Substrate (Fisher Scientific) and visualized on a Kodak 2000MM Image Station. Protein expression signal intensities were analyzed using the Kodak 1D Image Analysis software. After detection of BP1 protein, the membranes were treated by stripping buffer (62.5 mM Tris-HCl (pH 6.8), 2% SDS) at 60°C for 20min. Then 1:20,000 dilution of mouse-anti-GAPDH antibody was applied to the membrane, and incubated at room temperature for 1.5h, followed by a 1:1,000 anti-mouse antibody (Fisher Scientific) incubation. The membranes were visualized and exposed as described before. The relative intensities of the bands were quantitated, and the BP1/GAPDH image quantity ratio was calculated to determine the relative expression levels of BP1 protein for each cell line.
Cell proliferation assays: An MTT assay was performed to determine the cell proliferation rate when BP1 is overexpressed. Three thousand cells per well from each clone were seeded in a 96-well plate in triplicate, and incubated at 37°C incubator. The MTT assays were performed at 24h, 48h and 72h respectively. At each time point, 10µl of the 3-(4,5-dimethylthiazol-2-yl)-2,5-diphenyltetrazolium bromide (MTT) reagent (MILLIPORE, Billerica, MA, USA) was added to each well. After 4 hours of incubation, cells were lysed by addition of 200μl dimethylsulfoxide (DMSO). Absorbance was measured at 570 nm using a microplate reader (Molecular Devices, Sunnyvale, CA, USA). Experiments were repeated three times, and the percentage of growth is the average of the experiments.
Matrigel invasion assay: A Matrigel invasion assay was performed using BD BioCoat™ Matrigel™ Invasion Chamber (BD Biosciences, Franklin Lakes, NJ, USA). BD BioCoat Matrigel Invasion Chambers provide cells with the conditions that allow assessment of their invasive property in vitro. It consists of a BD Falcon™ TC Companion Plate with Falcon Cell Culture Inserts containing an 8 micron pore size PET membrane with a thin layer of matrigel basement membrane matrix. The matrigel matrix serves as a reconstituted basement membrane in vitro. The layer occludes the pores of the membrane, preventing non-invasive cells from migrating through the membrane. In contrast, invasive cells are able to detach themselves from and invade through the matrigel matrix and the 8 micron membrane pores. Briefly, Prior to beginning the experiments, a 500μl warm (37°C) bicarbonate based serum-free culture medium was added to the upper and lower chambers and allowed to rehydrate for 2h in a 37°C cell culture incubator. The 2.5x10⁵ serum-free DMEM treated cells from each cell line were seeded onto the top chamber of pre-wet inserts. After 24 hours, non-invasive cells were removed from the upper surface of the membrane by scrubbing with a cotton swab and the invasive cells present on the bottom of the membrane were fixed and stained with Diff-Quick staining solution and counted from five microscope fields. Experiments were done duplicate for each cell line twice. Cell counts were performed on five nonoverlapping random fields for each chamber and four chambers were counted for each experimental point, and the percentage of invasive cells was normalized to the corresponding controls.
Microarray assay and data analysis: The Human Genome Focus Arrays, representing over 8,500 verified human sequences from the NCBI RefSeq database, were used for the study. Total RNA samples were purified using RNeasy purification kit (QIAGEN, USA) according to the manufacturer's protocol. The detailed protocol for the sample preparation and microarray processing is available from Affymetrix (Santa Clara, CA). Briefly, 5μg of total RNA was reverse-transcribed by Superscript II reverse transcriptase (Life Technologies, Grand Island, NY) using T7-(dT)24 primer containing a T7 RNA polymerase promoter. The cDNA then was used to synthesize double stranded cDNA for subsequent in vitro transcription reaction to generate biotinylated complementary RNA (cRNA). Fifteen micrograms of fragmented cRNA was hybridized to a Human Genome Focus Array (Affymetrix) for 16 hours at 45°C with constant rotation at 60 rpm. After hybridization, the array chip was washed and stained on an Affymetrix FL-450 fluidics station and scanned with the GeneChip Scanner 3000 7G. The data was saved by AGCC command console software (Affymetrix) as .cel file format.
The array data were analyzed using GeneSpring GX 10.0.2 (Agilent Technologies, Santa Clara, CA). Samples were grouped into two conditions and samples within a condition are considered as replicates. And for each entity, the average intensity value across replicates was used for visualization and analysis. Entities are filtered based on their signal intensity values by satisfying the upper and lower percentile cutoffs 20-100%. Data were processed in GeneSpring GX by statistical analysis using unpaired t-test with p-value computation done asymptotically (p-value cut-off of 0.05). Further analyses were done using fold change cut-off of >=2.0. Hierarchical data clustering and pathway identification were performed by GeneSpring GX 10.0.2.
Statistical Analysis: All statistical analyses were analyzed by the student t-Test to determine P values except for the microarray data.
RESULTS
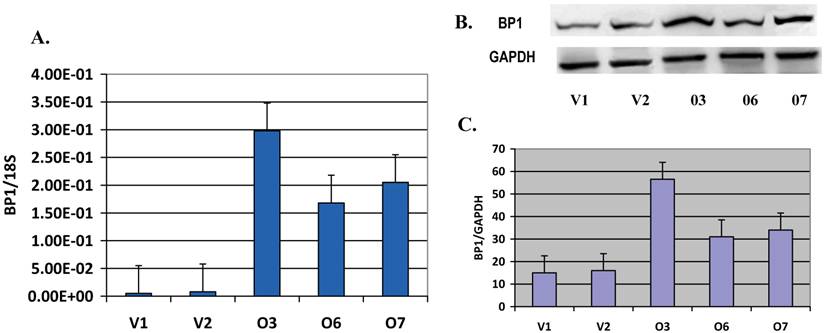
BP1 expression is verified in Hs578T stable cell lines: The BP1 mRNA levels in the cloned cell lines, including BP1 overexpressors and vector control lines, were verified using QPCR, with 18S as an internal control. Relative BP1 mRNA levels in O3, O6 and O7 were significantly increased (p<0.01), more than 15 fold higher than that of the vector control lines (V1 and V2) (Figure 1A). But in O1, O2, O4 and O5 cell lines, the BP1 mRNA levels were not increased. These cell lines could have become resistant to G418 or had lower BP1 integration. Therefore, we used O3, O6 and O7 for subsequent experiments. To verify BP1 protein expression, Western blot analysis was done (Figure 1B). The upper bands represent BP1 protein, and the lower bands are GAPDH used as an internal control. The intensities of these bands were quantified by the Kodak 1D image analysis software. BP1/GAPDH ratios were calculated for each of the three experiments and the average was used for the graph (Figure 1C). The relative protein expression levels of BP1 in O3, O6 and O7 displayed a 2-3.5 fold increase in contrast to V1 and V2 (p<0.05), confirming that BP1 protein was induced in BP1-transfected cells. Part of these data were published previously [20].
Verification of BP1 expression in s578T cell clones. A. QRT-PCR analysis of BP1 mRNA levels in BP1 overexpressing cell lines (O3, O6 and O7) and empty vector control cell lines (V1 and V2). BP1 mRNA levels in the overexpressors were significantly increased (p<0.01) compared to the empty vector controls. Each reaction was run twice in triplicates. BP1 expression was normalized by 18S. B. Western bolt for BP1 protein expression, using GAPDH as an internal control. C. Quantitation of BP1 protein expression, showing a significant increase (p<0.05) in BP1 overexpressors. The bolts were photographed and quantitated for each sample in three independent experiments. The analysis was based on the average of them.
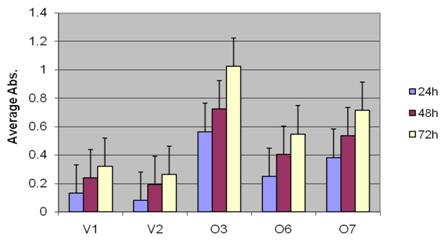
BP1 induces more aggressive phenotype in Hs578T cells: To test the cell proliferation of BP1 overexpressors, MTT assays were performed. The cell number in each well was directly measured by the UV absorbance at each time point. In Figure 2, the absorbance data of the vector control lines (V1 and V2) and the BP1 overexpressors (O3, O6, O7), collected at 24h, 48h and 72h were compared. After 24h, the cell numbers of BP1-overexpressing cell lines were 2 to 7 times higher compared to those of vector control lines (p<0.05); this multiple tended to increase at 48h and 72h, represented by the change of p value, from 0.046 at 24h to 0.040 at 72h.
The effect of BP1 overexpression in Hs578T cell proliferation. MTT assays indicate cell proliferation rate was significantly higher (P<0.05) in BP1 overexpressors. The experiments were done three times in triplicates for each cell line.
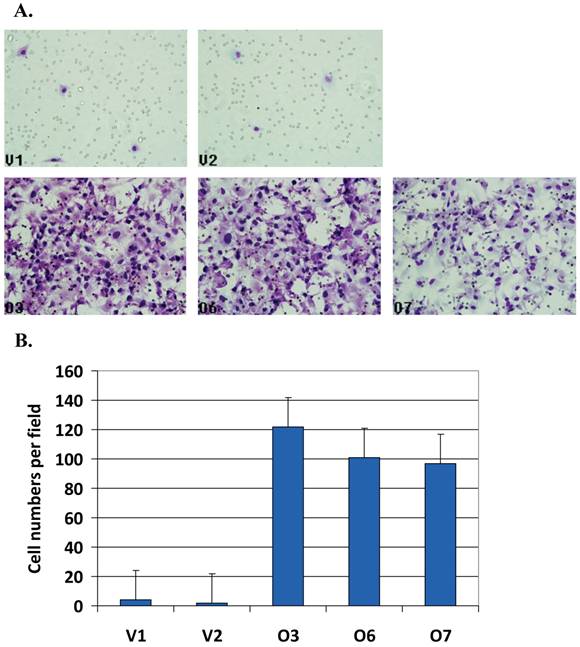
Matrigel resembling the complex extracellular environment were used for cell migration assay as a model for tumor cell metastasis. In Matrigel assay, the number of the migrated cells was counted. Figure 3A shows BP1 overexpressing cells (bottom panel, O3, O6 and O7) with significantly higher number of cells migrated compared to the controls (upper panel, V1 and V2). After counting the number of cells in unit areas, the average cell numbers per field for each cell line were shown (Figure 3B). There were 25 ~ 65 fold increase when BP1 was overexpressed (p<0.001). This demonstrates that BP1 overexpression confers a more invasive potential in ER- breast cancer cells in vitro.
Cell invasiveness analysis by Matrigel assays. A. Matrigel analysis for all five cell lines. B. BP1 overexpressing cell lines (O3, O6 and O7) exhibited very significantly higher invasiveness than empty vector control cell lines (V1 and V2) (p<0.001). Three fields of unit area on each membrane were counted for cell numbers, and the experiments were repeated twice. Data analysis was based on the average of parallel repeats.
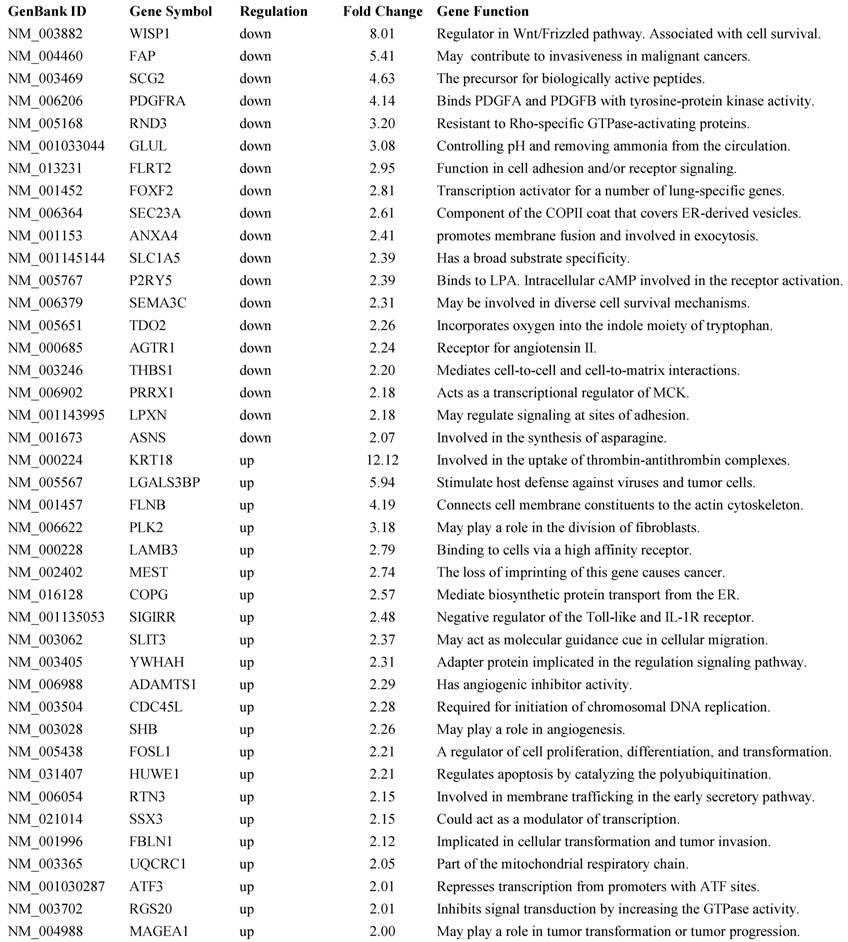
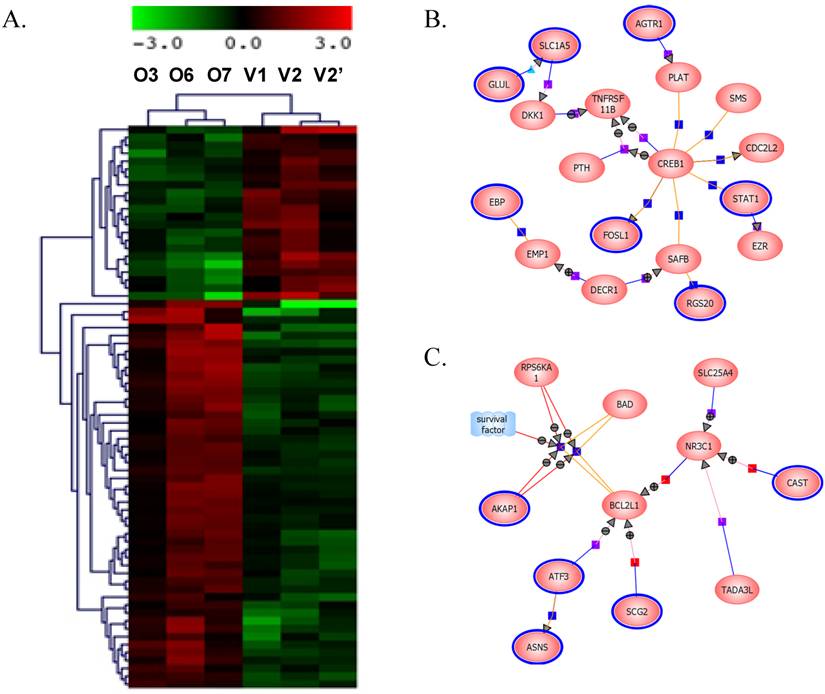
BP1 overexpression affects gene expression profile in Hs578T cell line: Affymetrix Human Genome focused array was used to assess gene expression profile and identify differentially expressed genes in comparison of the BP1 overexpressing cell lines (O3, O6 and O7) and empty vector controls (V1 and V2). The array data (.CEL file) for all 6 samples (one for each clone except V2 was hybridized twice) were analyzed using GeneSpring GX. A total of 7843 out of 8793 passed the filter input satisfying the upper and lower percentile cutoffs 20-100% for statistical analysis. Using T Test unpaired asymptotically, 376 entities of 7843 satisfy p-value cutoff of 0.05. Further, fold change cutoff =>2.0 showed that 71 of 376 genes are differentially expressed, with 49 up-regulated and 22 down-regulated (Table 1). Hierarchical Clustering of the 376 transcripts using GeneSpring GX program were shown (Figure 4A). From the 71 differentially expressed genes, we identified significant pathways using the GeneSpring GX satisfying corrected p-value cut-off of 0.05, which includes CREB (cAMP responsive element-binding protein) signaling (Figure 4B), BCL2L1 (Figure 4C), AKT signaling, apoptosis, androgen receptor pathways, etc.
A representative list of 41 out of 71 differentially expressed genes and their function.
Gene expression data clustering and pathway identification. A. Hierarchical Entity Trees showing 376 significantly changed genes using GeneSpring GX. Left 3 panel shows the BP1 overexpressing replicates (O3, O6 and O7), while the right panels are the control replicates (V1, V2 and V2'). Color scale bar indicates up-regulation in red and down-regulation in green. B. Differentially regulated genes by BP1 involved in CREB1 pathways. CREB1, as an oncogenic transcription factor, induces transcription of genes in response to hormonal stimulation of the cAMP pathway. C. BP1 regulated genes involved in BCL2L1 pathways. BCL2L1 is a BCL-2 protein family member that act as anti- or pro-apoptotic regulators involving in a wide variety of cellular activities.
DISCUSSION
A major goal of breast cancer research has been to identify specific targets that are unique to particular cancer cells and to identify drugs that will kill only cancer cells without affecting normal tissue. The purpose of this study was to test the effects of BP1 overexpression in ER- breast cancer, which may shed light of the role of BP1 in breast cancer. Eventually, the goal is to establish BP1 as a “druggable” target for the treatment of ER- breast cancer, and in particular, triple-negative breast cancer, which is characterized as ER-, progesterone receptor (PR-) negative, and HER2-negative.
ER- breast cancer account for 30-40% of breast cancers and are poorly responsive to traditional therapies. Current chemotherapy is generally toxic and is not specifically targeted to ER- breast cancer. This study shows that a high level of BP1 expression significantly enhances cell proliferation rate and the invasiveness in ER- Hs578T breast cancer cells. These data also support the finding that BP1 overexpression promotes the survival of MCF7, an ER+ breast cancer cell line, when challenged by TNFα treatment [17]. An increased proliferation rate and a high degree of invasiveness are two main characteristics of cancer cells; these two parameters may determine the severity of the cancer [21]. Across the genome, a key alteration of cells during cancer development is the up-regulation or activation of oncogenic factors, and the down-regulation or inactivation of tumor suppressor genes [22].
To elucidate the mechanism of BP1 in cell proliferation and invasiveness, a microarray assay has identified 376 significantly changed genes using GeneSpring GX as clustered (Figure 4A). A partial gene list from the fold change of >=2 is show in Table 1. These genes are involved in cell cycle regulation, tumor invasiveness, cell adhesion, receptor signaling, cell transformation and tumor progression. Regulation of the expression of these genes by BP1 indicates that BP1 is a significant gene which could be a promising target in breast cancer treatment. Further analysis has identified several important molecular pathways using the differentially expressed gene list, including CREB signaling (Figure 4B), BCL2L1 (Figure 4C), AKT signaling, apoptosis, androgen receptor pathways, etc. CREB1, as an oncogenic transcription factor, induces transcription of genes in response to hormonal stimulation of the cAMP pathway. It has been reported that CREB may act as a positive transcription regulator of aromatase and hence increased expression and estrogen synthesis in breast cancer cells [23]. CREB1 expression in breast cancer patients is significantly increased in patients with a poor prognosis, metastatic disease and nodal involvement [24]. CREB1 can be activated through phosphorylation by a number of kinases, including AKT, protein kinase A, and calcium/calmodulin-dependent kinases and regulates genes whose deregulated expression promotes oncogenesis, including cyclins, BCL2 family members, and EGR1. It was reported that BP1 can directly bind to and activate the expression of BCL1, which is an antiapoptotic gene and considered to be an oncogene [17]. BCL2L1 is a BCL2 protein family member that acts as anti- or pro-apoptotic regulators involving in a wide variety of cellular activities [25]. The proteins encoded by this gene are located at the outer mitochondrial membrane, and have been shown to regulate outer mitochondrial membrane channel (VDAC) opening. VDAC regulates mitochondrial membrane potential to control the production of reactive oxygen species and release of cytochrome C by mitochondria, both of which are the potent inducers of cell apoptosis. Two alternatively spliced transcript variants, which encode distinct isoforms, have been reported. The longer isoform acts as an apoptotic inhibitor and the shorter form acts as an apoptotic activator.
CONCLUSIONS
These data demonstrated that overexpression of BP1 significantly enhanced cell proliferation and metastatic potential in ER- Hs578T cells. BP1 may be an important modulator for ER- breast tumor metastasis through a variety of molecular pathways. Further analysis is warranted to establish BP1 as a therapeutic target.
ABBREVIATIONS
ER: estrogen receptor; RT: reverse transcription; QPCR: quantitative real time polymerase chain reaction.
Acknowledgements
We would like to thank the support from Dr. Alan Wasserman, Chairman of Department of Medicine and Dr. Jim Scott, Dean of School of Medicine and Health Sciences at the George Washington University. This work was supported by NIH grant CA102928 (SWF).
Conflict of Interest
The authors have declared that no conflict of interest exists.
References
1. Society AC. Atlanta. American Cancer Society, Inc. http://www.cancer.org
2. Krumlauf R. Hox genes in vertebrate development. Cell. 1994;78(2):191-201
3. Hayashi S, Scott M.P. What determines the specificity of action of Drosophila homeodomain proteins? Cell. 1990;63(5):883-94
4. Pellerin I. et al. Hox proteins have different affinities for a consensus DNA site that correlate with the positions of their genes on the hox cluster. Mol Cell Biol. 1994;14(7):4532-45
5. Duboule D. Guidebook to the Homeobox Genes. New York: Oxford University Press. 1994
6. Tupler R, Perini G, Green M.R. Expressing the human genome. Nature. 2001;409(6822):832-3
7. Apiou F. et al. Demonstration of homoeologies between human and lemur chromosomes by chromosome painting. Cytogenet Cell Genet. 1996;72(1):50-2
8. Fu S. et al. Distinct functions of two isoforms of a homeobox gene, BP1 and DLX7, in the regulation of the beta-globin gene. Gene. 2001;278(1-2):131-9
9. Abate-Shen C. Deregulated homeobox gene expression in cancer: cause or consequence? Nat Rev Cancer. 2002;2(10):777-85
10. Chen H, Sukumar S. Role of homeobox genes in normal mammary gland development and breast tumorigenesis. J Mammary Gland Biol Neoplasia. 2003;8(2):159-75
11. Chen H, Sukumar S. HOX genes: emerging stars in cancer. Cancer Biol Ther. 2003;2(5):524-5
12. Chun S.Y. et al. CDX2 promotes anchorage-independent growth by transcriptional repression of IGFBP-3. Oncogene. 2007;26(32):4725-9
13. Peverali F.A. et al. Expression of HOX homeogenes in human neuroblastoma cell culture lines. Differentiation. 1990;45(1):61-9
14. Cillo C. et al. HOX gene expression in normal and neoplastic human kidney. Int J Cancer. 1992;51(6):892-7
15. Fu S.W. et al. Correlation of expression of BP1, a homeobox gene, with estrogen receptor status in breast cancer. Breast Cancer Res. 2003;5(4):R82-7
16. Man Y.G. et al. Expression of BP1, a novel homeobox gene, correlates with breast cancer progression and invasion. Breast Cancer Res Treat. 2005;90(3):241-7
17. Stevenson H.S. et al. BP1 transcriptionally activates bcl-2 and inhibits TNFalpha-induced cell death in MCF7 breast cancer cells. Breast Cancer Res. 2007;9(5):R60
18. DFC Institute. Study aims to solve puzzle of ER-negative breast tumors. US: DFC Institute. 2003
19. Rusiecki J.A. et al. Breast cancer risk factors according to joint estrogen receptor and progesterone receptor status. Cancer Detect Prev. 2005;29(5):419-26
20. Song Y. et al. Genome-wide analysis of BP1 transcriptional targets in breast cancer cell line Hs578T. Int J Biol Sci. 2009;5(1):1-12
21. Hunt W. Molecular Biology of the Cell, Fourth Edition: A Problems Approach. UK: Garland Science. 2002
22. Johnstone RW, Ruefli AA, Lowe SW. Apoptosis: a link between cancer genetics and chemotherapy. Cell. 2002;108(2):153-64
23. Sofi M. et al. Role of CRE-binding protein (CREB) in aromatase expression in breast adipose. Breast Cancer Res Treat. 2003;79(3):399-407
24. Chhabra A. et al. Expression of transcription factor CREB1 in human breast cancer and its correlation with prognosis. Oncol Rep. 2007;18(4):953-8
25. Vander Heiden M.G, Thompson C.B. Bcl-2 proteins: regulators of apoptosis or of mitochondrial homeostasis? Nat Cell Biol. 1999;1(8):E209-16
Author contact
![]() Corresponding author: Sidney W. Fu, M.D., Ph.D., Associate Professor, Director, The Genomics Core FacilityDept. of Biochemistry and Molecular Biology, and of Surgery, The George Washington University Medical Center, 2300 I Street, N.W. Room 522A, Washington, DC 20037. Email: sfuedu; 202-994-4767 (Office), 202-994-0691 (Lab); Fax: 202-994-2487.
Corresponding author: Sidney W. Fu, M.D., Ph.D., Associate Professor, Director, The Genomics Core FacilityDept. of Biochemistry and Molecular Biology, and of Surgery, The George Washington University Medical Center, 2300 I Street, N.W. Room 522A, Washington, DC 20037. Email: sfuedu; 202-994-4767 (Office), 202-994-0691 (Lab); Fax: 202-994-2487.