3.2
Impact Factor
ISSN: 1837-9664
J Cancer 2010; 1:80-92. doi:10.7150/jca.1.80 This volume Cite
Review
Cancer Response Criteria and Bone Metastases: RECIST 1.1, MDA and PERCIST
1. Department of Diagnostic Radiology, Division of Diagnostic Imaging, University of Texas M. D. Anderson Cancer Center, Houston, Texas 77030, USA
2. Division of Nuclear Medicine, University of Texas M. D. Anderson Cancer Center, Houston, Texas 77030, USA
3. Department of Breast Medical Oncology, University of Texas M. D. Anderson Cancer Center, Houston, Texas 77030, USA
Published 2010-6-28
Abstract
Response criteria represent the standard by which the efficacy of therapeutic agents is determined in cancer trials. The most widely used criteria are based on the anatomic measurement of solid tumors. Because bone metastases are typically located in irregularly shaped bones and are difficult to measure with rulers, they have been previously considered unmeasurable disease. New developments in cancer response criteria have increased awareness of the importance of the response of bone metastases to therapy. The recently updated Response Evaluation Criteria in Solid Tumors (RECIST 1.1) now consider bone metastases with soft tissue masses > 10 mm to be measurable disease. Response criteria specific to bone metastases have been developed at The University of Texas MD Anderson Cancer Center (MDA criteria) and can be used to assess therapeutic response in numerous types of bone metastases. Functional imaging criteria, such as the recently developed Positron Emission Tomography Response Criteria in Solid Tumors (PERCIST) allow response to be measured in the absence of anatomic change through assessment of metabolic activity. As monitoring tumor response of bone metastases becomes more important in the management of cancer, so does the demand on radiologists and nuclear medicine physicians for accurate interpretation of the behavior of these lesions. This article reviews anatomic, bone, and metabolic response criteria, providing illustrations for the interpretation of therapy-induced change in bone metastases.
Keywords: RECIST 1.1, PERCIST, MDA, bone, response criteria, metastasis
Introduction
An estimated 569,490 Americans are expected to die of cancer in 2010, accounting for approximately 25% of the overall mortality (1). Bone metastases are a common manifestation of advanced disease with autopsy studies showing an incidence of 33-36% in patients with lung cancer (2, 3), 68% in prostate cancer (3), and 73% in breast cancer (2, 3). While many patients receive therapy at major cancer centers, numerous other patients choose local or regional hospitals, and most imaging studies include the skeleton secondarily if not primarily (e.g. chest radiography, body computed tomography [CT]). Thus, the appearance and behavior of bone metastases can be detected on a wide variety of imaging studies that are performed for many different indications.
Response criteria represent the standard by which the efficacy of new therapeutic agents is determined in cancer treatment trials. The most commonly used set of criteria is the Response Evaluation Criteria in Solid Tumors (RECIST). These and similar anatomic criteria focus predominantly on the physical measurement of solid tumors. Disease that is not easily measurable with a ruler or calipers, such as most bone metastases, is designated as unmeasurable. Cancer patients with no measurable disease (e.g. individuals with bone-only metastases following the resection of a primary tumor) are often ineligible for clinical trials, which may be the only available source of therapy. Therefore, the absence of measurable tumors can significantly affect patient disease management. This article reviews anatomic (RECIST 1.1), bone (MD Anderson [MDA]), and metabolic (Positron Emission Tomography Response Criteria in Solid Tumors [PERCIST]) cancer response criteria, with a focus on the developing role of bone metastases and the interpretation of the treatment response of bone metastases seen on imaging studies.
RECIST 1.1
Change in tumor size following therapy, also known as objective response (4, 5), is a robust indicator of outcome in the treatment of numerous solid tumors (6-9) and forms the basis for anatomic response criteria. RECIST (10), updated to RECIST 1.1 in 2009 (11), was designed to standardize the assessment of therapeutic response to allow meaningful comparison of drug efficacy among individuals in the same study and across different studies (12, 13). RECIST 1.1 specifies that up to 5 target lesions, representing all affected organ systems but with no more than 2 target lesions per organ, be selected for measurement throughout the course of a therapeutic trial. To be considered as target lesions, at baseline nodules must measure ≥ 10 mm on CT (or twice the slice thickness if the interval is > 5 mm), the short axes of lymph nodes must measure ≥ 15 mm on CT (recommended slice thickness is ≤ 5 mm), palpable masses must be ≥ 10 mm as measured with calipers; and lung lesions must be ≥ 20 mm, clearly delineated, and surrounded by lung parenchyma on chest radiographs. Lesions may be measured using CT or magnetic resonance imaging (MRI), but CT is preferred in most situations because of the variability of MRI scan parameters. Measurements made using ultrasonography are not acceptable because of operator dependency and lack of objective reproducibility.
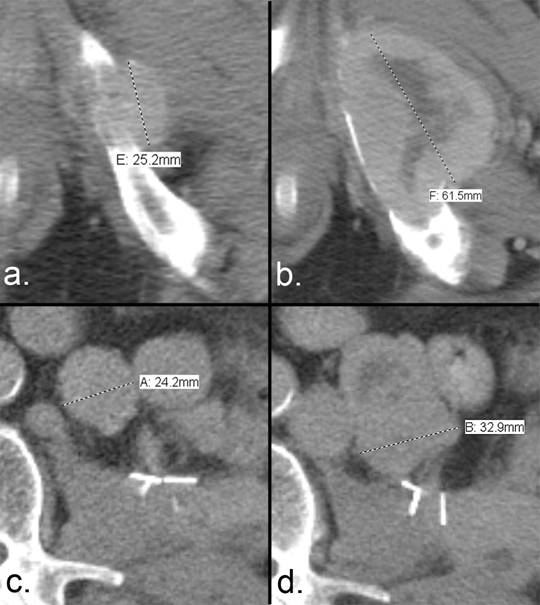
According to RECIST 1.1, drug efficacy is primarily determined by the sum of the measurements of the greatest longitudinal dimension of each target lesion. One of the differences between RECIST and RECIST 1.1 is that bone metastases with soft tissue masses measuring ≥ 10 mm are now accepted as target lesions. The soft tissue component is to be measured in an identical manner to that used for other target lesions (Fig. 1). Measurements are to be made in the plane of acquisition (typically axial for CT unless isotropic reconstructions are performed). The largest lesions are preferred if they are clearly and reproducibly measurable (e.g. the largest well-defined lesion is preferred over larger, ill-defined lesions), and no previously irradiated lesion is eligible as a target lesion unless it demonstrates progression after irradiation. Therefore, a careful search of the medical record for previous therapeutic radiation exposure is indicated prior to the selection of a bone metastasis as a target lesion.
RECIST 1.1 states that CT is “the best currently available and reproducible method to measure lesions selected for response assessment” (11). However, MRI has been shown superior to CT in delineating the extent of primary bone tumors (which are similar to target bone lesions because they typically produce large soft tissue masses) and their relationship to adjacent structures (14, 15). The value of the high soft tissue contrast resolution of MRI was shown in a prospective study comparing MRI and CT for the detection of locally recurrent tumors in 49 patients following the resection of musculoskeletal malignancies (16). In the 33 biopsy-proven locally recurrent tumor nodules, MRI demonstrated sensitivity, specificity, and accuracy of 82.5%, 96.3%, and 92.6%, respectively; CT values for sensitivity, specificity, and accuracy were 57.5%, 96.3%, and 85.0%, respectively. MRI scans with and without the use of intravenous gadolinium contrast can be considered for the follow-up of measurable bone lesions. RECIST 1.1 specifies contrast administration for both MRI and CT scans.
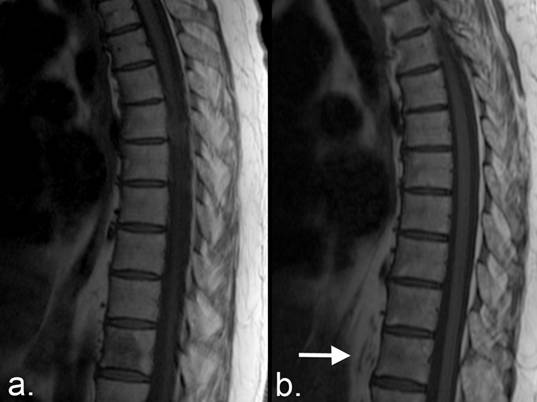
The 4 response categories included in RECIST 1.1 are complete response (CR), partial response (PR), progressive disease (PD), and stable disease (SD) (Table 1). CR is defined as the disappearance of all target lesions and reduction of the short axes of target lymph nodes to < 10 mm. Fludeoxyglucose F18 (FDG) positron emission tomography (PET) can be used in place of biopsy to verify CR when a residual mass is thought to represent scarring or fibrosis. The PR category requires a decrease in the sum of the diameters of all target lesions by ≥ 30%; the patient's baseline sum of these diameters is the reference standard. PD requires an increase of ≥ 20% (with at least a 5-mm increase) in the sum of target lesion diameters; again, the patient's smallest recorded sum of these diameters is the reference standard. Additionally, the interval development of a malignant FDG uptake pattern is considered an indicator of PD unless it corresponds to an anatomically stable lesion. The metastasis is to be confirmed on contemporaneous or follow-up CT (Fig. 2). The SD category includes all patients whose disease activity does not meet the requirements of the other 3 categories using the smallest previous sum of lesion diameters as the reference standard.
RECIST 1.1 designates numerous lesions as unmeasurable. These include small tumors (nodules with a short-axis dimension < 10 mm), leptomeningeal disease, lymphangitic spread, inflammatory breast disease, pericardial/pleural effusions, palpable abdominal masses/organomegaly not reproducible on imaging studies, lesions surrounded by postradiation scar tissue, and bone metastases without soft tissue masses measuring ≥ 10 mm (the large majority of bone metastases). While no focus of unmeasurable disease can be used as a target lesion, the progression of such tumors can have an effect on the RECIST response assessment under the designation of unequivocal progression of nontarget lesions. In general, progression of nontarget lesions is to be estimated as a 20% increase in the sum of the greatest tumor diameters, which is calculated to be a 73% increase in volume, by the authors of the RECIST criteria (11). Therefore, frank progression of bone metastases on any imaging modality can contribute to the classification of overall patient response through the designation of unequivocal progression (Fig. 3).
Measurement of disease progression using the RECIST 1.1 criteria. (a) Axial CT of the pelvis and abdomen of a patient with renal cell carcinoma demonstrates a bone metastasis in the left inferior pubic ramus. The soft tissue component is > 10 mm, and (b) the short-axis diameter of the left retroperitoneal lymph node metastasis is >15 mm; both are considered measurable according to RECIST 1.1. The sum of the longest diameters is used to assess tumor response. (c) The bone metastasis has increased from 25.2 mm to 61.5 mm, and (d) the nodal metastasis has increased from 24.2 mm to 32.9 mm. The sum of the 2 lesions at the first time point is 49.4 mm, and the sum at the second time point is 94.4 mm. This increase of 91% exceeds the required > 20% increase that is necessary to qualify for the progressive disease category.
Response Evaluation Criteria in Solid Tumors (RECIST 1.1)*
| Response category | Criteria |
|---|---|
| Complete response | Disappearance of all target lesions |
| Reduction in short axis of target lymph nodes to < 10 mm | |
| Partial response | Decrease in target lesion diameter sum ≥ 30%† |
| Progressive disease | Increase in target lesion diameter sum ≥ 20%‡ |
| ≥ 5 mm increase in target lesion diameter sum | |
| New, malignant FDG uptake in the absence of other indications of progressive disease or an anatomically stable lesion, and confirmed on contemporaneous or follow-up CT | |
| Unequivocal progression of nontarget lesions | |
| Stable disease | Does not meet other criteria‡ |
*Measurements are based on the sum of the unidimensional measurement of the greatest diameter of a maximum 5 lesions.
†Reference standard: baseline sum.
‡Reference standard: smallest recorded sum.
Table modified from Eisenhauer et al. (11).
Use of FDG PET/CT according to the RECIST 1.1 criteria. (a) CT of the L3 vertebra in a patient with breast cancer reveals no indication of bone metastases. (b) Focal FDG uptake indicative of metastatic disease is present on PET/CT. The interval development of an FDG-avid focus, in the absence of any other indication of disease progression, is considered progressive disease under RECIST 1.1 unless it corresponds to a pre-existing, anatomically stable abnormality. RECIST 1.1 specifies that the metastasis is to be confirmed on a follow-up CT.(c) A fat-saturated T1-weighted axial MRI image obtained following the administration of intravenous contrast was available and reveals an enhancing lesion in the location of FDG uptake (arrowheads), confirming the presence of the metastasis.

Unequivocal progression of unmeasurable disease according to the RECIST 1.1 criteria. (a)T1-weighted axial MRI of a patient with renal cell carcinoma demonstrates a small metastasis in the marrow cavity of the distal phalanx of the left great toe (arrow). Bone disease without a soft tissue mass ≥ 10 mm is considered unmeasurable disease under RECIST 1.1. (b) Eight months later, the metastasis has markedly enlarged, representing unequivocal progression of unmeasurable disease. (c) A frontal radiograph of the foot demonstrates complete cortical lysis of the distal phalanx. The toenail is evident (arrowhead). Periarticular osteopenia is likely secondary to disuse.

MDA Criteria
The field of oncology has seen several generations of cancer response criteria. The International Union Against Cancer (UICC) (17) and the World Health Organization (WHO) (4) published criteria in 1977 and 1979, respectively. While at the time representing the most sophisticated attempts to standardize the evaluation of tumor response, these criteria were published before the widespread availability of CT. Both sets of criteria, which have been largely supplanted by RECIST and RECIST 1.1, consider bone metastases to be measurable disease. Additionally, the WHO criteria include radiograph-based guidelines for the interpretation of bone metastases; however, these guidelines were not adopted by RECIST or RECIST 1.1. The resultant void regarding the evaluation of bone metastases led to the development of bone-specific response criteria at The University of Texas MD Anderson Cancer Center in 2004 (18). The MDA criteria updated the UICC and WHO bone response criteria by expanding radiographic assessment and incorporating both CT and MRI.
The MDA criteria divide response into 4 standard categories (CR, PR, PD, and SD) and include quantitative and qualitative assessments of the behavior of bone metastases (Table 2). PR is defined as a decrease of ≥ 50% in the sum of the perpendicular measurements of any lesion and PD as an increase of ≥ 25% in this sum.
MD Anderson (MDA) criteria*
| Response category | Criteria |
|---|---|
| Complete response | Complete sclerotic fill-in of lytic lesions on XR or CT |
| Normalization of bone density on XR or CT | |
| Normalization of signal intensity on MRI | |
| Normalization of tracer uptake on SS | |
| Partial response | Development of a sclerotic rim or partial sclerotic fill-in of lytic lesions on XR or CT. |
| Osteoblastic flare - Interval visualization of lesions with sclerotic rims or new sclerotic lesions in the setting of other signs of PR and absence of progressive bony disease | |
| ≥ 50% decrease in measurable lesions on XR, CT, or MRI | |
| ≥ 50% subjective decrease in the size of ill-defined lesions on XR, CT, or MRI | |
| ≥ 50% subjective decrease in tracer uptake on SS | |
| Progressive disease | ≥ 25% increase in size of measurable lesions on XR, CT, or MRI |
| ≥ 25% subjective increase in the size of ill-defined lesions on XR, CT, or MRI | |
| ≥ 25% subjective increase in tracer uptake on SS | |
| New bone metastases | |
| Stable disease | No change |
| < 25% increase or < 50% decrease in size of measurable lesions | |
| < 25% subjective increase or < 50% subjective decrease in size of ill-defined lesions | |
| No new bone metastases |
*Measurements are based on the sum of a perpendicular, bidimensional measurement of the greatest diameters of each individual lesion.
Abbreviations: XR, radiography; CT, computed tomography; SS, skeletal scintigraphy; MRI, magnetic resonance imaging.
Table modified from Hamaoka et al. (18).
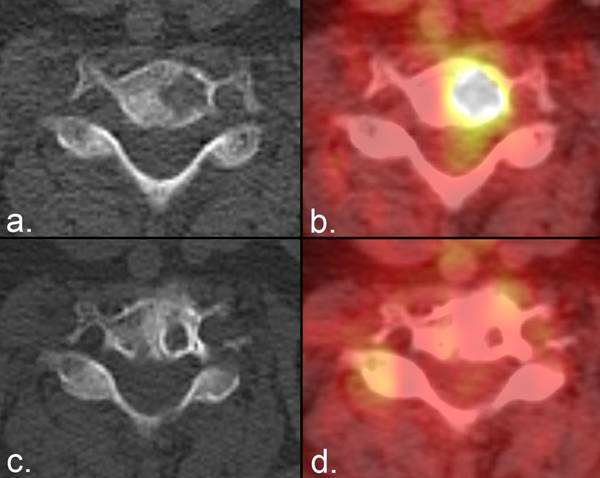
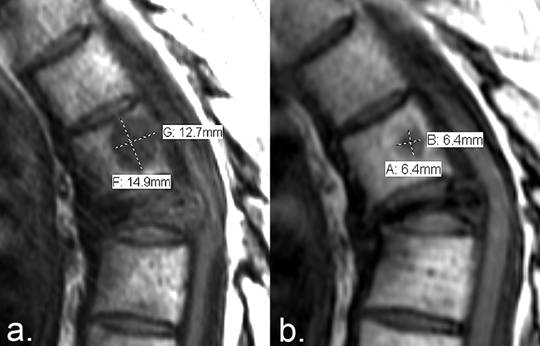
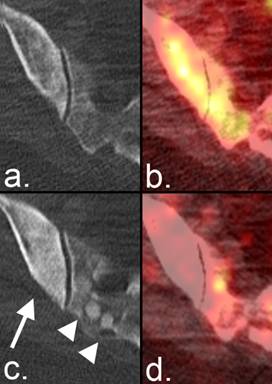
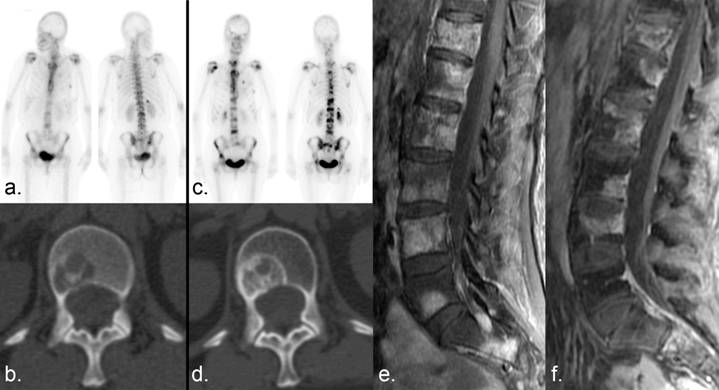
According to the MDA criteria, CR is defined as complete sclerotic fill-in of lytic lesions on radiographs or CT, the restoration of normal bone density on radiography or CT, the disappearance of abnormal tracer uptake on skeletal scintigraphy (SS), and the normalization of signal intensity on MRI (Fig. 4). The PR category includes the development of a sclerotic rim (Fig. 5) or partial (rather than complete) sclerotic fill-in of lytic metastases on radiography or CT; ≥ 50% decrease in the sum of the perpendicular measurements of measurable lesions on radiography, CT, or MRI (Fig. 6); ≥ 50% subjective decrease in the sum of the perpendicular measurements of unmeasurable (ill-defined) lytic or blastic lesions on radiography, CT, or MRI that cannot be accounted for by changes in obliquity or slice placement; and ≥ 50% subjective decrease in tracer uptake on SS (Fig. 7). A caveat to the PR designation involves the osteoblastic flare phenomenon. Interval visualization of sclerotic lesions or lytic lesions with sclerotic rims, in the setting of other signs of PR, does not indicate disease progression but the healing of previously inconspicuous lesions (19). Osteoblastic flare cannot be diagnosed if any preexisting lesions show signs of progression (e.g. enlargement of lytic lesions, development of new lytic lesions) (Fig. 8). PD is defined as ≥ 25% increase in the sum of the perpendicular measurements of any measurable lesion on radiography, CT, or MRI; ≥ 25% subjective increase in the size of unmeasurable (ill-defined) lytic or blastic lesions on XR, CT or MRI that cannot be accounted for by obliquity or slice placement; ≥ 25% subjective increase in tracer uptake on SS; or the development of new metastases. An increase in tracer uptake on SS may need correlation with other imaging studies to exclude the scintigraphic flare phenomenon, which is typically seen within the first 3 months after therapy. Scintigraphic flare occurs when healing sclerosis results in more tracer uptake than was caused by the untreated lesion (Fig. 9) (20-24). SD is defined as < 25% increase or < 50% decrease in size or no change in measurable lesions and no new lesions.
Complete response on MRI using the MDA criteria. (a) T1-weighted sagittal MRI of the thoracic spine of a patient with breast cancer demonstrates a lesion in the T11 vertebral body with abnormally low T1 signal intensity. (b) Eight years later, the lesion has been replaced by normal fat signal (arrow). The upper thoracic spine is slightly tilted in position on the follow-up examination. The response is complete according to the MDA criteria.
Partial response on radiographs according to the MDA criteria. (a) A lytic metastasis is seen in the C7 vertebral body on CT in a patient with breast cancer. (b) Fused PET/CT image from the same examination demonstrates FDG uptake representing active tumor. (c) Five weeks later, the lesion developed a sclerotic rim that resulted in a reduction in the size of the lytic area. (d) Fused PET/CT image from the same examination as (c) shows resolution of FDG activity, confirming the positive anatomic response.
Quantitative measurement of PR using the MDA criteria. (a) T1-weighted sagittal MRI of the thoracic spine of a patient with multiple myeloma demonstrates a lesion with abnormally low T1 signal intensity in the T5 vertebral body. (b) Seven months later, fat reconstitution occurred around the periphery of the lesion, resulting in a decrease in the size of the metastasis. The sum of the perpendicular dimensions of the lesion has decreased from 27.6 mm to 12.8 mm (a 52% reduction in size), qualifying as partial response according to the MDA criteria (≥ 50% reduction required). The metastasis to the severely compressed T6 vertebral body is an example of a lesion that remains unmeasurable with anatomic response criteria.
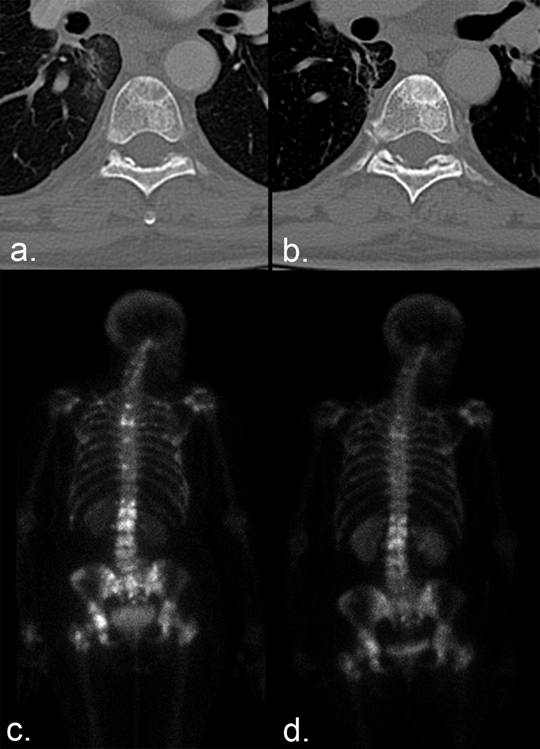
Differentiation of PR from CR using the MDA criteria. (a) CT of the T6 vertebra in a patient with breast cancer demonstrates a mixed lytic/blastic metastasis in the anterior aspect of the vertebral body. (b) The lesion shows complete sclerotic fill-in 3 months later. In isolation, this response qualifies as complete response even though progressive sclerosis may be seen on subsequent examinations. (c, d) However, companion Tc 99m methylene diphosphonate (MDP) bone scans show improvement but not complete resolution of MDP uptake. The patient's response is therefore considered partial.
Osteoblastic flare. (a) The CT portion of an FDG PET/CT of the pelvis of a patient with breast cancer shows scattered lytic and blastic metastases in the bony pelvis. (b) Fused PET/CT shows significant tracer uptake in the right iliac bone and right sacral ala, indicative of metabolically active disease. (c) Nine months later, the iliac lesion demonstrates sclerosis (arrow), and 2 round sclerotic lesions are now seen in the right sacral ala (arrowheads). In isolation, these findings might be representative of disease progression, but lytic lesions in other locations (not shown) demonstrated sclerotic fill-in, raising the possibility of an osteoblastic flare rather than progressive disease. (d) Fused image from the same examination shows marked decrease in metabolic activity, confirming positive response to therapy and osteoblastic flare on the CT portion of the examination.
Scintigraphic flare. (a) Numerous bone metastases show tracer uptake on a Tc 99m MDP bone scan in a patient with breast cancer. (b) Companion CT examination demonstrates a lytic metastasis in the L1 vertebral body. (c) Six months later, the lesions demonstrate increased tracer uptake. (d) Companion CT shows sclerotic fill-in of the lytic lesion, which can occur with disease progression or healing. (e, f) Fat-saturated T1-weighted sagittal MRI examinations of the lumbar spine obtained (e) 1 month and (f) 2 months after the bone scans show a decrease in the size and/or enhancement of the metastases, indicating a positive response to therapy. Incidental note is made of interval insufficiency fracture of the superior endplate of L4 on (f). The increased MDP uptake on the bone scan (b) was the result of healing sclerosis and representative of a scintigraphic flare in a patient undergoing partial response rather than progressive disease.
In a study comparing the MDA, UICC, and WHO criteria in 41 breast cancer patients with bone-only metastases, the MDA criteria were shown to better differentiate responders to chemotherapy from nonresponders and were the only set of criteria to correspond to progression-free survival (25). According to the MDA criteria, time to disease progression was 5.5 months for nonresponders and 23.3 months for responders (P = 0.025), compared with 10.4 months and 12.4 months, respectively, according to the WHO criteria (P = 0.55). The MDA criteria identified nonresponders earlier and better correlated with clinical response in the first 2-6 months of therapy than did the WHO criteria. Early signs of disease progression are valuable, allowing the halting of ineffective therapy in a timely fashion and the possible substitution of effective therapy. In addition to their utility for guiding treatment decisions, the MDA bone response criteria closely reflect the behavior of bone metastases on radiography and CT and can be used as guidelines for the interpretation of these studies whether or not a patient is enrolled in a therapeutic trial. The MDA criteria can be considered for use in conjunction with other cancer response criteria or in patients with bone-only metastases and no measurable disease.
PERCIST
PET has the potential to revolutionize the definition of measurable tumors because it introduces imaging criteria based on function. The regular, well-defined tumor margins that are necessary for reproducible anatomic measurements are of lesser importance in functional imaging. FDG is a radiolabeled form of glucose that cannot be metabolized and therefore accumulates in cells, which take up the molecules as if they were normal glucose. Through this accumulation, FDG activity acts as a surrogate for glucose metabolism (26). Since many malignancies are highly metabolic and accumulate FDG, it is the most commonly used PET agent for oncologic indications. The following review of the PERCIST criteria includes many of the concepts discussed in the source article (27).
Evaluation of tumor response with FDG PET has several advantages over anatomically based criteria. Some chemotherapeutic agents are cytostatic rather than cytocidal and therefore do not result in a profound change in tumor size despite their effectiveness (28-30), and some malignancies, such as gastrointestinal stromal tumors, do not demonstrate PR through a large decrease in size (31). By reflecting change in tumor metabolism, FDG PET scanning can provide a method by which tumor response can be measured in the absence of marked anatomic change (32). A decrease in FDG uptake has been shown to indicate treatment response and/or improved survival times in patients with solid tumors such as breast cancer (33, 34), esophageal cancer (35-37), lung cancer (38, 39), osteosarcoma (40, 41), and others (42). FDG PET has also been shown to provide more rapid response data than anatomic measurements (43-45). FDG PET/CT has also been used to successfully modify disease management (46) by preventing futile thoracotomies in patients with lung cancer (47) and stratifying patients with colorectal cancer into surgical versus palliative groups (48).
Uniformity of measurement and reproducibility of results are of paramount importance in cancer response criteria so that data from one study can be meaningfully compared to data from other studies. Many acceptable scan acquisition parameters are in clinical use, and several previous attempts have been made to standardize PET for cancer trials through guidelines such as those published by the European Organization for Research and Treatment of Cancer (EORTC) (49), the Netherlands Society of Nuclear Medicine (50), and the National Cancer Institute (51). PERCIST, published in the Journal of Nuclear Medicine (27), represents the most recent effort to create standardized criteria that accurately reflect response in the largest number of malignancies. The PERCIST criteria utilize the concept of tumor response as a continuous variable. Because tumor response is inherently continuous, discrete categorization (e.g. CR, PR, PD, and SD) may result in the loss of important information (27, 28, 52). Therefore, PERCIST specifies that the percentage of change in metabolic activity from baseline and the number of weeks from the initiation of therapy be recorded to provide a continuous plot of tumor activity.
The primary determinant of response using PERCIST is the standardized uptake value (SUV), a semiquantitative measure of activity that is most commonly calculated by dividing the measured tumor activity by injected dose/body weight (53). Among the many variants of SUV (e.g. maximum SUV, mean SUV), SUV corrected for lean body mass (SUL) was selected for use with PERCIST because SUL has been shown to be less susceptible to variations in patient body weight than the other SUV metrics (54, 55). PERCIST specifies that the SUL peak is to be obtained on the single most active lesion on each scan. SUL peak is the average of the activity within a spherical region of interest measuring 1.2 cm in diameter (for a volume of 1 cm3) centered at the most active portion of the tumor. The SUL peak may be located in a different lesion on a follow-up scan because the current most avid lesion is to be measured. Using a concept similar to RECIST, it is also recommended that a sum of the activity of up to 5 target lesions (no more than 2 per organ) be measured as a secondary determinant of response. Future studies will show which of the 2 methods of response determination most accurately reflects treatment outcome.
An alternative metric that can be used to determine FDG avidity according to the PERCIST criteria is total lesion glycolysis (TLG). This is a measure of the FDG uptake of the entire tumor above a pre-set threshold and is calculated by multiplying the mean SUV by total tumor volume (mL) (27, 56) TLG has been tested in several malignancies and has produced mixed results in comparison to SUV metrics, showing a weaker correlation with response in bone metastases in breast cancer patients (57) and in sarcomas(41, 58) but equal or better in esophageal, lung, gastric and rectal cancer (59) (60, 61). PERCIST suggests that SUL peak and TLG can be measured simultaneously in order to further evaluate the efficacy of TLG. For further specifics regarding PET scanning, such as information regarding patient preparation and scan acquisition, please see the PERCIST source article by Wahl et al. (55).
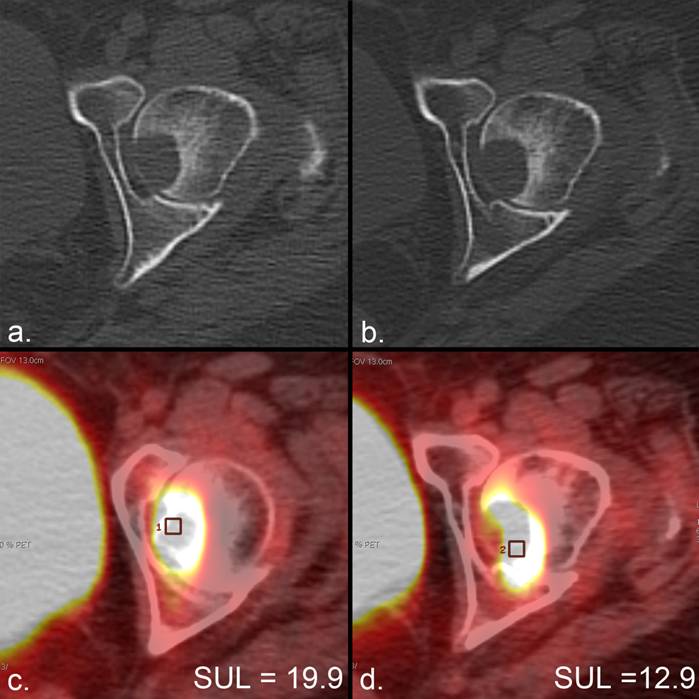
PERCIST defines 4 response categories (Table 3) in addition to plotting tumor response in weeks from the initiation of therapy. Complete metabolic response is defined as the disappearance of metabolic tumor activity in target and nontarget lesions. Residual FDG uptake can be seen despite effective therapy, possibly due to macrophage activity (62), and therefore PERCIST define complete metabolic response as a decrease in tumor SUL to the level of surrounding normal tissue. Partial metabolic response is defined by a decline of > 30% in SUL peak with at least a 0.8-unit decline (Fig. 10). Progressive metabolic disease includes an increase of > 30% in SUL peak with at least a 0.8-unit increase, a visible increase in the extent of FDG uptake (increase in the color field representing FDG uptake), or the development of new lesions. In the absence of clear evidence of disease progression on the fused CT image, new FDG-avid foci are to be verified on a follow-up scan 1 month after discovery. Stable metabolic disease is the absence of change or mild changes that do not meet the minimum qualifications of the other categories. Anatomic change in tumor size remains an important factor under PERCIST and is to be measured according to RECIST 1.1. If lesions increase or decrease in size without a corresponding change in metabolic activity, disease progression or response is to be verified on a follow-up scan.
When evaluating the potential role of functional imaging modalities such as PET, the RECIST working group decided that there was “not sufficient standardization or evidence to abandon anatomical assessment of tumor burden” (11). Considering the numerous areas of potential variability that must be overcome in the acquisition and interpretation of PET/CT scans, this hesitation is understandable. Nevertheless, if the attempt at standardization represented by PERCIST is successful, FDG PET/CT may be considered as an alternative source of disease measurement in future revisions of the RECIST criteria. Functional imaging criteria can also be considered for use in conjunction with anatomic criteria such as RECIST or MDA (Table 4).
Positron Emission Tomography Response Criteria in Solid Tumors (PERCIST)
| Response category | Criteria |
|---|---|
| Complete metabolic response | Normalization of all lesions (target and nontarget) to SUL less than mean liver SUL and equal to normal surrounding tissue SUL |
| Verification with follow-up study in 1 month if anatomic criteria indicate disease progression | |
| Partial metabolic response | > 30% decrease in SUL peak; minimum 0.8 unit decrease* |
| Verification with follow-up study if anatomic criteria indicate disease progression | |
| Progressive metabolic disease | > 30% increase in SUL peak; minimum 0.8 unit increase in SUL peak* |
| > 75% increase in TLG of the 5 most active lesions | |
| Visible increase in extent of FDG uptake | |
| New lesions | |
| Verification with follow-up study if anatomic criteria indicate complete or partial response | |
| Stable metabolic disease | Does not meet other criteria |
*Primary outcome determination is measured on the single most active lesion on each scan (not necessarily the same lesion). Secondary outcome determination is the summed activity of up to 5 most intense lesions (no more than 2 lesions per organ).
Abbreviations: SUL, standardized uptake value using lean body mass; TLG, total lesion glycolysis.
Table modified from Wahl et al. (27).
Comparison of RECIST, MDA and PERCIST
| RECIST | MDA criteria | PERCIST | |
|---|---|---|---|
| Characteristics | Anatomic response criteria for soft tissue metastases | Anatomic response criteria for bone metastases | Functional response criteria reflecting tumor metabolism |
| Advantages | Common use allows direct comparison of the results of different studies | - Allows the response of the majority of bone metastases to be factored into therapeutic response | Allows response determination regardless of the location of the metastasis |
| - Provides response criteria for patients with bone-only disease | |||
| Disadvantages | - Limited to “measurable” soft tissue metastases or unequivocal progression of unmeasurable disease | Limited to bone metastases | Limited to FDG avid metastases |
All criteria are subject to minimum lesion size limitations and PERCIST is also subject to minimum FDG uptake limitations.
Metabolic response according to the PERCIST criteria in the absence of anatomic response. (a) The CT portion of an FDG PET/CT scan in a patient with lung cancer demonstrates a lytic metastasis in the left femoral head. (b) The CT from a PET/CT scan 2 months later demonstrates no anatomic change. (c, d) The standardized uptake value corrected for lean body mass (SUL) peak (average SUL in a 1-cm3 region of interest centered at the most active part of each tumor) changes from (c) 19.8 to (d) 12.9, representing a 35% decrease that satisfies the minimal requirements for partial response (> 30%) according to PERCIST. Assessment of tumor metabolism allowed therapeutic response to be measured in the absence of any other indication of change.
Conclusion
The MDA criteria can allow more bone lesions to be considered measurable disease than does the RECIST 1.1 system by allowing physical measurement of well-defined bone lesions regardless of soft tissue extension, by allowing regimented subjective assessment of ill-defined lesions, and by taking into account characteristic behaviors such as the development of healing sclerosis. Metabolic imaging criteria can allow bone metastases to be measured in the absence of anatomic change by assessing tumor metabolism. Response criteria are of crucial importance to the care of many cancer patients, and the tumor response assessment of bone metastases is assuming a greater role in therapeutic management. Knowledge of the fundamental concepts of tumor response criteria (anatomic, bone, and functional) and the appearance of bone metastases as they respond to treatment or progress can aid in the interpretation of studies in a manner that will render them of optimal value to the patient and clinician.
Conflict of Interest
The authors have declared that no conflict of interest exists.
References
1. Cancer Facts & Figures 2010. American Cancer Society. http://www.cancer.org/downloads/STT/Cancer_Facts_and_Figures_2010.pdf
2. Abrams HL, Spiro R, Goldstein N. Metastases in carcinoma; analysis of 1000 autopsied cases. Cancer. 1950;3:74-85
3. Coleman RE. Clinical features of metastatic bone disease and risk of skeletal morbidity. Clin Cancer Res. 2006;12:6243s-6249s
4. WHO. WHO handbook for reporting results of cancer treatment. Geneva (Switzerland): World Health Organization Offset Publication. 1979
5. Miller AB, Hoogstraten B, Staquet M, Winkler A. Reporting results of cancer treatment. Cancer. 1981;47:207-214
6. Buyse M, Thirion P, Carlson RW, Burzykowski T, Molenberghs G, Piedbois P. Relation between tumour response to first-line chemotherapy and survival in advanced colorectal cancer: a meta-analysis. Meta-Analysis Group in Cancer. Lancet. 2000;356:373-378
7. El-Maraghi RH, Eisenhauer EA. Review of phase II trial designs used in studies of molecular targeted agents: outcomes and predictors of success in phase III. J Clin Oncol. 2008;26:1346-1354
8. Paesmans M, Sculier JP, Libert P. et al. Response to chemotherapy has predictive value for further survival of patients with advanced non-small cell lung cancer: 10 years experience of the European Lung Cancer Working Party. Eur J Cancer. 1997;33:2326-2332
9. Bruzzi P, Del Mastro L, Sormani MP. et al. Objective response to chemotherapy as a potential surrogate end point of survival in metastatic breast cancer patients. J Clin Oncol. 2005;23:5117-5125
10. Therasse P, Arbuck SG, Eisenhauer EA. et al. New guidelines to evaluate the response to treatment in solid tumors. European Organization for Research and Treatment of Cancer, National Cancer Institute of the United States, National Cancer Institute of Canada. J Natl Cancer Inst. 2000;92:205-216
11. Eisenhauer EA, Therasse P, Bogaerts J. et al. New response evaluation criteria in solid tumours: revised RECIST guideline (version 1.1). Eur J Cancer. 2009;45:228-247
12. Tonkin K, Tritchler D, Tannock I. Criteria of tumor response used in clinical trials of chemotherapy. J Clin Oncol. 1985;3:870-875
13. Baar J, Tannock I. Analyzing the same data in two ways: a demonstration model to illustrate the reporting and misreporting of clinical trials. J Clin Oncol. 1989;7:969-978
14. Aisen AM, Martel W, Braunstein EM, McMillin KI, Phillips WA, Kling TF. MRI and CT evaluation of primary bone and soft-tissue tumors. AJR Am J Roentgenol. 1986;146:749-756
15. Harkens KL, Moore TE, Yuh WT. et al. Gadolinium-enhanced MRI of soft tissue masses. Australas Radiol. 1993;37:30-34
16. Reuther G, Mutschler W. Detection of local recurrent disease in musculoskeletal tumors: magnetic resonance imaging versus computed tomography. Skeletal Radiol. 1990;19:85-90
17. Hayward JL, Carbone PP, Heusen JC, Kumaoka S, Segaloff A, Rubens RD. Assessment of response to therapy in advanced breast cancer. Br J Cancer. 1977;35:292-298
18. Hamaoka T, Madewell JE, Podoloff DA, Hortobagyi GN, Ueno NT. Bone imaging in metastatic breast cancer. J Clin Oncol. 2004;22:2942-2953
19. Amoroso V, Pittiani F, Grisanti S. et al. Osteoblastic flare in a patient with advanced gastric cancer after treatment with pemetrexed and oxaliplatin: implications for response assessment with RECIST criteria. BMC Cancer. 2007;7:94
20. Schneider JA, Divgi CR, Scott AM. et al. Flare on bone scintigraphy following Taxol chemotherapy for metastatic breast cancer. J Nucl Med. 1994;35:1748-1752
21. Janicek MJ, Hayes DF, Kaplan WD. Healing flare in skeletal metastases from breast cancer. Radiology. 1994;192:201-204
22. Vogel CL, Schoenfelder J, Shemano I, Hayes DF, Gams RA. Worsening bone scan in the evaluation of antitumor response during hormonal therapy of breast cancer. J Clin Oncol. 1995;13:1123-1128
23. Levenson RM, Sauerbrunn BJ, Bates HR, Newman RD, Eddy JL, Ihde DC. Comparative value of bone scintigraphy and radiography in monitoring tumor response in systemically treated prostatic carcinoma. Radiology. 1983;146:513-518
24. Chao HS, Chang CP, Chiu CH, Chu LS, Chen YM, Tsai CM. Bone scan flare phenomenon in non-small-cell lung cancer patients treated with gefitinib. Clin Nucl Med. 2009;34:346-349
25. Hamaoka T, Costelloe CM, Madewell JE. et al. Tumour response interpretation with new tumour response criteria vs the World Health Organisation criteria in patients with bone-only metastatic breast cancer. Br J Cancer. 2010;102:651-657
26. Bos R, van Der Hoeven JJ, van Der Wall E. et al. Biologic correlates of (18)fluorodeoxyglucose uptake in human breast cancer measured by positron emission tomography. J Clin Oncol. 2002;20:379-387
27. Wahl RL, Jacene H, Kasamon Y, Lodge MA. From RECIST to PERCIST: Evolving Considerations for PET response criteria in solid tumors. J Nucl Med. 2009;50(Suppl 1):122S-150S
28. Michaelis LC, Ratain MJ. Measuring response in a post-RECIST world: from black and white to shades of grey. Nat Rev Cancer. 2006;6:409-414
29. Parulekar WR, Eisenhauer EA. Novel endpoints and design of early clinical trials. Ann Oncol. 2002;13(Suppl 4):139-143
30. Schilsky RL. End points in cancer clinical trials and the drug approval process. Clin Cancer Res. 2002;8:935-938
31. Benjamin RS, Choi H, Macapinlac HA. et al. We should desist using RECIST, at least in GIST. J Clin Oncol. 2007;25:1760-1764
32. Van den Abbeele AD. The lessons of GIST--PET and PET/CT: a new paradigm for imaging. Oncologist. 2008;13(Suppl 2):8-13
33. Dose Schwarz J, Bader M, Jenicke L, Hemminger G, Janicke F, Avril N. Early prediction of response to chemotherapy in metastatic breast cancer using sequential 18F-FDG PET. J Nucl Med. 2005;46:1144-1150
34. Smith IC, Welch AE, Hutcheon AW. et al. Positron emission tomography using [(18)F]-fluorodeoxy-D-glucose to predict the pathologic response of breast cancer to primary chemotherapy. J Clin Oncol. 2000;18:1676-1688
35. Brucher BL, Weber W, Bauer M. et al. Neoadjuvant therapy of esophageal squamous cell carcinoma: response evaluation by positron emission tomography. Ann Surg. 2001;233:300-309
36. Swisher SG, Erasmus J, Maish M. et al. 2-Fluoro-2-deoxy-D-glucose positron emission tomography imaging is predictive of pathologic response and survival after preoperative chemoradiation in patients with esophageal carcinoma. Cancer. 2004;101:1776-1785
37. Wieder HA, Brucher BL, Zimmermann F. et al. Time course of tumor metabolic activity during chemoradiotherapy of esophageal squamous cell carcinoma and response to treatment. J Clin Oncol. 2004;22:900-908
38. Mac Manus MP, Hicks RJ, Matthews JP. et al. Positron emission tomography is superior to computed tomography scanning for response-assessment after radical radiotherapy or chemoradiotherapy in patients with non-small-cell lung cancer. J Clin Oncol. 2003;21:1285-1292
39. Hellwig D, Graeter TP, Ukena D, Georg T, Kirsch CM, Schafers HJ. Value of F-18-fluorodeoxyglucose positron emission tomography after induction therapy of locally advanced bronchogenic carcinoma. J Thorac Cardiovasc Surg. 2004;128:892-899
40. Hawkins DS, Conrad EU3rd, Butrynski JE, Schuetze SM, Eary JF. [F-18]-fluorodeoxy-D-glucose-positron emission tomography response is associated with outcome for extremity osteosarcoma in children and young adults. Cancer. 2009;115:3519-3525
41. Costelloe CM, Macapinlac HA, Madewell JE. et al. 18F-FDG PET/CT as an indicator of progression-free and overall survival in osteosarcoma. J Nucl Med. 2009;50:340-347
42. Weber WA, Wieder H. Monitoring chemotherapy and radiotherapy of solid tumors. Eur J Nucl Med Mol Imaging. 2006;33(Suppl 1):27-37
43. Stroobants S, Goeminne J, Seegers M. et al. 18FDG-Positron emission tomography for the early prediction of response in advanced soft tissue sarcoma treated with imatinib mesylate (Glivec). Eur J Cancer. 2003;39:2012-2020
44. Wahl RL, Zasadny K, Helvie M, Hutchins GD, Weber B, Cody R. Metabolic monitoring of breast cancer chemohormonotherapy using positron emission tomography: initial evaluation. J Clin Oncol. 1993;11:2101-2111
45. Gayed I, Vu T, Iyer R. et al. The role of 18F-FDG PET in staging and early prediction of response to therapy of recurrent gastrointestinal stromal tumors. J Nucl Med. 2004;45:17-21
46. Scott AM, Gunawardana DH, Bartholomeusz D, Ramshaw JE, Lin P. PET changes management and improves prognostic stratification in patients with head and neck cancer: results of a multicenter prospective study. J Nucl Med. 2008;49:1593-1600
47. Fischer B, Lassen U, Mortensen J. et al. Preoperative staging of lung cancer with combined PET-CT. N Engl J Med. 2009;361:32-39
48. Scott AM, Gunawardana DH, Kelley B. et al. PET changes management and improves prognostic stratification in patients with recurrent colorectal cancer: results of a multicenter prospective study. J Nucl Med. 2008;49:1451-1457
49. Young H, Baum R, Cremerius U. et al. Measurement of clinical and subclinical tumour response using [18F]-fluorodeoxyglucose and positron emission tomography: review and 1999 EORTC recommendations. European Organization for Research and Treatment of Cancer (EORTC) PET Study Group. Eur J Cancer. 1999;35:1773-1782
50. Boellaard R, Oyen WJ, Hoekstra CJ. et al. The Netherlands protocol for standardisation and quantification of FDG whole body PET studies in multi-centre trials. Eur J Nucl Med Mol Imaging. 2008;35:2320-2333
51. Shankar LK, Hoffman JM, Bacharach S. et al. Consensus recommendations for the use of 18F-FDG PET as an indicator of therapeutic response in patients in National Cancer Institute Trials. J Nucl Med. 2006;47:1059-1066
52. Karrison TG, Maitland ML, Stadler WM, Ratain MJ. Design of phase II cancer trials using a continuous endpoint of change in tumor size: application to a study of sorafenib and erlotinib in non small-cell lung cancer. J Natl Cancer Inst. 2007;99:1455-1461
53. Stahl A, Ott K, Schwaiger M, Weber WA. Comparison of different SUV-based methods for monitoring cytotoxic therapy with FDG PET. Eur J Nucl Med Mol Imaging. 2004;31:1471-1478
54. Zasadny KR, Wahl RL. Standardized uptake values of normal tissues at PET with 2-[fluorine-18]-fluoro-2-deoxy-D-glucose: variations with body weight and a method for correction. Radiology. 1993;189:847-850
55. Sugawara Y, Zasadny KR, Neuhoff AW, Wahl RL. Reevaluation of the standardized uptake value for FDG: variations with body weight and methods for correction. Radiology. 1999;213:521-525
56. Erdi YE, Macapinlac H, Rosenzweig KE. et al. Use of PET to monitor the response of lung cancer to radiation treatment. Eur J Nucl Med. 2000;27:861-866
57. Tateishi U, Gamez C, Dawood S, Yeung HW, Cristofanilli M, Macapinlac HA. Bone metastases in patients with metastatic breast cancer: morphologic and metabolic monitoring of response to systemic therapy with integrated PET/CT. Radiology. 2008;247:189-196
58. Benz MR, Allen-Auerbach MS, Eilber FC. et al. Combined assessment of metabolic and volumetric changes for assessment of tumor response in patients with soft-tissue sarcomas. J Nucl Med. 2008;49:1579-1584
59. Larson SM, Erdi Y, Akhurst T. et al. Tumor Treatment Response Based on Visual and Quantitative Changes in Global Tumor Glycolysis Using PET-FDG Imaging. The Visual Response Score and the Change in Total Lesion Glycolysis. Clin Positron Imaging. 1999;2:159-171
60. Nakamoto Y, Zasadny KR, Minn H, Wahl RL. Reproducibility of common semi-quantitative parameters for evaluating lung cancer glucose metabolism with positron emission tomography using 2-deoxy-2-[18F]fluoro-D-glucose. Mol Imaging Biol. 2002;4:171-178
61. Guillem JG, Moore HG, Akhurst T. et al. Sequential preoperative fluorodeoxyglucose-positron emission tomography assessment of response to preoperative chemoradiation: a means for determining longterm outcomes of rectal cancer. J Am Coll Surg. 2004;199:1-7
62. Kubota R, Yamada S, Kubota K, Ishiwata K, Tamahashi N, Ido T. Intratumoral distribution of fluorine-18-fluorodeoxyglucose in vivo: high accumulation in macrophages and granulation tissues studied by microautoradiography. J Nucl Med. 1992;33:1972-1980
Author contact
![]() Corresponding author: Colleen M. Costelloe, M.D., Assistant Professor, Department of Diagnostic Radiology, Division of Diagnostic Imaging, Musculoskeletal Section, 1515 Holcombe Boulevard, Unit 1273, Houston, Texas 77030. P: 713-563-0126; F: 713-563-6626.
Corresponding author: Colleen M. Costelloe, M.D., Assistant Professor, Department of Diagnostic Radiology, Division of Diagnostic Imaging, Musculoskeletal Section, 1515 Holcombe Boulevard, Unit 1273, Houston, Texas 77030. P: 713-563-0126; F: 713-563-6626.

 Global reach, higher impact