Impact Factor ISSN: 1837-9664

 Global reach, higher impact
J Cancer 2010; 1:184-196. doi:10.7150/jca.1.184 This volume Cite
Research Paper
Protein Expression Profiling in the Spectrum of Renal Cell Carcinomas
Vladimir A Valera1, Elsa Li-Ning-T1, Beatriz A Walter1, David D. Roberts2, W M Linehan3, Maria J Merino1 ![]()
1. Surgical Pathology Section, Laboratory of Pathology, National Cancer Institute, National Institutes of Health, USA;
2. Biochemical Pathology Section, Laboratory of Pathology, National Cancer Institute, National Institutes of Health, USA;
3. Urologic Oncology Branch, Center for Cancer Research, National Cancer Institute, National Institutes of Health, Bethesda, Maryland 20892, USA.
Received 2010-10-6; Accepted 2010-10-14; Published 2010-10-14
Abstract
In this study, we aimed to evaluate the protein expression profile of a spectrum of renal cell carcinomas (RCC) to find potential biomarkers for disease onset and progression and therefore, prospective therapeutic targets. A 2D-gel based proteomic analysis was used to outline differences in protein levels among different subtypes of renal cell carcinomas, including clear cell carcinomas, papillary lesions, chromophobe tumors and renal oncocytomas. Spot pattern was compared to the corresponding normal kidney from the same patients and distinctive, differentially expressed proteins were characterized by mass spectrometry. Twenty-one protein spots were found differentially expressed between clear cell RCC and normal tissue and 38 spots were found expressed in chromophobe tumors. Eleven proteins were identified, with most differentially expressed -by fold change- between clear cell tumors and the corresponding normal tissue. Two of the identified proteins, Triosephosphate isomerase 1 (TPI-1) and Heat Shock protein 27 (Hsp27), were further validated in a separate set of tumors by immunohistochemistry and expression levels were correlated with clinicopathologic features of the patients. Hsp27 was highly expressed in 82% of the tumors used for validation, and all cases showed strong immunoreactivity for TPI-1. In both Hsp27 and TPI-1, protein expression positively correlated with histologic features of the disease. Our results suggest that the subjacent cytogenetic abnormalities seen in different histological types of RCC are followed by specific changes in protein expression. From these changes, Hsp27 and TPI-1 emerged as potential candidates for the differentiation and prognosis in RCC.
Keywords: Renal cell carcinoma, proteomics, protein profiling, biomarker, Hsp27, TPI-1
Introduction
Renal cell carcinoma (RCC) represents the most common tumor of the kidney in adults and accounts for approximately 3% of all adult malignancies in western countries. In the United States alone, there were estimates of more than 54,000 new cases and about 13,010 deaths in 2008 (1).
Historically RCC has been considered as a single entity. However, significant advances in the classification of the disease during the last decade, resulting from the combined application of molecular biology techniques and thorough histological examination of tumors, are now proving conclusively that renal epithelial neoplasms are not a single tumor but rather a group of distinguishable entities (2). The disease is heterogeneous, with an often unpredictable natural course and with different long-term outcomes for each histological subtype, making diagnosis and treatment challenging.
Cytogenetic studies of renal neoplasms have documented abnormalities in most types of tumors, with chromosomal and genetic aberrations tending to be associated with specific histopathologic patterns (3). For instance, clear cell tumors usually show a highly specific deletion of chromosome 3p, papillary tumors show consistent chromosomal trisomies and loss of chromosome Y, and chromophobe type tumors are characterized by loss of heterozygosity at chromosomes 1, 2, 6 and 10 (4). Such histology-genotype correlations are important, not only in highlighting the basic tumor biology for each histological type, but also in predicting the different prognoses for each type of tumor (5). The complexity of RCCs is further increased due to the conditions in which the disease may appear. This is significant because RCC is the most genetically heterogeneous cancer identified thus far, with tumors appearing in a range of sporadic cases as well in a myriad of hereditary syndromes (6).
Although genetic and cytogenetic markers are widely used in the diagnosis and follow up of RCCs, the majority of tumor markers in routine use for epithelial cancers are based on the measurement of specific proteins, either immunohistochemically or as a circulating form. For instance, clear cell tumors highly express CD10 antigen, which is weakly expressed by papillary type tumors and is negative in chromophobe and collecting duct tumors (7). The same is true for the carbonic anhydrase 9 gene product (CA9), which allows the differentiation between clear cell type and chromophobe tumors (8). Such markers are in some way related to the different histologic origins of each tumor type.
Even though RCC, either in sporadic or familial form, has been demonstrated to be associated with the accumulation of different genetic alterations, the molecular mechanisms leading to the initiation and the progression of this disease are still not well understood (9). Whether these genetic abnormalities are followed by specific changes in the protein expression profiles has not been fully evaluated yet. We postulate that genetic abnormalities related to specific histologic phenotypes can also be related to specific changes at the translational level (i.e. protein levels) that are characteristic of particular histotypes. The present study therefore aimed to further categorize the differential protein expression profiles in a spectrum of RCCs grouped on the basis of their histological features. The goal is to identify potential molecular candidates that may aid in the classification and diagnosis of the disease and that may represent possible targets in the clinical management of patients with kidney cancer.
Materials and Methods
Tissue collection and sample preparation
Sixty-six samples from RCCs and the surrounding noncancerous kidney tissues were obtained from surgical specimens after radical nephrectomy at the NCI clinical center. The study protocol was approved by the Human Subject Research Committee, and the specimens were procured and examined by a surgical pathologist experienced in urologic pathology. The tumor samples used for proteomic analyses were snap-frozen and stored at -80°C until analysis. The remaining parts of the samples were taken and processed for histological examination. The histopathological classification of each tumor was performed according to the 2002 WHO criteria (10). Tumor stage was determined according the 2002 AJCC TNM staging system (11).
Two frozen sections (5µm thick) were cut from each sample and briefly stained in H-E containing protease inhibitors. Enriched tumor and normal cell populations were obtained by needle microdissection under the microscope, and highly vascularized, necrotic and inflammatory areas were avoided during cell procurement. Microdissected cells were collected in 40 µl of lysis buffer consisting of 0.5% SDS in H2O containing protease inhibitors and immediately heated at 95°C for 5 min. One microliter of lysate was used to measure protein concentration by a colorimetric BCA protein assay. Protein yield was highly consistent and ranged from 2.2 to 8.8 mg.ml-1. Total protein was then stored at -80°C until analysis.
Two dimensional polyacrylamide gel electrophoresis (2D-PAGE)
Before electrophoretic separation, samples were reduced and alkylated with tributylphosphine and acrylamide respectively for 30 min in 200mM sodium bicarbonate buffer pH 8.0. Analytical and preparative 2-D gels were performed by loading 50 µg and 1mg of protein respectively, onto nonlinear 3-10 IPG-strips (130mm Immobiline Dry Strips, Amersham Biosciences, Piscataway, NJ) by in-gel rehydration in 250 µl of urea buffer (8 M urea, 2 M thiourea, CHAPS 4% w/v, 65mM DTT, 40mM Tris, 2% sulfobetaine, 2% Pharmalyte® 3-10) overnight. Isoelectric focusing was performed on a Multiphor® IPG unit (Amersham Biosciences, Piscataway, NJ) for a total of 80 kVh, while the second-dimension was carried out on precast (Jule, Inc. Milford, CT) 12.5% polyacrylamide slab gels in SDS-PAGE running buffer. Analytical 2-DE gels were stained with an ammoniac silver solution, while preparative gels were stained with 0.1% w/v CBB R-250 in 0.5% v/v acetic acid: methanol (1:1; v/v) and destained overnight with 20% v/v methanol:water. The gels were scanned with a digital scanner (MicroTek Scanmaker 8700, Microtek, Carson, CA) in transflective mode at 16 bit image depth and stored in TIF format.
Gel analysis
Gels were analyzed with ImageMaster™ 2D platinum software v6.0 (Amersham Biosciences Piscataway, NJ). After image normalization and alignment, the integrated volume and intensity were determined for each identified spot in triplicate gels from each of the RCC tissues and corresponding normal kidney. For the assessment of differentially expressed proteins, only statistically significant spots (p<0.05 by Student's t-test) with at least a 2-fold change that were altered in all tumor samples were selected for MS analysis and identification. Because the aim of this study was biomarker identification, only differentially over expressed proteins spots were used for peptide identification. Furthermore, only spots that were characteristically present in one histological subtype but not in the others were recovered for MS analysis.
In-gel digestion, sample preparation for MALDI-MS and protein identification
Differentially expressed protein spots were excised from gels, destained and dehydrated by washing 2 times for 10-15 min with 50mM NH4HCO3 in 30% CH3CN. The destained spots were then dried for 30 min under vacuum, covered with digestion buffer (50mM NH4HCO3 buffer, pH 8.5) and digested overnight with trypsin (0.06 mg.ml-1) by incubation at 37°C. Polypeptides were then extracted with 20 µl of 1% TFA and the supernatant was removed. A second extraction was performed with 25 µl of 0.1% TFA in 50% CH3CN. The two extracts and the digestion buffer were finally pooled and concentrated by vacuum to 3-5 µl. Tryptic digests were analyzed using matrix-assisted laser desorption/ionization (MALDI) time of flight (MALDI-TOF) ms or ms/ms mass spectrometry using α-cyano 4-hydroxy cinnamic acid as the carrier matrix. The MALDI spectra generated with a mass accuracy of 20 ppm and maximum number of missed cleavages set to one were averaged over 200-400 laser shots, and peptide masses were submitted to SwissProt and NCBInr databases for peptide mass fingerprinting and protein identification using MS-Fit for ms data search [http://prospector.ucsf.edu/] or MASCOT MS/MS v1.8 Ion Search (Matrix Science, London, UK) for ms/ms data analysis. The MALDI mass data were internally calibrated with the masses of two trypsin autolysis products of known amino acid sequence. Contaminant ions from keratin and trypsin were not included in the results. A minimum of four statistically significant unique peptides were considered as positive protein identification.
Immunohistochemistry
Formalin-fixed, paraffin embedded (FFPE) samples were used for validating the identified proteins in tissues. This was carried out in an independent set of samples. Twenty-five samples containing tumor and normal tissue were retrieved from the pathology archives of the NCI and tested. The indirect horseradish peroxidase (HRP)-labeled antibody method was employed for the immunostaining as described previously (12). In brief, 5 µm-thick sections were placed on positive-charged slides and deparaffinized at 60°C 30 min, followed by immersion in Xylene 3 changes of 5 min each. After rehydration in a series of graded alcohols, heat-induced antigen retrieval in a solution of either citrate buffer pH 6.0 or Tris-EDTA pH 8.0 was carried out in a microwave oven for 20 min at 95°C. Samples were allowed to cool at room temperature (RT) and were treated with a solution of 0.3% hydrogen peroxide in methanol for 10 min to inactivate endogenous peroxidase. Slides were washed in TBST 3 changes of 5 min each, and then incubated with either purified mouse anti-heat shock protein 27 (Hsp27) antibody (final concentration 1 µg.ml-1, Cell signaling, Danvers, MA) overnight at 4°C or with rabbit anti-Triosephosphate Isomerase 1 (TPI-1, 1 µg.ml-1, Proteintech, Chicago, IL ) for 1 hr. at RT. These two concentrations were found to provide the best signal-to-noise ratio after dilution testing. In a subset of FFPE tissues, antibodies for Apolipoprotein A-1, Superoxide dismutase, Alpha-enolase and Peroxiredoxin 2 were also evaluated. Isotype-matched antibodies raised in the same species were substituted for the primary antibodies and served as negative controls. Appropriate positive controls were run in parallel. Sections were subsequently incubated with HRP-labeled secondary antibodies for 30 min at room temperature, and the reactions were developed with 0.025% 3,3'-diaminobenzidine solution containing 10 mM hydrogen peroxide, lightly counterstained with Mayer's hematoxylin, and permanently mounted for observation. At least two different sections per sample were analyzed, and staining was annotated as follows: 0, negative; 1+, weak positive, when less than 10% of the cells were positive; 2+, positive, 11-50% positive cells; 3+ strongly positive, more than 50% positive cells. Cellular localization of the immunostaining, nuclear or cytoplasmic, was also recorded.
Statistical analysis
The sample size of 25 patients in the validation group allowed us to estimate at least a 35% difference in protein expression between samples with 80% power at an alpha probability value of 0.05. The relationship between protein markers analyzed by immunohistochemistry and clinicopathological factors was analyzed with the Fisher's exact test based on 10.000 resamples. Statistical analysis were conducted using SPSS v13.0 (SPSS, Chicago IL), and significance was defined as a p value <0.05.
Results
Patients' characteristics
We analyzed the proteomic profiles of the RCC tissue and the corresponding normal kidney tissues in 66 samples from 22 patients with RCC. The mean age of the patients was 53 years (range 39 to 88). Fourteen clear cell RCC, 4 chromophobe, 2 papillary type I tumors and two oncocytomas were included, representing the spectrum of the most commonly seen histologic types of renal neoplasms. Table 1 summarizes the clinical and pathological features of the patients with RCC included for both the proteomic analysis and for validation. The formalin-fixed paraffin embedded samples used for the analysis comprised a group of 25 tumors. The mean age of this second group of patients was 48 years (range: 38-64). Most were clear cell tumors, although other subtypes, such as papillary tumors and oncocytomas, were also included. The difference in the distribution of cases between the two cohorts did not reach statistical significance.
Clinicopathologic characteristics of the patients and samples used for the proteomic analysis and protein validation. No statistically significant difference for the distribution of cases was found.
| Variable | Cases used for protein identification (Discovery group) | Cases used for immunohistochemistry (Validation group) | p-value* | |||
|---|---|---|---|---|---|---|
| N | (%) | N | (%) | |||
| Sex | 0.773 | |||||
| Male | 11 | 50 | 14 | 56 | ||
| Female | 11 | 50 | 11 | 44 | ||
| Age (yrs) | 0.087 | |||||
| mean (range) | 53 | (39-88) | 48 | (38-64) | ||
| Histology | 0.862 | |||||
| Clear cell | 14 | 64 | 19 | 76 | ||
| Papillary | 2 | 9 | 2 | 8 | ||
| Chromophobe | 4 | 18 | 3 | 12 | ||
| Oncocytoma | 2 | 9 | 1 | 4 | ||
| Histological grade | 0.760 | |||||
| 1-2 | 9 | 45 | 9 | 36 | ||
| 3-4 | 11 | 55 | 16 | 64 | ||
| TNM stage | 0.224 | |||||
| I-II | 14 | 70 | 12 | 48 | ||
| III-IV | 6 | 30 | 13 | 52 | ||
Differential protein expression
An average of 905 spots from RCC samples and 850 spots from a corresponding normal kidney samples were typically visualized in a gel (pH range from 3.0-10.0 and a molecular mass range from 10-250 kDa). The overall protein expression patterns in RCC and normal kidney tissues were similar except for some areas (Fig. 1 A-C).
Representative 2-D PAGE images. Full gels are shown for normal kidney (A), a clear cell carcinoma (B) and a chromophobe tumor (C). Composite images (master gels) resulting from combining all samples are shown in panels D-F also for normal, clear cell and chromophobe tumors. Differentially expressed protein spots are shown in panels G-I as indicated by arrowheads.
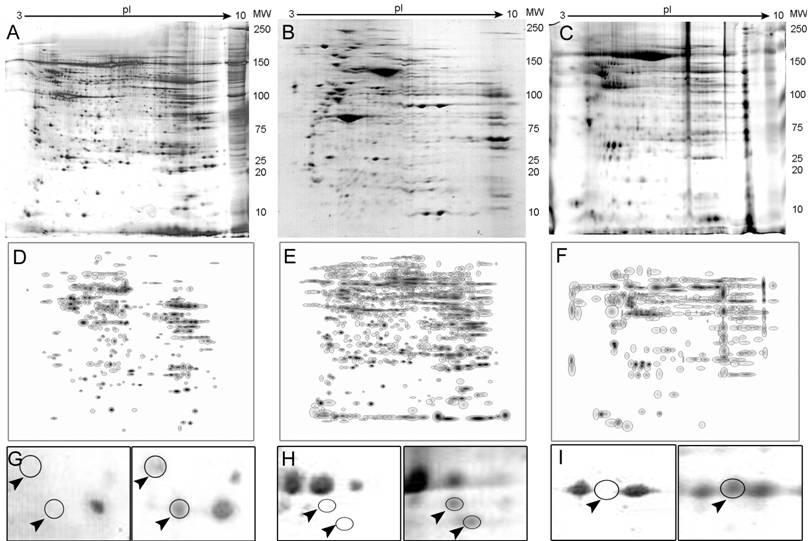
Twenty-one proteins spots were found to be differentially expressed between the clear cell RCC and normal tissue. From these, eight spots were selected and identified by MS. These included Heat Shock protein 27 (Hsp27), Triosephosphate isomerase 1 (TPI-1), Peroxiredoxin 2 (PRX-2), and Apolipoprotein A-1 precursor (APO-A1) among others. Thirty-eight differentially expressed spots were found in chromophobe tumors and 4 were selected for further analysis, which resulted in 2 identifications, ZnCu-Superoxide Dismutase (SOD) and the UV excision repair protein RAD23B. Alpha-Enolase (ENOA) was the only identified protein from the renal oncocytomas, while no significantly different spots could be found between papillary type I tumors and the corresponding non-neoplastic tissue. Differential expression levels for some representative polypeptides in RCCs and the corresponding normal tissue are shown in Fig. 1 G-I.
Overall, 11 proteins were identified, with most differentially expressed proteins found between the clear cell type and the corresponding normal kidney. The predicted and experimental values of isoelectric point (pI), molecular weight (Mw) and relative expression levels for all identified proteins are summarized in Table 2. The average fold change for these differentially expressed proteins in RCC ranged from 2.1 to 13.5 fold. The sequence coverage of proteins isolated from the peptide mass matching ranged from 9 to 57%. Functional annotation analysis of these proteins demonstrated that the majority (5/11, 45.5%) of these polypeptides were related to metabolic pathways. The remaining proteins not related to metabolism were either acute phase reactants or stress response proteins.
Proteins identified by MALDI-TOF that showed significant (p<0.05) upregulation between RCC and the corresponding normal kidney tissue
| Spot ID | Histology | Protein name | Swiss-Prot Accession number | Fold-change | MW/pI (experimental) | MOWSE score | Number of peptides matched (Total no. of peptides) | Sequence coverage |
|---|---|---|---|---|---|---|---|---|
| CC1 | Clear Cell RCC | Heat shock protein 27 (Hsp27) | P04792 | 11.1 | 22,327 / 7.8 | 6.666e+04 | 11 (22) | 42% |
| CC2 | Clear Cell RCC | Triosephosphate isomerase 1 (TPI-1) | P60174 | 7.1 | 22,327 / 6.4 | 1.340e+04 | 8 (16) | 37% |
| CC3 | Clear Cell RCC | Beta globin (HBB) | P68873 | 10.9 | 15,999 / 6.7 | 4.982e+06 | 10 (20) | 76% |
| CC4 | Clear Cell RCC | Peroxiredoxin 2 (PRX-2) | P32119 | 2.1 | 21,892 / 5.6 | 3.237e+04 | 9 (18) | 36% |
| CC5 | Clear Cell RCC | Apolipoprotein A1 precursor (Apo-A1) | P02647 | 3.0 | 28,962 / 5.3 | 5.710e+07 | 17 (44) | 57% |
| CC6 | Clear Cell RCC | Ferritin Light polypeptide | Q6DMM8 | 8.9 | 20,020 / 5.5 | 4.726e+04 | 9 (19) | 42% |
| CC7 | Clear Cell RCC | Haptoglobin | P00738 | 8.0 | 38,234 / 6.1 | 200 | 5 (17) | 9% |
| CHR1 | Chromophobe RCC | ZnCu-Superoxide dismutase (SOD2) | Q7Z7M6 | 5.5 | 18,838 / 5.6 | 1134 | 5 (12) | 43% |
| CHR2 | Chromophobe RCC | UV excision repair protein RAD23B | P54727 | 11.8 | 43,172 / 4.9 | 1.053e+05 | 11(31) | 27% |
| CHR3 | Chromophobe RCC | Alpha-1 anti-trypsin (SERPINA1) | P01009 | 13.5 | 44,251 / 5.5 | 4.065e+04 | 8(22) | 23% |
| ONCO1 | Oncocytoma | Alpha-Enolase (ENOA) | P06733 | 10.4 | 49,703 / 7.1 | 9.403e+05 | 12(34) | 35% |
Immunohistochemical validation
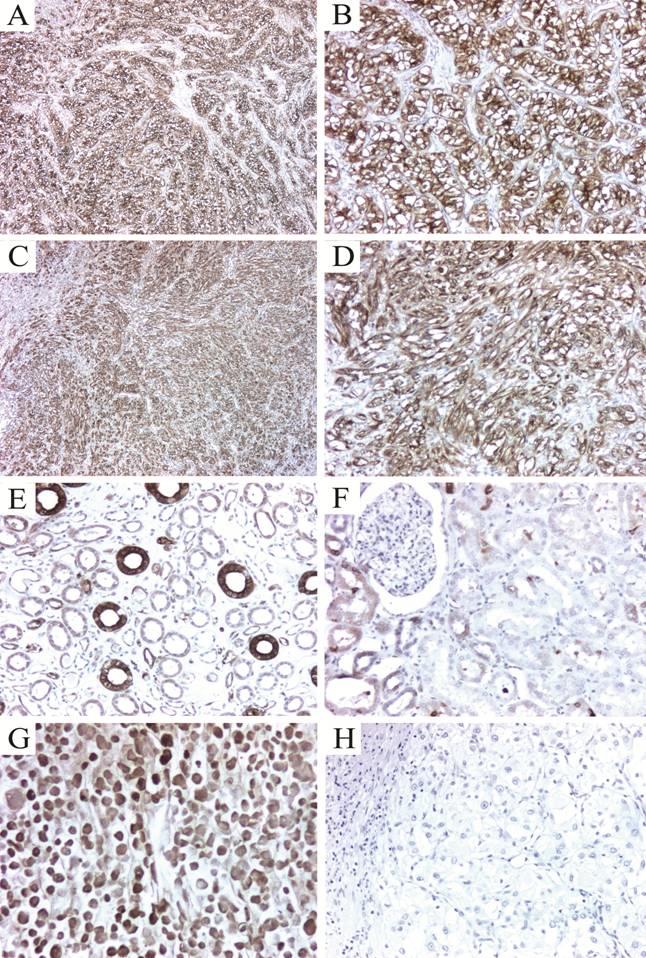
To validate our 2-D protein expression results, we performed immunohistochemical analysis to evaluate the tissue expression of two of the differentially expressed proteins found by the proteomic analysis. The selected proteins, Hsp27 and TPI-1 were chosen as representative of their functional annotation family, stress response proteins and metabolism-related proteins respectively. Almost seventy per cent of the tumors highly expressed Hsp27 (2+ or 3+), with most of them showing cytoplasmic staining (Fig. 2A-D, Table 3). Staining intensity was usually strong when compared to the intensity of endothelial cells (internal positive controls). Glomeruli were consistently negative and expression in the tubules was variable (Fig. 2E-F). In all cases, isotype-matched negative controls resulted in negative staining (Fig. 2H). Triosephosphate Isomerase 1 was found expressed in all cases tested. The staining was cytoplasmic in all cases, even though nuclear staining was observed in 82 % of the samples (Fig. 3A-D). In a subgroup of FFPE samples, other proteins such as Alpha-Enolase, Peroxiredoxin 2, Apolipoprotein A-1 precursor polypeptide, and the mitochondrial ZnCu-Superoxide dismutase were also expressed by tumor and normal cells (data not shown).
Immunohistochemical detection of Hsp27 in renal cell carcinomas. (A) Clear cell carcinoma showing strong cytoplasmic expression of Hsp27. B. A higher magnification to show the intense cytoplasmic and membrane staining. (C-D) A poorly differentiated clear cell carcinoma with sarcomatoid features also strongly expressing Hsp27. Expression in normal kidney was heterogeneous and restricted to some tubules (E). Glomeruli were consistently negative (F). A positive control RCC cell line pellet (786.O) formalin fixed and paraffin embedded demonstrating high Hsp27 expression (G). Isotype-matched negative control (H). Magnification: 5X for panels A and C; 16X for B, D, E-H.
Correlation of Hsp27 expression with some clinicopathological variables.
| Variable | Hsp27 IHC | p Value | |||
|---|---|---|---|---|---|
| 0 - 1+ | 2+ - 3+ | ||||
| N | % | N | % | ||
| Age (yrs) | |||||
| ≤50 | 4 | 16.0 | 11 | 44.0 | 0.614 |
| >50 | 1 | 4.0 | 9 | 36.0 | |
| Sex | |||||
| Male | 4 | 16.0 | 10 | 40.0 | 0.240 |
| Female | 6 | 24.0 | 5 | 20.0 | |
| Tumor size (cm) | |||||
| ≤4 | 2 | 8.0 | 2 | 8.0 | 0.019 |
| 4-7 | 0 | 0.0 | 14 | 56.0 | |
| >7 | 0 | 0.0 | 7 | 28.0 | |
| Histology | |||||
| Clear Cell | 3 | 12.0 | 16 | 64.0 | 0.005 |
| Papillary | 2 | 8.0 | 0 | 0.0 | |
| Chromophobe | 2 | 8.0 | 1 | 4.0 | |
| Oncocytoma | 1 | 4.0 | 0 | 0.0 | |
| Fuhrman grade | |||||
| 1-2 | 2 | 8.3 | 6 | 25.0 | 0.999 |
| 3-4 | 4 | 16.7 | 12 | 50.0 | |
| T category | |||||
| T1-T2 | 6 | 25.0 | 12 | 50.0 | 0.628 |
| T3-T4 | 1 | 4.0 | 5 | 21.0 | |
| N category | |||||
| N0 | 6 | 24.0 | 15 | 60.0 | 0.569 |
| N1 | 2 | 8.0 | 2 | 8.0 | |
| M category | |||||
| M0 | 3 | 12.0 | 9 | 36.0 | 0.410 |
| M1 | 6 | 24.0 | 7 | 28.0 | |
| TNM stage | |||||
| I-II | 4 | 17.0 | 7 | 29.0 | 0.142 |
| III-IV | 1 | 4.0 | 12 | 50.0 | |
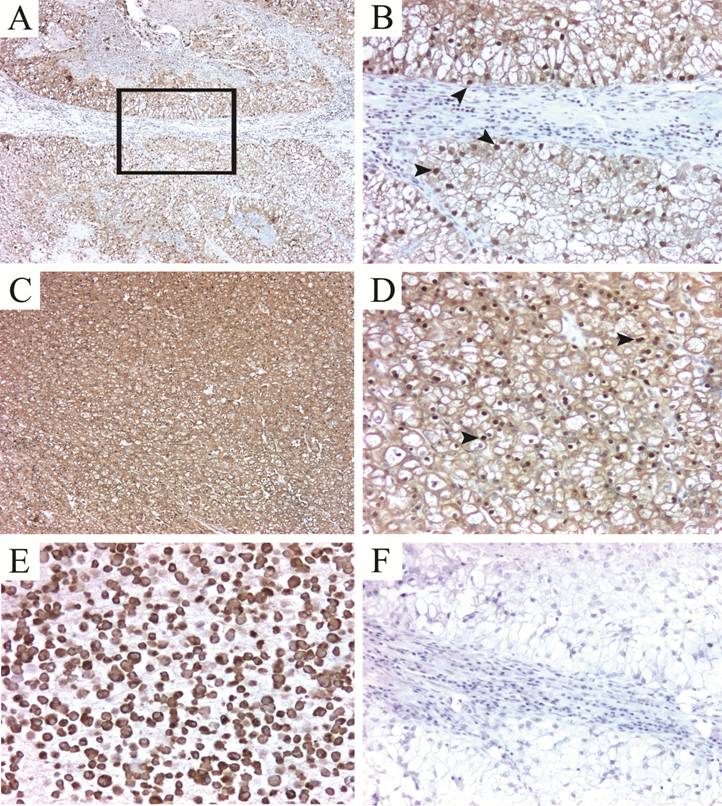
Validation of TPI-1 expression in FFPE RCC tissues. TPI-1 positivity in clear cell carcinomas (A-D). The staining pattern is predominantly mixed cytoplasmic and nuclear (arrowheads). (E) Positve control (786.O cell line pellet) and isotype matched negative control (F). Magnification: 5X for A and C; 16X for B, D, E-F.
Hsp27 and TPI-1 correlation with clinicopathological variables
Immunohistochemical analysis showed that 94 per cent (16 out of 17) of Hsp27 positive cases were of clear cell type (p=0.005). Seventy-five per cent of Fuhrman grade 3-4 cases were moderate or strongly positive for Hsp27. All tumors >4 cm (T1b~) showed positivity when compared to smaller tumors (p=0.019). Seventy-one percent of strongly positive cases for Hsp27 were stage III or IV. For Triosephosphate isomerase 1, 87% of Fuhrman 3-4 cases were strongly positive, with 94% (18 out of 19) of positive cases being clear cell type (p<0.001). There was an inverse correlation of TPI-1 immunostaining and disease progression: most of strongly positive cases were pT categories T1 or T2 (p=0.054) and 56% of strongly positive cases were stage I or II. No significant correlation was observed between Hsp27 or TPI-1 expression and lymph node metastasis, lymphatic invasion, or distant metastasis. Significant correlations of Hsp27 and TPI-1 with clinicopathologic factors are summarized in Tables 3 and 4. No significant relationship for the other proteins identified (Apolipoprotein A-1, Superoxide dismutase, Alpha-enolase and Peroxiredoxin 2) was found.
Clinicopathologic correlation of TPI-1 expression in FFPE samples.
| Variable | TPI-1 IHC | p Value | |||
|---|---|---|---|---|---|
| 0-1 | 2-3 | ||||
| N | % | N | % | ||
| Age (yrs) | |||||
| ≤50 | 2 | 8.0 | 13 | 52.0 | 0.450 |
| >50 | 0 | 0.0 | 10 | 40.0 | |
| Sex | |||||
| Male | 1 | 4.0 | 13 | 52.0 | 1.000 |
| Female | 1 | 4.0 | 10 | 40.0 | |
| Tumor size (cm) | |||||
| <4 | 0 | 0.0 | 4 | 16.0 | 1.000 |
| 4-7 | 0 | 0.0 | 14 | 56.0 | |
| >7 | 0 | 0.0 | 7 | 28.0 | |
| Histology | |||||
| Clear Cell | 1 | 4.0 | 18 | 72.0 | <0.001 |
| Papillary | 1 | 4.0 | 1 | 4.0 | |
| Chromophobe | 3 | 12.0 | 0 | 0.0 | |
| Oncocytoma | 1 | 4.0 | 0 | 0.0 | |
| Furhman grade | |||||
| 1-2 | 0 | 0.0 | 8 | 33.0 | 0.536 |
| 3-4 | 2 | 8.0 | 14 | 58.0 | |
| T category | |||||
| T1-T2 | 0 | 0.0 | 18 | 75.0 | 0.054 |
| T3-T4 | 2 | 8.0 | 4 | 17.0 | |
| N category | |||||
| N0 | 3 | 12.0 | 18 | 72.0 | 0.166 |
| N1 | 2 | 8.0 | 2 | 8.0 | |
| M category | |||||
| M0 | 5 | 20.0 | 7 | 28.0 | 0.695 |
| M1 | 7 | 28.0 | 6 | 24.0 | |
| TNM stage | |||||
| I-II | 2 | 8.0 | 9 | 38.0 | 0.210 |
| III-IV | 6 | 25.0 | 7 | 29.0 | |
Discussion
While a relatively infrequent malignancy, kidney cancer is distinguished by its complexity and its notably unsatisfactory treatment options. During the last two decades, our understanding of the disease has advanced due to the recognition of chromosomal and genetic aberrations in RCCs associated with histologic subtypes. Within this context, the search for markers to improve disease classification, as well as new therapeutic targets, is imperative.
Proteomic profiling is now been widely accepted as a tool for gaining insight into the dynamics of protein pattern changes reflecting complex cellular states, such as tumor versus normal tissue. This technology has been implemented for profiling tumors of different histology in order to define biomarkers which are particularly important for the development of early detection, diagnosis, and prognosis of tumors, and to define therapeutic cancer treatment modalities. The characterization of new RCC-specific markers might allow for a better subclassification of the disease, for the design of new molecular targeted therapeutics, and for defining histologic and molecular correlates for patient selection in clinical trials for RCC.
In this study we identified the expression pattern of metabolic enzymes and stress response proteins in samples from human RCC lesions of distinct subtypes using 2D-gel-based classical proteome analysis. Some of these proteins have previously been shown to have an altered expression in smaller subsets of clear cell RCC using whole tissue samples (13, 14). The earliest reports on the analysis of protein expression patterns in RCC by 2D gel-based proteomics appeared in the late 1990's (15), with ongoing reports on the subject throughout the first half of this decade (14, 16-18). These have largely focused on the clear cell type of tumors with sample sizes varying from 1 to 28 (median=8) specimens per study (19), and only a few have attempted to validate in independent samples some of the differentially expressed proteins found in the 2D gels. As mentioned earlier, significant changes have occurred in the past few years in the classification and understanding of the genetic changes occurring in other subtypes of kidney tumors, but the proteomic approach has not been used consistently with these changes.
To the best of our knowledge, only two studies have examined the proteome of the various types of renal cell carcinoma based on 2D-PAGE analysis of material from tissue samples. Seliger et al. (20) evaluated 25 renal cell carcinomas, which included 20 clear cell, 1 chromophobe and 2 renal oncocytomas. Among the more than 400 differentially expressed proteins, a variable expression pattern of individual fatty acid binding proteins (FABPs) was detected. Three patterns of change were detected: changes in one tumor type but not in the other, which occurred for the H-subtype of FABP (H-FABP) in clear cell and oncocytomas; downregulation in all tumors for L-FABP; and upregulation in all samples for B-FABP. They noted that no confident matching of spots for B-FABP was achieved in any of the samples analyzed, and the expression of only one of the three proteins could be validated in biopsy samples. However, in a RT-PCR validation set of 30 cases, there was positive confirmation of the transcripts in 18 (60%), and strong amplicon bands were observed in only 10 (33%).
Zhuang et al. (21) suggested individual proteome profiles for the different RCC subtypes, which were defined by the presence, absence, up- or downregulation of individual proteins in one tumor subset but not in other subtypes or in normal kidney epithelium. However, their conclusion was based on the analysis of a limited number of samples for each histological subtype (n=3), and no validation of the differentially expressed proteins was achieved.
We have used rather stringent criteria for detecting differentially expressed proteins for intra-class and inter-class comparison, which may explain the reduced number of protein identifications compared to previous studies. In the work of Unwin et al. (22), only 18 proteins were identified initially as differentially upregulated in all of the samples used, but the number of proteins increased to 32 after relaxing criteria of differential expression. In a later report from the same group (20), the identified proteins were significantly either up or downregulated more that 2-fold (a widely accepted threshold for significant change) in only three to five of the 25 tumor-normal pairs.
Many of the identified protein changes in our samples were seen in metabolic enzymes involving glycolysis and oxidative phosphorylation. Some of these changes have been previously reported in RCC based on enzyme activity analysis (22), but the protein expression data in this study not only confirms these reports, but also provides more comprehensive evidence of impaired mitochondrial function and increased dependence on glycolysis as a source of energy in RCC cancer cells. In addition to supporting a disregulation of mitochondrial enzymes involved in oxidative phosphorylation, enzymes involved in other cell energy cycles (including fatty acid and amino acid metabolism) were also found to be altered. Such metabolic alterations may underlie the cytoplasmic accumulation of lipids, glycogen, and mitochondria characteristic of various RCCs.
In order to confirm our proteomic analysis results, we examined by immunohistochemistry two separate proteins which were found to be significantly altered by 2D gel electrophoresis and MS identification. These two proteins, Hsp27 and TPI-1 were selected because they represented the family class or the functional annotation class. Our results highlight an Hsp27 overexpression in RCC compared to the homologous normal tissue. Khan et al. (23) detected high levels of Hsp27 in the proximal tubular epithelium, podocytes, endothelial cells of vessels, and glomeruli (podocytes, endothelial and mesangial cells) of normal kidney. By contrast, in our samples glomeruli were consistently negative for Hsp27 immunoreactivity. In other study, Erkizan et al. (24) evaluated 76 RCC tissue specimens, and the presence of Hsp27 was demonstrated in 73 (96%) of them. The expression was either intermediate or high (i.e >50% of tumor cells) in 88% of the cases and was greater in RCC tissue compared with adjacent noncancerous renal tissue. An inverse relationship was found between tumor stage and Hsp27 expression, but no statistically significant difference was observed in progression-free survival. It is noteworthy that even though the authors analyzed 50 clear cell RCC, 9 papillary, and 11 chromophobe tumors, their results were pooled rather than analyzed by histologic subtype. In our study, no relationship was found between Hsp27 expression and tumor grade, lymph node metastasis, distant metastasis, or cause-specific survival.
Our results are in agreement with those published by Sarto et al.(14), in that Hsp27, evaluated in 15 clear cell RCC samples, was widely expressed in the tubular structures, cytoplasm, cell membrane and the endothelium of the vessels, but was systematically non-reactive in glomeruli. The majority of the renal cell carcinomas in their cohort showed diffuse but strong Hsp27 immunoreactivity in more than 50% of neoplastic cells.
Levels of Hsp27 have also been reported to be elevated not only in kidney cancer (14, 25) but also in other solid tumors, including breast (26), liver (27), ovary (28) prostate (29) and bladder (30), amongst others.
Heat shock proteins (HSP), also termed molecular chaperones, are a group of several ubiquitous proteins originally correlated to increased resistance to thermal shock in damaged cells. HSPs can be induced by different cellular insults including increased temperature, oxidative stress, or pathological conditions, such as ischemia, inflammation, tissue damage, infection and neoplastic transformation (31). Furthermore, HSPs are involved in several cellular functions, including the regulation of cellular homeostasis and apoptosis, and play an important role in tumor antigenicity (32). Specifically, Hsp27 is involved in Actin organization, which appears to be its main physiological function (33), and is phosphorylated in response to heat shock and exposure to other stimuli such as cytokines, growth factors, angiogenesis inhibitors and peptide hormones (34, 35).
Triosephosphate Isomerase 1 (TPI-1) is the enzyme that catalyzes the reversible transformation of D-3-glyceraldehyde phosphate into dihydroxyacetone phosphate. Dihydroxyacetone phosphate is then transformed into D-3-glyceraldehyde phosphate to continue the glycolytic pathway, which explains the importance of TPI-1 in the process of glycolysis (36). Changes in enzyme activity have been reported in a series of normal and pathological conditions, and overexpression of TPI-1 may well relate to increased requirements of both energy and protein synthesis/degradation pathways in rapidly growing tumors (37). However, the exact mechanism(s) that regulate(s) expression of this enzyme in RCCs is yet unclear.
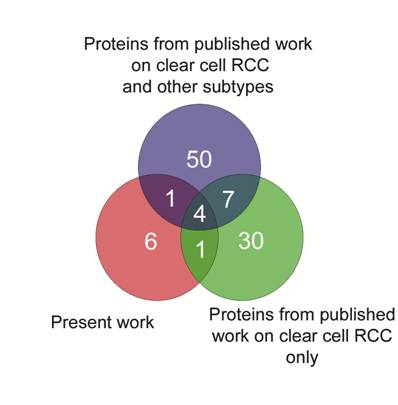
Finally, we generated a Venn diagram to identify commonly expressed proteins in RCC from the results published in the literature. Intersection of curated lists demonstrating upregulated proteins is shown in Fig. 4. Four proteins (Hsp27, TPI-1, Alpha-Enolase and SOD), including two which were validated in the present study, were found as common denominators in these lists, and taken together, these results add confidence for the role of Hsp27 and TPI-1 expression in clear cell renal cell carcinomas.
Venn diagram to intersect the lists of upregulated proteins generated in the present study and two others from published proteomic articles on RCC. Four proteins: Hsp27, TPI-1, Alpha-Enolase and SOD, two of them validated in the present study, were common to these three datasets.
Although our results confirm and expand previous findings, the main contribution of the present work is the inclusion in the proteomic analysis of RCCs with distinct histology. Compared to the studies published to date, our proteomic analysis has included an adequate sample size for generating putative biomarkers for each RCC histologic subtype, which have been validated in an independent cohort of kidney tumors. In both groups, statistical power for detecting differences amongst groups of samples support the assumption that these markers are indeed differentially expressed.
There are limitations on the generalized use of the surrogate markers identified in this study. First, the number of tumor lesions analyzed in the present work and in the literature so far is too small to establish valuable associations between clinicopathological parameters and a given protein profile. Second, we recognize that our proteomic analysis is not exhaustive, and is biased toward identification of high abundance soluble proteins. However, high-abundance proteins, which are altered in RCC are those which are most likely to have an impact on RCC-specific alteration of cellular phenotype. Future work needs to address the issues of examining underrepresented proteins, or the issue of differential post-translational modifications for a better understanding of their role in RCCs.
Acknowledgements
The authors want to thank Mary Ryan, NIH Library Biomedical Librarian/Informationist for her excellent editorial assistance.
The content of this publication does not necessarily reflect the views or policies of the Department of Health and Human Services, nor does mention of trade names, commercial products or organization imply endorsement by the United States Government.
Conflict of Interest
The authors have declared that no conflict of interest exists.
References
1. Jemal A, Siegel R, Ward E. et al. Cancer Statistics, 2008. CA Cancer J Clin. 2008;58:71-96
2. Reuter V, Tickoo SK. Adult Renal Tumors. In: (ed.) Sternberg SS, Mills SE, Carter D. Sternberg's diagnostic surgical pathology, 4th edn. Philadelphia: Lippincott Williams & Wilkins. 2004:2710-2775
3. Grignon DJ. Kidney Tumors in Adults. In: (ed.) Murphy WM, Grignon DJ, Perlman EJ. Tumors of the kidney, bladder, and related urinary structures; AFIP atlas of tumor pathology; Fourth series. Washington DC: American Registry of Pathology. 2004:394
4. Grignon D. Pathology of Kidney Tumors. In: (ed.) Mydlo JH. Renal cancer: methods and protocols. Totowa, N.J: Humana Press. 2001:35-51
5. Linehan WM, Vasselli J, Srinivasan R. et al. Genetic basis of cancer of the kidney: disease-specific approaches to therapy. Clin Cancer Res. 2004;10:6282S-6289S
6. Pavlovich CP, Schmidt LS, Phillips JL. The genetic basis of renal cell carcinoma. Urol Clin North Am. 2003;30:437-454
7. Langner C, Ratschek M, Rehak P, Schips L, Zigeuner R. CD10 is a diagnostic and prognostic marker in renal malignancies. Histopathology. 2004;45:460-467
8. Liao SY, Aurelio ON, Jan K, Zavada J, Stanbridge EJ. Identification of the MN/CA9 protein as a reliable diagnostic biomarker of clear cell carcinoma of the kidney. Cancer Res. 1997;57:2827-2831
9. Perroud B, Lee J, Valkova N. et al. Pathway analysis of kidney cancer using proteomics and metabolic profiling. Mol Cancer. 2006;5:64
10. Eble JN, Togashi K, Pisani P. Pathology and genetics of tumours of the urinary system and male genital organs. In: (ed.) Eble JN. World Health Organization classification of tumours 6th edn. Lyon: IARC Press, Oxford University Press. 2004:12-14
11. Greene FL, American Joint Committee on Cancer, American Cancer Society. AJCC cancer staging manual, 6th edn. New York: Springer. 2002
12. Walter BA, Valera VA, Takahashi S, Matsuno K, Ushiki T. Evidence of antibody production in the rat cervical lymph nodes after antigen administration into the cerebrospinal fluid. Arch Histol Cytol. 2006;69:37-47
13. Sarto C, Deon C, Doro G. et al. Contribution of proteomics to the molecular analysis of renal cell carcinoma with an emphasis on manganese superoxide dismutase. Proteomics. 2001;1:1288-1294
14. Sarto C, Valsecchi C, Magni F. et al. Expression of heat shock protein 27 in human renal cell carcinoma. Proteomics. 2004;4:2252-2260
15. Sarto C, Marocchi A, Sanchez JC. et al. Renal cell carcinoma and normal kidney protein expression. Electrophoresis. 1997;18:599-604
16. Balabanov S, Zimmermann U, Protzel C. et al. Tumour-related enzyme alterations in the clear cell type of human renal cell carcinoma identified by two-dimensional gel electrophoresis. Eur J Biochem. 2001;268:5977-5980
17. Lichtenfels R, Kellner R, Bukur J. et al. Heat shock protein expression and anti-heat shock protein reactivity in renal cell carcinoma. Proteomics. 2002;2:561-570
18. Arthur JM, Thongboonkerd V, Scherzer JA. et al. Differential expression of proteins in renal cortex and medulla: a proteomic approach. Kidney Int. 2002;62:1314-1321
19. Banks RE, Craven RA, Harnden P. et al. Key clinical issues in renal cancer: a challenge for proteomics. World J Urol. 2007;25:537-556
20. Seliger B, Lichtenfels R, Atkins D. et al. Identification of fatty acid binding proteins as markers associated with the initiation and/or progression of renal cell carcinoma. Proteomics. 2005;5:2631-2640
21. Zhuang Z, Huang S, Kowalak JA. et al. From tissue phenotype to proteotype: sensitive protein identification in microdissected tumor tissue. Int J Oncol. 2006;28:103-110
22. Unwin RD, Craven RA, Harnden P. et al. Proteomic changes in renal cancer and co-ordinate demonstration of both the glycolytic and mitochondrial aspects of the Warburg effect. Proteomics. 2003;3:1620-1632
23. Khan W, McGuirt JP, Sens MA, Sens DA, Todd JH. Expression of heat shock protein 27 in developing and adult human kidney. Toxicol Lett. 1996;84:69-79
24. Erkizan O, Kirkali G, Yorukoglu K, Kirkali Z. Significance of heat shock protein-27 expression in patients with renal cell carcinoma. Urology. 2004;64:474-478
25. Tremolada L, Magni F, Valsecchi C. et al. Characterization of heat shock protein 27 phosphorylation sites in renal cell carcinoma. Proteomics. 2005;5:788-795
26. Fanelli MA, Cuello Carrion FD, Dekker J, Schoemaker J, Ciocca DR. Serological detection of heat shock protein hsp27 in normal and breast cancer patients. Cancer Epidemiol Biomarkers Prev. 1998;7:791-795
27. Joo M, Chi JG, Lee H. Expressions of HSP70 and HSP27 in hepatocellular carcinoma. J Korean Med Sci. 2005;20:829-834
28. Langdon SP, Rabiasz GJ, Hirst GL. et al. Expression of the heat shock protein HSP27 in human ovarian cancer. Clin Cancer Res. 1995;1:1603-1609
29. Madersbacher S, Grobl M, Kramer G. et al. Regulation of heat shock protein 27 expression of prostatic cells in response to heat treatment. Prostate. 1998;37:174-181
30. Kamada M, So A, Muramaki M. et al. Hsp27 knockdown using nucleotide-based therapies inhibit tumor growth and enhance chemotherapy in human bladder cancer cells. Mol Cancer Ther. 2007;6:299-308
31. Sarto C, Binz PA, Mocarelli P. Heat shock proteins in human cancer. Electrophoresis. 2000;21:1218-1226
32. Manjili MH, Wang XY, Park J. et al. Immunotherapy of cancer using heat shock proteins. Front Biosci. 2002;7:d43-52
33. Lavoie JN, Lambert H, Hickey E, Weber LA, Landry J. Modulation of cellular thermoresistance and actin filament stability accompanies phosphorylation-induced changes in the oligomeric structure of heat shock protein 27. Mol Cell Biol. 1995;15:505-516
34. Keezer SM, Ivie SE, Krutzsch HC. et al. Angiogenesis inhibitors target the endothelial cell cytoskeleton through altered regulation of heat shock protein 27 and cofilin. Cancer Res. 2003;63:6405-6412
35. Isenberg JS, Jia Y, Field L. et al. Modulation of angiogenesis by dithiolethione-modified NSAIDs and valproic acid. Br J Pharmacol. 2007;151:63-72
36. Robert J, Van Rymenant M, Lagae F. Enzymes in cancer. III. Triosephosphate isomerase activity of human blood serum in normal individuals and in individuals with various pathological conditions. Cancer. 1961;14:1166-1174
37. Zhang D, Tai LK, Wong LL. et al. Proteomic Study Reveals That Proteins Involved in Metabolic and Detoxification Pathways Are Highly Expressed in HER-2/neu-positive Breast Cancer. Mol Cell Proteomics. 2005;4:1686-1696
Author contact
![]() Corresponding author: Maria J Merino, MD, Surgical Pathology Section, Laboratory of Pathology, NCI/NIH, Building 10, Room 2N212, 9000 Rockville Pike, Bethesda, MD 20892-1502 mjmerinonih.gov Telephone: 301.496.3326, Fax: 301-480-9488.
Corresponding author: Maria J Merino, MD, Surgical Pathology Section, Laboratory of Pathology, NCI/NIH, Building 10, Room 2N212, 9000 Rockville Pike, Bethesda, MD 20892-1502 mjmerinonih.gov Telephone: 301.496.3326, Fax: 301-480-9488.