Impact Factor ISSN: 1837-9664

 Global reach, higher impact
J Cancer 2012; 3:166-174. doi:10.7150/jca.4149 This volume Cite
Research Paper
Stemness of the CT-2A Immunocompetent Mouse Brain Tumor Model: Characterization In Vitro
Emanuela Binello, Zulekha A. Qadeer, Harini P. Kothari, Luni Emdad, Isabelle M. Germano ![]()
Department of Neurosurgery, Mount Sinai School of Medicine, New York, NY, 10029, USA
Received 2012-1-24; Accepted 2012-4-4; Published 2012-4-12
Abstract
Evidence has pointed to brain tumor stem cells (BTSC) as culprits behind human high-grade glioma (hHGG) resistance to standard therapy. Pre-clinical rodent models are the mainstay for testing of new therapeutic strategies. The typical model involves the intracranial injection of human glioma cells into immunocompromised hosts, hindering the evaluation of tumor-host responses and resulting in non-infiltrative tumors. The CT-2A model is an immunocompetent mouse model with potential to overcome these disadvantages. In this study, we confirmed the highly infiltrative nature of intracranial CT-2A tumors and optimized reproducible injection parameters. We then generated neurospheres and established, for the first time, the stemness of this model. CT-2A expression of the BTSC marker, CD133, increased from 2% in monolayer cells to 31% in fully-formed neurospheres. Investigation of three stem cell markers (Oct4, Nanog and Nestin) revealed a distinct stemness signature with monolayer cells expressing Oct4 and Nestin (no Nanog), and neurospheres expressing all three. Additionally, CT-2A cells were more proliferative and invasive than U87 cells, while CT-2A neurospheres were significantly more proliferative and invasive than either monolayer cells in vitro. Taken together, our results show that this model is a valuable tool for pre-clinical testing of novel therapeutics against hHGG and also affords the opportunity for investigation of BTSC in an immunocompetent setting.
Keywords: immunocompetent mouse model, glioma, stem cells
Introduction
Human high-grade gliomas (hHGG) continue to carry a grim prognosis for patients. Glioblastoma (GBM), the most malignant and, at the same time the most common, type of hHGG, is a highly invasive tumor with high recurrence rates despite treatment (1). Patients with GBM have a median survival of 14.6 months and an overall survival of only 10% at 5 years after gold-standard treatment with surgery, ionizing radiation, and temozolomide (2). Recent evidence has suggested that brain tumor stem cells (BTSC) may be the culprits behind hHGG resistance to standard treatment and high patient mortality (3).
Consistent with the general definition of cancer stem cells (CSC), BTSC demonstrate the capacity for self-renewal, multi-potency and tumorigenesis (4-8). BTSC have been associated with expression of the surface marker Cluster of Differentiation (CD)133 (7,8). The ability of CD133+ BTSC to generate tumors has been well documented in pre-clinical models (7,8). Clinical studies have shown that CD133 expression in histological samples correlates with patient survival and clinical course (9-11) though some contend that it is not a prognostically significant factor (12). Other stem cell (SC) markers, in addition to CD133, may also be clinically relevant in GBM. Octomer4 (Oct4) and Nanog are transcription factors traditionally known for maintaining embryonic stem cells in a pluripotent state, and have recently been associated with poorly differentiated GBM (13). Expression of Nestin, an intermediate filament protein expressed during embryogenesis in multi-lineage progenitor cells, correlates with tumor aggressiveness and patient survival (14,15). Combined detection of markers, such as CD133 and Nestin, may improve prognostic accuracy (15). Controversy exists as to the relative specificity of these markers, and a marker-independent method for BTSC has been proposed (16). However, there is general agreement that the more highly malignant hHGG exhibit a higher degree of stemness.
Pre-clinical testing of novel therapies is often performed on models that are generated from the intracranial or subcutaneous injection of cells, either from established hHGG lines or from excised hHGG, into immunocompromised mice (17). Concerns on the use of these model systems are the relatively low histopathologic similarity to clinical tumors (17) and the inability to study tumor-specific immune responses (18). Immunocompetent models, as a group, overcome the concern of tumor-specific immune responses, although in general, caution must be exercised in the translation of results from the pre-clinical to the clinical setting. While other animals may be used, mice are the mainstay of research based on a number of practical factors, such as cost, ease of handling, and the availability of advanced mouse-specific transgenic technologies (19,20). Therefore, immunocompetent mouse models are ideal in that they combine the benefits of providing an immunologically relevant environment with the advantages of working with mice (21-23). The first immunocompetent mouse model described in the literature was Gl261, developed from the intracranial implantation of 3-methylcholanthrene pellets into C57/BL6 mice (24). Although used frequently for investigations, concerns subsequently arose secondary to immunogenicity (25).
The CT-2A model derives from a malignant astrocytoma originally formed after the intracerebral implantation of 20-methylcholanthrene pellets into C57/BL6 mice (26). The tumor was maintained through serial intracranial transplants (27) and the CT-2A cell line was subseqently established. CT-2A tumors are p53 wild-type and recapitulate several features of hHGG, including high mitotic index and cell density, nuclear polymorphism, hemorrhage, pseudopalisading necrosis, and microvascular proliferation (21). CT-2A tumors are PTEN deficient (28), a characteristic present in up to 40% of hHGG (29) and 70% of established hHGG cell lines (30).
In the current study, we present the first characterization of the CT-2A model's stemness. We first document baseline tumor volumes achievable in the CT-2A intracranial model with standardized cellular stereotactic injection parameters, and then provide an analysis of several stem cells markers, including CD133, Oct4, Nanog and Nestin. We also demonstrate the functional significance of these characeristics via examination of the proliferative and invasiveness properties of the CT-2A cells in vitro.
Materials and Methods
Cells and culture conditions
The CT-2A cell line was generously donated by Dr. Thomas Seyfried (Boston College, Boston, MA). CT-2A cells were cultured in Dulbecco's Modified Eagle Medium (DMEM) with high glucose (Hyclone Laboratories, Logan, UT ), supplemented with 10% fetal bovine serum and 1% penicillin-streptomycin (Mediatech, Inc, Manassas, VA). Cells grew as an adherent monolayer and were maintained long-term according to standard sterile cell culture techniques. To generate neurospheres, CT-2A monolayer cells were enzymatically dissociated and plated in 25 cm2 culture dishes at a cell concentration of 1x10⁵ cells/ml in DMEM/F-12 medium (Hyclone Laboratories, Logan, UT) containing epidermal growth factor at 20 ng/ml (R&D Systems Inc, Minneapolis, MN), basic fibroblast growth factor at 20 ng/ml (R&D Systems, Inc, Minneapolis, MN) and B27 supplement 50x (Invitrogen, Carlsbad, CA ). Cells were incubated at 37oC in humidified air with 5% CO2. Neurospheres were collected at both 7 and 14 days for analysis.
Intracranial brain tumor model
Adult male C57/BL6 mice (Jackson Laboratory, Bar Harbor, ME) were housed in our fully accredited animal facility that conforms to NIH guidelines. Experiments were carried out in accordance with our Institutional Animal Care and Use Committee. Intracranial stereotactic tumor cell injections were performed according to previous methods (31). Briefly, after a midline scalp incision and identification of bregma, a burr hole was made posterior to bregma and to the right of midline. CT-2A cells in 5 μl of PBS were loaded into the Hamilton syringe attached to a power injector (Stoelting Co, Oak Dale, IL). Stereotactic injections were performed over 5 minutes to a depth of 3 mm. In one group, 5x10⁵ cells were injected per mouse (n=8) and mice sacrificed at 4 weeks. In another group, 1x10⁶ cells were injected per mouse (n=6) and mice sacrificed at 3 weeks. Brains were fixed in 4% paraformaldehyde at 4oC for 48 hours. After slicing 10-μm thick serial coronal sections, tissue was stained with haematoxylin and eosin and evaluated by light microscopy with an Olympus BX51 microscope (Olympus America Inc, Center Valley, PA). Images were captured with a Nikon Digital Site-DSL1 camera (Nikon Incorporated, Melville, NY). Tumor area was calculated by Image J (NIH, Bethesda, MD) and tumor volume was determined by multiplying the tumor area by intervening thickness, calculated by multiplying section thickness by the number of sections.
Immunofluorescence analysis
Tissue sections were air dried, treated with antigen retrieval at 100oC for 5 minutes, blocked for 1 hour with 10% goat serum and incubated overnight with primary anti-CD133 antibody (1:100, Abcam, Cambridge, MA) or its isotype control rabbit IgG (1:100 Sigma, St. Louis, MO). Sections were then incubated for 1 hour with secondary anti-rabbit antibody conjugated to Cy3 (1:100, Invitrogen, Carlsbad, CA) and mounted using 4'6-diamidino-2-phenylindole (DAPI)-containing medium (Vector Labs, Burlingame, CA). Cells and neurospheres were seeded onto poly-D-lysin/laminincoated slides (BD Biosciences, Bedford, MA) overnight at 37oC and fixed with 4% paraformaldehyde. For intracellular marker detection, permeabilization was performed using 0.1% Triton X. Cells were blocked with 10% serum for 1 hour and incubated overnight at 4oC with the following primary antibodies and concentrations: CD133 1:500 (Abcam, Cambridge, MA), Oct4 (1:100 Biovision, Mountain View, CA), Nanog (1:200, R&D Systems Inc, Minneapolis, MN) and Nestin (1:200 Millipore, Billerica, MA). Cells were incubated for 1 hour with the secondary antibodies (Invitrogen, Carlsbad, CA) at the same concentration as follows: anti-rabbit-Cy3 (for CD133), anti-rabbit-Alexa488 (for Oct4), anti-goat-FITC (for Nanog), and anti-mouse-FITC (for Nestin). Cell nuclei were counterstained with DAPI (Sigma-Aldrich, St. Louis, MO). Slides were observed and imaged under fluorescence microscopy with a Leica DMI 4000B microscope and DFC340FX camera (Leica Microsystems, Bannockburn, IL).
Flow cytometric analysis
CT-2A monolayer cells, as well as 1 week and 2 week neurospheres were washed in cold PBS. Anti-CD133 antibody (1:300, Abcam, Cambridge, MA ) was added for 30 minutes at 4oC. Unstained cells and cells stained with Rabbit IgG (Invitrogen, Carlsbad, CA) were used as controls. Samples were then incubated with secondary anti-rabbit-Alexa488 antibody (1:300 Invitrogen, Carlsbad, CA) for 30 minutes at 4oC. After washing with cold PBS, samples were immediately analyzed using FACScan cytometer (Beckton Dickinson, San Jose, CA) with CellQuest software (Beckton Dickinson, San Jose, CA).
Reverse Transcriptase-Polymerase Chain Reaction (RT-PCR)
Cells were lysed with RNeasy lysis buffer and β-mercaptoethanol and total RNA was extracted with RNeasy kit (Qiagen, Valencia, CA) following the manufacturer's instructions. All RNA preparations were quantified with spectrophotometry prior to RT and 1 μg of total RNA was used to generate complementary DNA (cDNA) using the First-Strand Superscript II RT kit (Invitrogen, Carlsbad, CA). The cDNA was amplified in a total reaction volume of 50 μl. All PCR amplifications were for 30 cycles. Amplified materials were examined on 1.8% agarose gels and photographed using an Eagle Eye II imager (Stratagene., La Jolla, CA). The following primers (Allele Biotech, San Diego, CA) were used: Oct4 (123bp, forward 5'->3':AACCTGGAGTTTGTGCCAGGGTTT, reverse 5'->3' TGAACTTCACCTTCCCTCCAACCA), Nanog (361 bp, forward 5'->3': AGGGTCTGCTACTGAGATGCTCTG, reverse 5'->3'CAACCACTGGTTTTTCTGCCACCG) Nestin (445 bp, forward 5'->3': TTCCCCCTTGCCTAATACCCT, reverse 5'->3' TACCTCTGTGGCTGCTTCTTT), and GAPDH (470 bp, forward 5'->3': TGAAGGTCGGTGTGAACGGA, reverse 5'->3' CAGGGGGGCTAAGCAGTTGGT).
Proliferation assay in vitro
Cells and neurospheres (1x10⁵ cells) were seeded on poly-d-lysine coated glass coverslips overnight. After pulsing with Bromodeoxyuridine (BrdU) at a final concentration of 10 μM for 2 hours, cells and neurospheres were fixed with 4% PFA, permeabilized using 0.1% Triton in PBS and denatured with 2N HCl. They were washed with 0.1M Na2B4O7 (pH 8.5) and incubated overnight at 4oC with primary anti-BrdU monoclonal antibody (1:500, Sigma, St. Louis, MO). Cells and neurospheres were then incubated for 1 hour at room temperature with secondary goat anti-mouse Alex 488 (1:500, Invitrogen, Carlsbad, CA) and counterstained with DAPI. Slides were imaged using a Leica DMI 4000B microscope and DFC340FX camera (Leica Microsystems, Bannockburn, IL). BrdU/DAPI double positive cells in four randomly chosen fields were counted using ImageJ (NIH, Bethesda, MD).
Invasion assay in vitro
Matrigel-coated 24-well invasion chambers were used according to the manufacturer's specifications (BD Biosciences, Bedford, MA). Briefly, U87 and CT-2A cells, as well as CT-2A neurospheres were plated in the upper transwell chambers of coated inserts at a concentration of 1x10⁴ cells/500 μl in serum- and growth factor-free media. The bottom wells of the chambers were filled with 500 μl of medium containing 7% FBS chemoattractant. After 24 hours at 37oC, inserts were fixed in methanol and stained using the Hema 3 stain set (Fisher Diagnostiscs, Middletown, VA) according to manufacturer's instructions. Inserts were visualized with a Zeiss Axiovert 25 microscope (Carl Zeiss Inc, New York, NY) and twenty randomly chosen images acquired with Qicam (Qimaging, Surrey, BC, Canada). Cells were counted using Image J software (NIH, Bethesda, MD).
Statistical Analysis
When applicable, results are displayed as the mean ± standard deviation of 3 experiments performed in duplicate. Statistical significance was calculated using the Student's t-test with p ≤ 0.05.
Results
Evaluation of experimental tumors
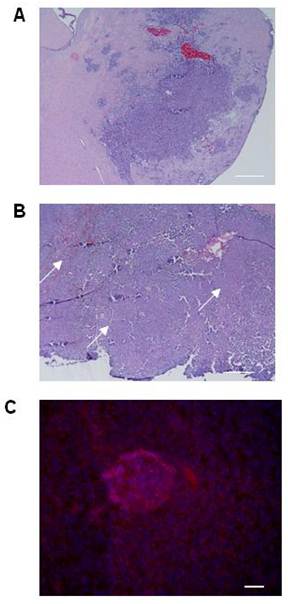
Although the histologic characteristics of the CT-2A model are well reported, tumor volumes are not. We first established baseline tumor volumes achievable with standardized cellular stereotactic injection parameters that could be reliably reproduced. A tumorigenesis rate of 100% and tumors with an acceptable standard deviation were obtained by injecting 5x10⁵ cells and evaluating tumor volume at 3 weeks (Table 1). Histologic analysis of the tumors confirmed their hemorrhagic and infiltrative pattern into both the adjacent brain parenchyma and more distant sites, resulting in satellite lesions (Figure 1A), thereby recapitulating key features of hHGG. The infiltrative nature of the CT-2A tumors, together with evidence supporting CD133 as BTSC marker (3) and implicating BTSC in infiltration (32), led us to explore CD133 expression in CT-2A intracranial tumors. To maximize detection based on the known association with hypoxia (33), we chose a specimen with a large tumor bulk and areas of necrosis (Figure 1B). Immunofluorescent staining demonstrated areas of CD133 expression scattered within necrotic regions of the tumor (Figure 1C), consistent with the presence of BTSC.
Injection parameters and results for the CT-2A intracranial mouse model.
| Intracranial CT-2A injection | 5x10⁵ cells/ 5 ml PBS (n=8) | 1x10⁶ cells / 5 ml PBS (n=6) |
|---|---|---|
| Tumor Volume | 229 ± 358 mm3 | 137 ± 64 mm3 |
| Volume Range | 4 to 998 | 75 to 256 |
| Tumorigenesis | 87.5 % | 100% |
| Time | 4 weeks | 3 weeks |
Histological features of the CT-2A orthotopic immunocompetent hHGG model. A and B) Light microscopy photomicrographs of coronal brain sections with CT2A tumors. Tumors were hemorrhagic and demonstrated infiltration into brain parenchyma, including satellite lesions (A). Tumors with large bulk had necrotic areas throughout (arrows in B). Magnification, 4x. Scale bar, 500 μM. C) Immunofluorescence photomicrograph showing CD133 expression (Cy3 stain) in a necrotic area within the tumor. Magnification, 20x. Scale bar, 200 μM
Cell and neurosphere expression of CD133
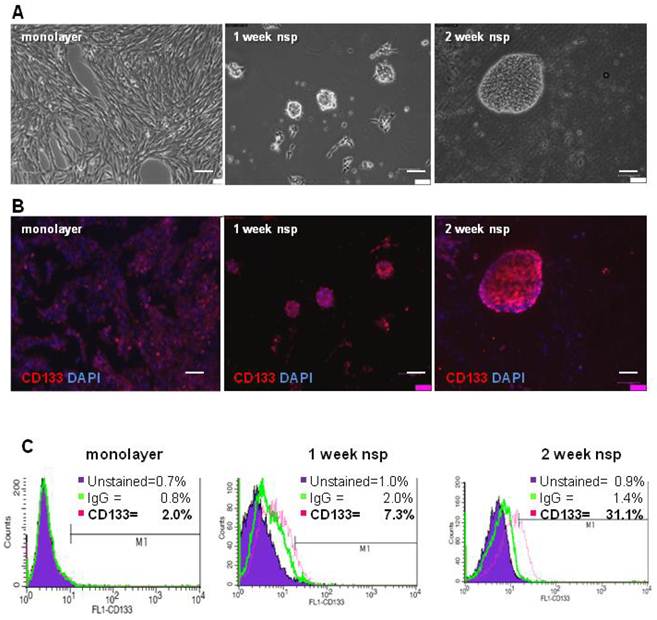
To characterize the stemness of this model, we first generated CT-2A neurospheres and then characterized their expression of CD133, a classical BTSC marker (3). Although neurospheres began forming as early as 4 days when cultured in serum-free and growth-factor enriched medium, 2 weeks were necessary for the majority of neurospheres to be fully formed and free floating (Figure 2A). Immunofluorescence staining demonstrated increasing CD133 staining as cells progressed from monolayer to 1 and 2 week neurospheres (Figure 2B). Quantification of CD133 staining via flow cytometry revealed increased CD133 expression, from 2% in monolayer cells to 7.3% in 1 week neurospheres and to 31.1% in the 2 week neurospheres (Figure 2C). Unstained control samples were set to ≤ 1% and isotype control staining remained ≤ 2% across all samples.
CT-2A cells and neurospheres express CD133. A) Phase contrast images showing the transition from CT-2A adherent monolayer cells into fully floating neurospheres over the course of 2 weeks. B) Immunofluorescence analysis demonstrating increasing CD133 staining as cells progressed from a monolayer to 2 week neurospheres (nsp). A and B: magnification, 10x; scale bar, 100 μm. C) CD133 expression quantified by flow cytometry shows 2.0%, 7.0% and 31.1% in the monolayer, 1 week and 2 week neurospheres, respectively. Unstained control samples were ≤ 1% and isotype control staining was ≤ 2.0%.
Cell and neurosphere expression of other stem-cell markers: Oct4, Nanog, Nestin
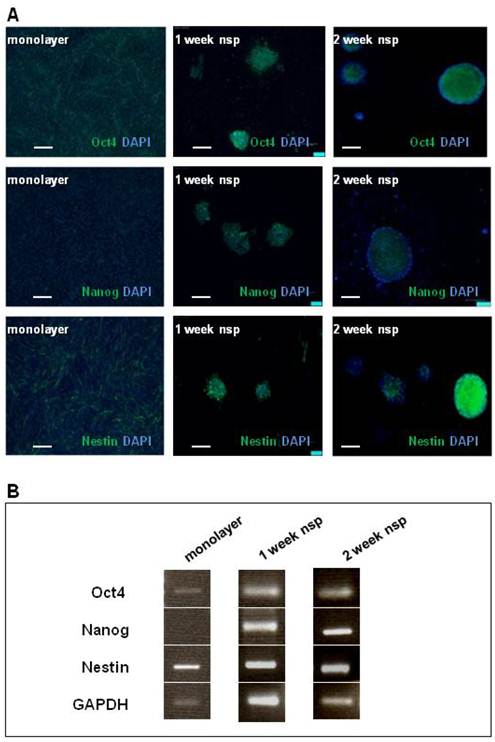
The presence of CD133 staining in CT-2A tumors, as well as cells and neurospheres, motivated further investigation into the model's stemness. We chose Oct4, Nanog and Nestin as markers to complete our stemness signature not only based on the clinical documentation of these markers (13-15) but also on basic studies linking their expression to BTSC function (34-36). As shown via immunofluorescence staining (Figure 3A), Oct4 and Nestin were both present in both monolayer cells and neurospheres, while Nanog was only present in the neurospheres. These results were also confirmed by RT-PCR (Figure 3B).
CT-2A cells and neurospheres also express the SC markers: Oct4, Nanog and Nestin. A) Immunofluorescence analysis of SC marker expression (Oct4, Nanog and Nestin) in monolayer (left panel), 1week neurospheres (middle panel) and 2week neurospheres (right panel). Oct 4 was present in monolayer cells, and both 1week and 2week neurospheres. Nanog absent in the monolayer, but present in both 1 and 2week monospheres. Nestin staining was present in monolayer, 1week and 2week neurospheres. A and B: magnification, 10x; scale bar, 100 μm. B) RT-PCR corroborated the above findings in the robust expression of all 3 SC markers at 2 weeks.
Proliferative and invasive properties in vitro
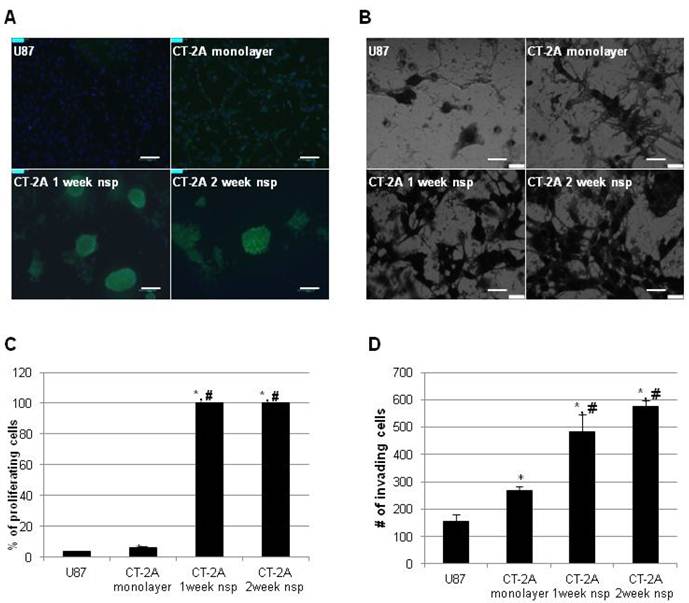
We then turned our attention to more functional aspects of our model and examined proliferation and invasion in vitro. These have long been recognized as significant obstacles in the development of effective therapeutic strategies for hHGG. In addition to the well-established proliferative capacity of BTSC, recent evidence has also implicated BTSC in mechanisms of invasion (32). To place our results in a broader context, we directly compared results to the more commonly used U87 cell line. CT-2A cells exhibited a significantly higher proliferation rate compared to U87 cells (6.5±0.5% vs 3.6±0.4%, p<0.05), while CT-2A neurospheres had maximal (100%) proliferation rate (Figure 4A). Similar results were obtained via invasion assay (Figure 4B). CT-2A cells were significantly more invasive than U87 cells (268±14 vs 156±25 cells/hpf, p<0.05), while CT-2A neurospheres were significantly more invasive than both U87 and CT-2A cells (p<0.05), with a trend towards increased invasion with 2 week neurospheres compared to 1 week neurospheres.
CT-2A neurospheres are highly proliferative and invasive in vitro. A) Immunofluorescence photomicrographs after BrDU incorporation (green) showing stronger incorporation consistent with increased proliferation in CT2A neurospheres compared to CT2A and U87 monolayer cells (Alexa488 green, DAPI blue). B) Phase contrast photomicrographs of an in vitro invasion assay showing that CT-2A neurospheres were more invasive than CT-2A and U87 monolayer cells (Hema3 stain). A: magnification, 10x; scale bar 100 μm. B: magnification, 40x; scale 400 μm. C and D) Bar graphs quantifying the above results confirm a statistically significant increase in both proliferation (C) and invasion (D) in the CT-2A neurospheres compared to the CT-2A and U87 monolayer cells. Data reported as mean ± SD (#p<0.05 compared to U87, * p<0.05 compared to CT-2A, per Student's t-Test).
Discussion
Reproducible injection parameters and reasonable tumor volume standard deviations are practical considerations that render models useful in the evaluation of experimental therapeutics. For this reason, we chose to begin our evaluation of the CT-2A model by establishing baseline tumor volumes using injections of cells rather than minced tissue since cells represent a system that is easier to standardize and less fraught with measurement error. In addition, we also confirmed the infiltrative nature of intracranial CT-2A tumors. Previous reports on the histological appearance on the CT-2A orthotopic model have some variation, with some authors reporting a tumor with subsets of cells infiltrating into surounding brain parenchyma (21) and others a more compact tumor with minimal local invasion (23). Discrepancy could be due, in part, to differences in injection parameters; we and others (21) injected cell suspensions, while others implanted minced tissue (23).
Although there is controversy surrounding the specificity of CD133 as a BTSC marker (3), it nontheless represents one of the most widely used BTSC markers and enables a direct comparison with other glioma cell lines. We quantified the CD133 expression in the CT-2A model for the first time and found positivity not only in the CT-2A intracranial tumors but also in both cells and neurospheres, which we generated for the first time. CT-2A monolayer cells had a CD133 expression of 2%, which is significantly higher than the 0.5% to 0.9% reported in the literature for the U87 cell line (37,38), one of the most comonly used immunocompromised mouse models.
In characterizing the stemness of the CT-2A model, we have also documented the expression of Oct4, Nanog and Nestin. While CT-2A monolayer cells expressed Oct4 and Nestin (no Nanog), neurospheres expressed all three markers (Oct4, Nanog and Nestin). The upregulation of Nanog in neurospheres has been described in context of U87 neurospheres (39) and is consistent with data describing a correlation between increased CD133 and Nanog (35). It could therefore represent a physiologic change as a result of neurosphere development. Several studies have linked Oct4, Nanog and Nestin to BTSC development and function (35-37) with implications for the identification of novel therapeutic signaling targets such as STAT3 (35), which has gained recent attention as a likely therapeutic target for BTSC (40). The relevance of stemness signature characterization has found recent support in a study using computational methods to identify clinically useful compounds that could target cancers with high stemness signatures (41). Therefore, knowledge of the CT-2A stemness signature may be used to provide insight into BTSC responses to novel therapies.
Previous data has demonstrated that BTSC have elevated invasive potential to non-BTSC (33). Therefore, it is not surprising that CT-2A neurospheres have significantly higher proliferative and invasive properties in vitro compared to the monolayer cells. The increase in proliferation and invasion of CT-2A neurospheres compared to monolayer cells coincided with the expression of all three SC markers (Oct4, Nanog and Nestin) in neurospheres compared to two SC markers (Oct4 and Nestin) in monolayer cells. These results also highlight the relevance of examining a stemness signature rather than focusing on one SC marker alone.
Taken together, our results show that the CT-2A pre-clinical mouse model not only recapitulates the histological features of hHGG but is also amenable to pre-clinical testing of novel therapies in the immunocompetent host. CT-2A cells and neurospheres have distinct stemness features and are highly proliferative and invasive. These characteristics offer the potential for investigating BTSC in an immunocompetent environment that may be of value given their emerging role in the resistance of hHGG to standard therapies.
Acknowledgements
This work was supported in part by a grant from the National Institutes of Health/National Cancer Institute (RO1 CA129489-01A1) to I. M. G.
Competing Interests
The authors have declared that no competing interest exists.
References
1. Central Brain Tumor Registry of the United States. CBTRUS Statistical Report: Primary Brain and Central Nervous System Tumors diagnosed in the United States 2004-2006. Hinsdale, IL: Central Brain Tumor Registry of the United States. 2010
2. Stupp R, Hegi ME, Mason WP. et al. Effects of radiotherapy with concomitant and adjuvant temozolomide versus radiotherapy alone on survival in glioblastoma in a randomised phase III study: 5-year analysis of the EORTC-NCIC trial. Lancet Oncol. 2009;10(9):459-466
3. Germano IM, Swiss V, Casaccia P. Primary brain tumors, neural stem cells, and brain tumor cancer cells: Where is the link? Neuropharmacol. 2010;58(6):903-910
4. Ignatova TN, Kukekov VG, Laywell ED, Suslov ON, Vrionis FD, Steindler DA. Human cortical glial tumors contain neural stem-like cells expressing astroglial and neuronal markers in vitro. Glia. 2002;39(3):193-206
5. Galli R, Binda E, Orfanelli U. et al. Isolation and characterization of tumorigenic, stem-like neural precursors from human glioblastoma. Cancer Res. 2004;64(19):7011-7021
6. Singh SK, Clarke ID, Terasaki M. et al. Identification of a cancer stem cell in human brain tumors. Cancer Res. 2003;63(18):5821-5828
7. Yuan X, Curtin J, Xiong Y. et al. Isolation of cancer stem cells from adult glioblastoma multiforme. Oncogene. 2004;23:9392-9400
8. Singh SK, Hawkins C, Clarke ID. et al. Identification of human brain tumour initiating cells. Nature. 2004;43:396-401
9. Zeppernick F, Ahmadi R, Campos B. et al. Stem cell marker CD133 affects clinical outcome in glioma patients. Clin Cancer Res. 2008;14(1):123-129
10. Beier D, Wischhusen J, Dietmaier W. et al. CD133 expression and cancer stem cells predict prognosis in high-grade oligodendroglial tumors. Brain Pathol. 2008;18(3):370-377
11. Pallini R, Ricci-Vitiani L, Banna GL. et al. Cancer stem cell analysis and clinical outcome in patients with glioblastoma multiforme. Clin Cancer Res. 2008;14(24):8205-8212
12. Kim KJ, Lee KH, Kim HS. et al. The presence of stem cell marker-expressing cells is not prognostically signficant in glioblastomas. Neuropathol. 2011;31(5):494-502
13. Ben-Porath I, Thomson MW, Carey VJ. An embryonic stem cell-like gene expression signature in poorly differentiated aggressive human tumors. Nat Gen. 2008;40(5):499-57
14. Strojnik T, Rosland GV, Sakariassen PO, Kavalar R, Lah T. Neural stem cell markers, nestin and musashi proteins, in the progress of human glioma: correlation of nestin with prognosis of parient survival. Surg Neurol. 2007;68(2):133-144
15. Zhang M, Song T, Yang L. et al. Nestin and CD133: valuable stem cell-specific markers for determining clinical outcome of glioma patients. J Exp Clin Cancer Res. 2008;27:85
16. Clement V, Marino D, Cudalbu C. et al. Marker-independent identification of glioma-initiating cells. Nature Meth. 2010;7(3):224-229
17. De Vries NA, Beijnen JH, van Tellingen O. High-grade glioma mouse models and their applicability for pre-clinical testing. Cancer Treat Rev. 2009;35(8):714-723
18. Waziri A. Glioblastoma-derived mechanisms of systemic immunosuppression. Neurosurg Clin N Am. 2010;21(1):31-42
19. Fomchenko EI, Holland EC. Mouse models of brain tumors and their applications in preclinical trials. Clin Cancer Res. 2006;12(18):5288-5297
20. Huse JT, Holland EC. Genetically engineered mouse models of brain cancer and the promise of preclinical testing. Brain Pathol. 2009;19(1):132-143
21. Martinez-Murillo R, Martinez A. Standardization of an orthotopic mouse brain tumor model following transplantation of CT-2A astrocytoma cells. Histol Histopathol. 2007;22(12):1309-1326
22. Candolfi M, Curtin JF, Nicholes WS. et al. Intracranial glioblastoma models in preclinical neuro-oncology: neuropathological characterization and tumor progression. J Neurooncol. 2007;85(2):133-148
23. Shelton LM, Mukherjee P, Husentruyt LC, Rosenberg JA, Seyfried TN. A novel pre-clinical in vivo mouse model for malignant brain tumor growth and invasion. J Neurooncol. 2010;99(2):165-176
24. Szatmari T, Lumniczky K, Desaknai S. et al. Detailed characterization of the mouse glioma 261 tumor model for experimental glioblastoma therapy. Cancer Sci. 2006;97(6):546-553
25. Seligman AM, Shear MJ. Studies in carcinogenesis. VIII. Experimental production of brain tumors in mice with methylcholanthrene. Am J Cancer. 1939;37:367-395
26. Zimmerman HM, Arnold H. Experimental brain tumors: 1. Tumor produced with methylcholanthrene. Cancer Res. 1941;1(12):919-938
27. Seyfried TN, Yu RK, Saito M, Albert M. Ganglioside composition of an experimental mouse brain tumor. Cancer Res. 1987;47(13):3538-3542
28. Marsh J, Mukherjee P, Seyfried TN. Akt-dependent proapoptotic effects of dietary restriction on late-stage management of a phosphatase and tensin homolog/tuberous sclerosis complex 2-deficient mouse astrocytoma. Clin Cancer Res. 2008;14(23):7751-7762
29. Knobbe CB, Merlo A, Reifenberger G. PTEN signaling in gliomas. Neuro-Oncol. 2002;4(3):196-211
30. Ishii N, Maier D, Merlo A. et al. Frequent co-alterations of TP53, p16/CDKN2A, p14ARF, PTEN tumor suppressor genes in human glioma cell lines. Brain Pathol. 1999;9(3):469-479
31. Benveniste RJ, Keller G, Germano IM. Embryonic stem cell-derived astrocytes expressing drug-inducible transgenes: differentiation and transplantation into the mouse brain. J Neurosurg. 2005;103(1):115-123
32. Cheng L, Wu Q, Guryanova OA. et al. Elevated invasive potential of glioblastoma stem cells. Biochem Biophys Res Comm. 2011;406(4):643-648
33. Heddleston JM, Li Z, McLendon RE, Hjelmeland AB, Rich JN. The hypoxic microenvironment maintains glioblastoma stem cells and promotes reprogramming towards a cancer stem cell phenotype. Cell Cycle. 2009;8(20):3274-3284
34. Du Z, Jia D, Liu S. et al. Oct4 is expressed in human gliomas and promotes colony formation in glioma cells. Glia. 2009;57(7):724-733
35. Zbinden M, Duquet A, Lorente-Trigos A, Ngwabyt S-N, Borges I, Ruiz i Altaba A. Nanog regulates glioma stem cells and is essential in vivo acting in cross-functional network with GLI1 and p53. EMBO J. 2010;29(15):2659-2674
36. Prestegarden L, Svendsen A, Wang J. et al. Glioma cell populations grouped by different cell type markers drive brain tumor growth. Cancer Res. 2010;70(11):4274-4279
37. Yao XH, Ping YF, Chen JH. et al. Glioblastoma stem cells produce vascular endothelial growth factor by activation of a G-protein coupled formylpeptide receptor FPR. J Pathol. 2008;215(4):369-376
38. Qiang L, Yang Y, Ma Y-J. et al. Isolation and characterization of cancer stem like cells in human glioblastoma cell lines. Cancer Lett. 2009;279(1):13-21
39. Niu CS, Li DX, Liu YH, Fu XM, Tang SF, Li J. Expression of NANOG in human gliomas and its relationship with undifferentiated glioma cells. Oncol Rep. 2011;26(3):593-601
40. Wei J, Barr J, Kong L-Y. et al. Glioblastoma cancer-initiating cells inhibit T-cell proliferation and effector responses by the signal transducers and activators of transcription 3 pathway. Mol Cancer Ther. 2010;9(1):67-78
41. Shats I, Gatza ML, Chang JT. et al. Using a stem cell-based signature to guide therapeutic selection in cancer. Cancer Res. 2011;71(5):1772-1780
Author contact
![]() Corresponding author: Isabelle M. Germano, MD, FACS. Professor of Neurosurgery, Neurology, Oncological Sciences; Department of Neurosurgery; Mount Sinai School of Medicine; 1 Gustave L. Levy Place, Box #1136; New York, NY 10029. Phone: 212-241-9638. Fax: 212-831-3324. Email: isabelle.germanoorg
Corresponding author: Isabelle M. Germano, MD, FACS. Professor of Neurosurgery, Neurology, Oncological Sciences; Department of Neurosurgery; Mount Sinai School of Medicine; 1 Gustave L. Levy Place, Box #1136; New York, NY 10029. Phone: 212-241-9638. Fax: 212-831-3324. Email: isabelle.germanoorg