Impact Factor ISSN: 1837-9664

 Global reach, higher impact
J Cancer 2012; 3:175-183. doi:10.7150/jca.4120 This volume Cite
Research Paper
ASPN and GJB2 Are Implicated in the Mechanisms of Invasion of Ductal Breast Carcinomas
Bàrbara Castellana1*, Daniel Escuin1, Gloria Peiró4, Bárbara Garcia-Valdecasas1,5, Tania Vázquez1, Cristina Pons2, Maitane Pérez-Olabarria1, Agustí Barnadas1, 3,5, Enrique Lerma1,2,5 ![]()
1. Institut de Recerca, Hospital de la Santa Creu i Sant Pau, Barcelona, Spain
2. Department of Pathology. Hospital de la Santa Creu i Sant Pau,
3. Department of Oncology. Hospital de la Santa Creu i Sant Pau,
4. Research Unit. Hospital General Universitario de Alicante
5. Universitat Autònoma de Barcelona, Barcelona, Spain.
* Current address: Department of Molecular Pathology, Vall d'Hebron Research Institute, Barcelona
Received 2012-1-19; Accepted 2012-4-4; Published 2012-4-16
Abstract
The mechanism of progression from ductal carcinoma in situ (DCIS) to invasive ductal carcinoma (IDC) remains largely unknown. We compared gene expression in tumors with simultaneous DCIS and IDC to decipher how diverse proteins participate in the local invasive process.
Twenty frozen tumor specimens with concurrent, but separated, DCIS and IDC were microdissected and evaluated. Total RNA was extracted and microarray analysis was performed using Affymetrix GeneChip® Human Gene 1.0 ST Arrays. Microarray data were validated by quantitative real time reverse transcription-PCR (qRT-PCR) and immunohistochemistry. Controls included seven pure in situ carcinomas, eight fragments from normal breast tissue, and a series of mouse breast carcinomas (MMTV-PyMT).
Fifty-six genes were differentially expressed between DCIS and IDC samples. The genes upregulated in IDC samples, and probably associated with invasion, were related to the epithelial-mesenchymal transition (ASPN, THBS2, FN1, SPARC, and COL11A1), cellular adhesion (GJB2), cell motility and progression (PLAUR, PLAU, BGN, ADAMTS16, and ENPP2), extracellular matrix degradation (MMP11, MMP13, and MMP14), and growth/proliferation (ST6GAL2). qRT-PCR confirmed the expression patterns of ASPN, GJB2, ENPP2, ST6GAL2, and TMBS10. Expression of the ASPN and GJB2 gene products was detected by immunohistochemistry in invasive carcinoma foci. The association of GJB2 protein expression with invasion was confirmed by qRT-PCR in mouse tumors (P < 0.05).
Conclusions: The upregulation of ASPN and GJB2 may play important roles in local invasion of breast ductal carcinomas.
Keywords: breast cancer, in situ ductal carcinoma, invasive ductal carcinoma, epithelial-mesenchymal transition, ASPN, GJB2.
INTRODUCTION
Invasive ductal carcinoma (IDC) of the breast is a heterogeneous disease with a variety of histological subtypes. Tumor cell invasion is a complex process and the mechanisms controlling the transition from ductal carcinomas in situ (DCIS) to IDC still remain unclear, despite research in recent years. Initial pathological studies suggest that IDC is preceded by DCIS, “atypical ductal hyperplasia”, and “usual ductal hyperplasia” (1). The current hypothesis is that genetic changes modulating invasiveness are present in cells even before they acquire DCIS morphology (2-4). Furthermore, not all in situ lesions become invasive, some IDCs are not associated with DCIS and, thus, the mechanisms of invasion in breast carcinomas remain unclear.
Gene expression profiling using microarray technology has allowed for major advances in the classification of breast cancers. Although DCIS accounts for 15-40% of all diagnosed breast cancers (5), transcriptome studies of DCIS have proven difficult. Only a few studies with small sample numbers have compared the gene expression patterns of DCIS with those of IDC (2, 3, 6-10). Furthermore, only a few of the studies included breast carcinomas in which simultaneous DCIS and IDC components were separated and compared (2, 3, 7, 8). Although few coincidences of specific genes occurred in these studies, it is suggested that upregulation of IDC genes is associated with epithelial-mesenchymal transition (EMT), cell motility, extracellular matrix degradation, and growth/proliferation. Since these studies are incomplete, further work in this area is needed to understand the molecular mechanisms of cell invasion in this form of neoplasia.
In the current study, we identified genes that were differentially expressed in IDC and DCIS by analyzing tumors containing simultaneously separated foci with both components. Our results demonstrate that the ASPN and GJB2 genes would have an important role in the mechanism of progression from DCIS to local invasion in breast carcinomas.
MATERIALS AND METHODS
Patients and tumor samples
This study was conducted according to the Declaration of Helsinki principles with approval by the ethics committee of the Institut de Recerca, Hospital de la Santa Creu i Sant Pau, Autonomous University, Barcelona, Spain. Twenty human breast carcinomas containing DCIS and IDC lesions (matched samples) were collected prospectively at the Department of Pathology at Hospital de la Santa Creu i Sant Pau between 2006 and 2010. In addition, seven pure DCIS samples and eight normal breast tissue samples were retrospectively selected as controls. Immediately after surgery, a portion of each tumor was rapidly embedded in OCT (Tissue-Tek, Sakura, Europe, Alphen aan den Rijn, The Netherlands) and frozen using a histobath (Thermo Shandon, Pittsburgh, PA, USA). The remaining tumor tissues were fixed in buffered 10% formalin and fixed in paraffin. H&E staining was used for pathological diagnosis of sections and tumor classification and grading was performed using standard methods. Clinical-pathological data are summarized in Table 1.
Main clinicopathological characteristics of patients and tumors.
| Age | ≥55 | 11 (55%) |
| <55 | 9 (45%) | |
| Tumor size (cm) | <2 | 4 (20%) |
| 2-5 | 14 (70%) | |
| >5 | 2 (10%) | |
| Lymph node metastasis | Positive | 8 (40%) |
| Negative | 12 (60%) | |
| Histological grade | I | 3 (15%) |
| II | 8 (40%) | |
| III | 9 (45%) | |
| Mitosis (sq mm/10) | <7 | 9 (45%) |
| 7-13 | 5 (25%) | |
| >13 | 6 (30%) | |
| Nuclear atypia | 1 | 1 (5%) |
| 2 | 5 (25%) | |
| 3 | 14 (70%) | |
| Tumor necrosis | Positive | 8 (40%) |
| Negative | 12(60%) | |
| Lymphatic invasion | Positive | 5 (25%) |
| Negative | 15 (75%) | |
| DCIS | >10% | 15 (75%) |
| <10% | 5 (25%) | |
| Estrogen receptors | Positive | 17 (85%) |
| Negative | 3 (15%) | |
| Progesterone receptors | Positive | 9 (45%) |
| Negative | 11 (55%) | |
| Her-2/neu | Positive | 13 (65%) |
| Negative | 7 (35%) | |
| Immunohistochemical subtype | HR+/Her 2 -* | 10 (50%) |
| HR+/Her2+ | 7 (35%) | |
| HR-/Her2+ | 2 (10%) | |
| HR-/Her2- | 1 (5%) |
* HR= Hormone receptors (either estrogen and or progesterone receptors); Her= HER2/neu; +=positive;-=negative
RNA isolation
Dissection of independent DCIS and IDC foci was done after examination of an H&E stained section of the OCT-embedded frozen tumor. Although DCIS and IDC were independently isolated, associated stroma would be mixed with each tumor component. This limitation was lately overcome by the immunohistochemical detection and visualization of the candidate-gene products.
Total RNA was isolated from selected areas of frozen tissue using TRIzol Reagent (Invitrogen, Carlsbad, CA, USA) and purified using an RNeasy Mini Kit (QIAGEN, Hilden, Germany) according to manufacturers' instructions. RNA was resuspended in 14 µl RNase-free H2O and stored at -80°C. RNA concentrations and quality were determined using a NanoDrop apparatus (Thermo Fisher Scientific, Wilmington, DE, USA) and RNA integrity numbers (RIN) were analyzed using a RNA 6000 Nano LabChip Kit (Agilent Technologies, Boeblingen, Germany) with a Agilent 2100 Bioanalyzer according to the manufacturer's instructions.
Microarray analysis
Microarray analysis was performed using Affymetrix GeneChip® Human Gene 1.0 ST Arrays (Affymetrix, Santa Clara, CA, USA) that consists of approximately 764,885 probe sets with a resolution number of 26 probes per gene, covering over 28,869 genes. The entire process was performed following the Affymetrix instructions. Briefly, double-stranded cDNA was synthesized by a chimerical oligonucleotide with oligo-dT and T7 RNA polymerase. The amplification and labeling processes were monitored using a GeneChip® Eukaryotic Poly-A RNA Control Kit (Affymetrix) with exogenous positive controls that were spiked into the total RNA before cDNA synthesis. In all cases, 25 µg of each biotinylated cRNA preparation was fragmented and placed in hybridization cocktail containing biotinylated hybridization controls (GeneChip® Expression Hybridization Controls, Affymetrix). Samples were hybridized onto a GeneChip® Human Gene 1.0 ST Array at 45°C with 60 rpm for 17 hours in a Hybridization Oven 640 (Affymetrix). Microarray scanned images were obtained with a GeneChip Scanner 3000 7G (Affymetrix) using the default settings. Images were visually inspected to eliminate hybridization artifacts.
Images were analyzed with R/Bioconductor software using the Oligo (11) and LIMMA packages (12). Adjustment for multiple tests was performed using Benjamini-Hochberg False Discovery Rate correction (13). Further information on the genes was obtained from GeneCards (http://www.genecards.org) and NCBI databases (http://www.ncbi.nlm.nih.gov). Functional annotation was performed by uploading the resulting gene list onto DAVID (Database for Annotation, Visualization and Integrated Discovery, http://david.abcc.ncifcrf.gov) using the GOTERM database. Genes were mapped to KEGG-pathways and scored according to P values (EASE Score, modified Fisher's exact test) and corrected for multiple testing according to the Benjamini-Hochberg False Discovery Rate correction.
Hierarchical clustering
Unsupervised clustering analysis was performed using an average-linkage hierarchical clustering of a centered correlation similarity matrix of DCIS and IDC samples with 253 genes from the intrinsic gene list previously described (14). Genes were filtered and visualized, using GeneCluster 3.0 and TreeView software, respectively.
Reverse transcription and qRT-PCR
Reverse transcription was performed using 1 μg of total RNA extracted from each of 20 matched DCIS/IDC samples, 7 pure DCIS, and 8 normal breast tissue samples using the High-Capacity cDNA Reverse Transcription Kit (Applied Biosystems, Foster City, CA, USA). To analyze gene expression patterns, qRT-PCR was performed using specific TaqMan probes (Applied Biosystems) for ASPN (Hs00214385_m1), TMSB10 (Hs00363670_m1), KRT5 (Hs00361185_m1), GJB2 (Hs00955889_m1), ENPP2 (Hs00196470_m1), and ST6GAL2 (Hs00383541_m1). qRT-PCR was performed according to the manufacturer's instructions using a 7500 Real Time PCR System (Applied Biosystems). Expression levels were measured in triplicate from each cDNA dilution. Relative gene expression was performed according to the comparative Ct (ΔΔCt) method using mitochondrial ribosome protein L19 (MRPL19) as an endogenous control.
Immunohistochemistry (IHC)
Tissue microarrays (TMAs) were prepared from formalin-fixed paraffin-embedded tissues obtained from three representative areas of each tumor. Tissue cores with 1 mm diameters were precisely arrayed in a paraffin block using a tissue microarray workstation (Beecher Instruments, Sun Prairie, WI, USA). For each TMA, H&E-stained slides were prepared to confirm the presence of the original selected tumor areas. Serial, 5-μm thick sections were stained using the EnVision method (DAKO, Glostrup, Denmark). Details of antibody and immunostaining conditions are summarized in Table 2. Tumors were scored according to the intensity of cytoplasmic or nuclear staining as positive or negative (no staining or questionable signal intensities). All immunohistochemical results were evaluated separately by two pathologists (GP and EL) and discordant results were reviewed to achieve agreement.
Primary Antibodies and other conditions for immunohistochemical analysis
| Antibody | Clone | Dilution | Supplier | Pretreatment |
|---|---|---|---|---|
| ER | SP11 | 1:1* | Dako | PT link pH 9. |
| PR | PgR636 | 1:1* | Dako | PT link pH 9. |
| Ki-67 | MIB-1 | 1:1* | Dako | PT link pH 6. |
| Cam 5.2 | Cam 5.2 | 1:2* | Dako | PT link pH 6. |
| CK 5/6 | D5/16 B4 | 1:1* | Dako | PT link pH 9. |
| Vimentin | V9, Dako | 1:1* | Dako | PT link pH 9. |
| Asporin (ASPN) | Polyclonal | 1:200 | Covalab | PT link pH 9. |
| Connexin 26 (GJB2) | Polyclonal | 1:10 | Antibodies-online.com | PT link pH 6. |
| ST6GAL2 | Polyclonal | 1:20 | Sigma | PT link pH 6. |
| Herceptest | Polyclonal | 1:1* | Dako | HerceptestTM for Automated Link Platforms |
* Pre-diluted Ab
Mouse tumor samples
Animal protocols used in this study were approved by the Institutional Animal Care and Use Committee of the Institut de Recerca, Hospital de la Santa Creu i Sant Pau. Mouse tumor samples were kindly provided by Dr. Blanco-Vaca (Sant Pau Research Institute, Barcelona, Spain). MMTVPyMTTg mice express high levels of the transforming oncogene polyoma virus middle T antigen (PyMT) under the control of the mouse mammary tumor virus long terminal repeat promoter, which specifically directs expression to the mammary epithelium. Mice spontaneously develop widespread multifocal adenomas/DCIS at 8 weeks and invasive/metastatic carcinomas at 13 weeks. The similarities between the PyMT model and human breast cancer have been validated by histological studies demonstrating a striking similarity between PyMT carcinogenesis and various stages of human ductal carcinoma progression (15). Genotyping was performed as indicated at Jackson Laboratories, Bar Harbor, ME, USA. Gene expression of mouse tissues was performed as described above for human tissues.
Statistical analyses
Differences among groups were analyzed for statistical significance with non-parametric Mann-Whitney U tests or by one-way analysis of variance (ANOVA) using SPSS Statistics 18 software (Chicago, IL, USA). In addition, when the variance was not homogeneous, we used the Kruskal-Wallis test. Results are expressed as means ± SE and differences were considered to be significant if P <0.05.
RESULTS
Tissue selection and clinical-pathological data
Twenty breast cancer patients with tumors containing simultaneous foci of DCIS and IDC were selected for this study (Table 1). The median age of the patients was 60 years (range 36-78 years). The average tumor size was 2.3 cm (range 0.5-15 cm). Axillary lymph node metastases were detected in eight patients. The histological grades for IDCs were I in three tumors (15%), II in eight tumors (40%), and III in nine tumors (45%). Ten tumors were positive for hormone receptors (HRs), estrogen receptor (ER), and/or progesterone receptor (PR) and were negative for HER2 (HR+/HER2-). Seven tumors were HR/HER2+, two tumors were HR-/HER2+, and one tumor was HR/HER2-. The median percentage for the Ki67 proliferation index was 13% for IDC tumors (range 5-80%) and atypical nuclei coincided with the invasive and in situ component. The DCIS fraction of tumors was greater than10% in 15 samples and comedo necrosis was detected in five cases. HER2 was overexpressed in 11 DCIS samples. The median Ki67 index of DCIS was of 7% (range 3-40%) and only eight cases had a Ki67 greater than 20%.
Comparative micro array analysis and hierarchical clustering of IDC-DCIS matched samples
IDC and DCIS paired samples from the 20 tumors were hybridized to the 10,945 spots on the GeneChip® Human Gene 1.0 ST Arrays and 1,158 probe sets were found to be differentially regulated. After adjusting the P values, we found that 56 genes were differentially expressed in the IDC samples. Among these genes, 31 were upregulated in IDC samples compared to DCIS samples (Supplementary Material: Table S1) and 25 were downregulated (Supplementary Material: Table S2).
Hierarchical clustering was performed using the Euclidian distance-generating function with probe sets differentially expressed in the microarray analysis (14). Our results showed that tumor samples were distributed into two well-differentiated clusters. The first cluster was composed of HR+/HER2- IDCs with the exception of one HER2+ tumor. The second cluster was composed mainly of DCIS samples, but also included five HR-/HER2+ grade II IDC tumors and one HR-/HER”- sample.
Interaction of tumor cells with stroma is required for tumor invasion
Functional annotation of the differentially regulated probe sets according to Gene Ontology revealed that several genes were upregulated in IDC compared with DCIS. These genes were involved in a) extracellular matrix interactions and focal adhesions (COL11A1, COL10A1, FN1, COL12A1, MMP13, THBS2, SPARC, LRRC15, and ASPN), b) cell adhesion (GJB2), c) extracellular matrix remodelling and cell motility (PLAUR, PLAU, MMP11, and MMP14), d) calcium and metal binding and transport (GPC6, ADAMTS16, and BGN), most of which are members of the small proteoglycans family, e) genes encoding signal transducers (RGS16, ADORA3, PRR5L, and SPSB1), and f) enzymes involved in tumor growth (ENNP2 and ST6GAL2).
In contrast, 25 genes were statistically downregulated in IDC compared to DCIS. Functions of these genes included a) metabolic and enzymatic functions (ACACB and PAMR1), b) tumor suppression (SERPINB5), c) cell cytoskeleton regulation (KRT5), and d) cell adhesion (LYVE1, TNXB, TNXA, and F8).
Confirmation of differential gene expression between IDC and DCIS via qRT-PCR
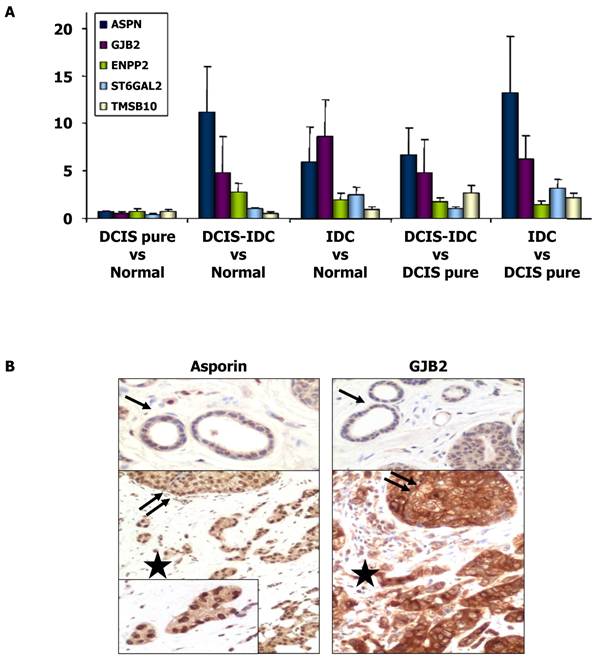
The expression of several genes that were shown to be upregulated in IDC compared to DCIS in the microarray analyses were further analyzed by qRT-PCR (Table 3). Our results confirmed the upregulation of ASPN, GJB2, ST6GAL2, ENPP2, and TMSB10 (P < 0.05), whereas KRT5 (P < 0.05) was downregulated in IDC compared to DCIS. When the analysis was performed in the group of HR+/HER2- tumors, the upregulation of ASPN, GJB2, and ST6GAL2 was confirmed in IDC (P < 0.05), but the differential expression of ENPP2 and TMSB10 was not significant. Therefore, ENPP2 and TMSB10 were excluded from further analyses. Invasive HR+/HER2+ carcinomas were differentiated from DCIS by elevated expression levels of SERPINB5. However, this gene was not differentially expressed in the overall analysis. As seen in Figure 1, there were great differences in mRNA expression of asporin, GJB2, and ST6GAL2 between the samples of DCIS associated with IDC and the samples of DCIS without invasion. Differential expression of these genes was not detected in the comparison between normal tissues and pure DCIS.
Expression of ASPN, GJB2, ENPP2, ST6GAL2, and TMSB10 genes. (A) Histograms showing differential gene expression between DCIS pure vs normal tissue, DCIS associate to IDC vs normal breast tissue, IDC vs normal tissue, DCIS associate to IDC vs DCIS pure samples and IDC vs DCIS pure samples. Gene expression levels of ASPN, GJB2, ENPP2, ST6GAL2 and TMSB10 were determined by qRT-PCR. The bar represents the mean ± S.E. of all samples by duplicate. Asterisks (*) indicates statistically significant differences (P < 0.05). (B) Immunohistochemical images of asporin and GJB2 (connexin-26) expressions in normal tissue (black arrow), proliferative non-invasive (two black arrows) and invasive neoplasms (black star).
Validation of microarray-based gene expression results by qRT-PCR.
| IDC vs. DCIS | Total IDC vs. DCIS (n = 20) | HR+/HER-2- (n = 10) | HR+/HER-2+ (n = 7) | ||||
|---|---|---|---|---|---|---|---|
| Gene Name, symbol | Average FC*± SE | Mean FC | P | Mean FC | P | Mean FC | P |
| Asporin , ASPN | 3.336 ± 0.625 | 5.371 | 0.001 | 5.586 | 0.034 | 1.627 | N.S. |
| Maspin, SERPINB5 | 0.772 ± 0.114 | 0.949 | N.S. | 0.827 | N.S. | 6.732 | <0.001 |
| Connexin 26, GJB2 | 1.1635 ± 0.181 | 5.276 | 0.001 | 3.088 | 0.007 | 1.651 | N.S. |
| Autotaxin, ENPP2 | 1.019 ± 0.138 | 6.440 | 0.013 | 2.405 | N.S. | 2.548 | N.S. |
| ST6GAL2 | 1.493 ± 0.141 | 16.547 | <0.001 | 13.026 | 0.002 | 2.952 | N.S. |
| Thymosin beta-10, TMSB10 | 1.075 ± 0.063 | 5.017 | 0.048 | 1.203 | N.S. | 1.797 | N.S. |
| Cytokeratin 5, KRT5 | 0.689 ± 0.106 | 0.385 | 0.004 | 0.492 | N.S. | 0.076 | N.S. |
Notes: * Data from microarray analysis. Abbreviations: FC, fold-change; N.S., non-significant; HR, hormone receptors (including estrogen and progesterone receptors)
Immunohistochemical expression of ASPN (asporin), GJB2 (connexin 26) and ST6GAL2
To further validate our gene expression data, we performed an immunohistochemical study to determine the protein expression patterns of ASPN, GJB2, and ST6GAL2 on TMAs of the tumors. There was intense asporin nuclear staining in approximately 50% of DCIS tumor cell nuclei (range 20-100; SD = 27.4), 51.5% of IDC tumor nuclei (range 5-100; SD = 33), whereas only 4% of nuclei were stained in normal tissues (P < 0.001). Asporin staining was also present in nuclei of fibroblast, endothelial cells, and mature lymphocytes (Figure 1).
Positive cytoplasmic staining of connexin 26 (GJB2 gene product) was found in 18/20 IDC samples, 16/20 DCIS samples, and only 2/20 normal breast tissue samples (P = 0.001). Connexin 26 was also present in fibroblasts, endothelial cells, and the cytoplasm of mature histiocytes (Figure 1). However, ST6GAL2 protein immunostaining was heterogeneous and irregular in IDC and DCIS samples and negative in normal ductal breast epithelial cells. Positive controls included fibroblasts and endothelial cells.
qRT-PCR analysis of gene expression in mouse tumors
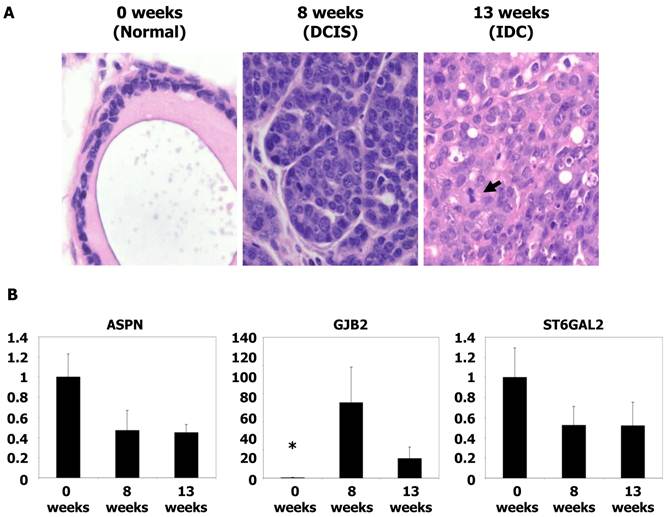
To analyze the expression of genes potentially associated with invasiveness, we utilized frozen materials from a spontaneous murine model of breast cancer (MMTV-PyMT). Gene expression was evaluated by qRT-PCR. mRNA was obtained from tumors at 8 weeks (equivalent to the DCIS stage) and 13 weeks (equivalent to the IDC stage) (15). The level of GJB2 was 134-fold higher in the DCIS samples and 37-fold higher in IDC tumors (P < 0.05) with respect to normal mouse breast tissue. However, no significant differences were found between the DCIS and IDC samples. Furthermore, no differences in ASPN and ST6GAL2 levels were found (P = NS) (Figure 2). These analyses were repeated three times before validation.
Microscopic images and qRT-PCR of mice tumors. (A) Microscopic images of typical breast tissue in MMTV-PyMT mice at ages of 0 weeks (considered as normal tissue), 8 weeks (equivalents to DCIS), and in 13 weeks (equivalent to IDC). Tumor proliferation overgrowth stroma with the time as the grade of nuclear atypia increases. Mitoses are clearly found in IDC (see arrow), H&E staining, x40 magnification. (B) Histograms showing relative fold changes in gene expression by qRT-PCR of ASPN, GJB2, and ST6GAL2. Significative increased overexpression of GJB2 in DCIS and IDC with respect to normal tissue. Each bar represents the mean ± S.E. of all samples by duplicate. Asterisk (*) denote statistically significant differences (P < 0.05).
DISCUSSION
The two main pathological hallmarks of neoplasia are local invasion and distant metastasis. The mechanisms of local invasion in breast DCIS and the progression to IDC are not well known. Thus, we compared gene expression patterns in simultaneous in situ and invasive areas of ductal carcinomas with the aim of elucidating the mechanism of breast carcinoma invasiveness.
The classical multistep model of breast cancer progression hypothesized that IDC is preceded by DCIS, “atypical ductal hyperplasia”, and “usual ductal hyperplasia” (16). Later, it was suggested that low-grade DCIS tends to progress to low grade IDC and, in parallel, high-grade DCIS tends to progress to high-grade IDC (17). Simultaneous assessments of multiple biological markers in DCIS and IDC, including steroid receptors, HER-2, and cell cycle regulatory genes (p53, Ki-67, bcl-2, and p21) support this assessment (18). Nevertheless, these results did not improve the predictive power of standard pathological parameters, nor did they explain the mechanism of invasiveness because the genetic changes that modulate invasiveness are likely already present in cells before the cells acquire the typical DCIS morphology (2-4). Recent chromosomal, genetic, and molecular studies support the theory of parallel disease for the progression of DCIS to IDC. However, it is likely that only a small subpopulation of highly tumorigenic and migrating cancer cells (0.1-3% of the total cancer cells) may be responsible for tumor growth, distant metastases, treatment resistance, and recurrence (2-4).
Breast tumor cell invasiveness is a complex process that is related to genetic alterations of tumor cells, loss of myoepithelial cells, and a stromal facilitation of invasion that includes fibroblast activation, altered expression of growth and angiogenic factors, immunological reactivity, and increased expression of chemokines and matrix metalloproteinases (MMPs) (4, 19-21). Many studies have analyzed the role of myoepithelial cells in blocking tumor cell invasiveness (3, 4, 7), which is not the subject of our study. Myoepithelial cells may compete with fibroblasts and with the inflammatory processes, which could facilitate invasion (4, 19, 21).
Previous transcriptome studies underlines the cooperation of the stroma in breast carcinoma invasion, which is associated with upregulation of EMT, cell motility, extracellular matrix (ECM) degradation, and cell proliferation, whereas genes related to cell adhesion and cytoskeletal intermediate filaments are generally downregulated (2, 4, 7, 8). Our results are in agreement with the upregulation of several genes related to the extracellular matrix (MMP11, MMP13, MMP14, SPARC, LLCR15, PLAU, and ASPN) and cell adhesion (GJB2) in breast carcinomas. We selected one gene from each category to further explore their functions in these metabolic pathways.
Several extracellular matrix proteins may favor invasiveness and their production may be stimulated by growth factors such as transforming growth factor beta (TGF-β), which is controlled by several proteases, especially MMPs (20). The expression of TGF-β family members was not significantly altered in our study despite their well-documented role in invasiveness (2, 3, 8, 9) whereas we did observe upregulation of MMPs and asporin, which are involved in the TGF-β regulation. Asporin, encoded by ASPN, is a member of the leucine-rich repeat protein family that is associated with mesenchymal tissues (22). Asporin is produced by fibroblasts, inhibits TGF-β effects, and has a paracrine effect on prostate (23) and stomach (24) tumor cells. Although asporin was previously associated with invasive lobular carcinomas (25), we found that it has an important role in initial carcinogenesis (DCIS) and in invasiveness of IDC. In the present work, the level of asporin mRNA in IDC, as determined by qRT-PCR, was related to invasiveness and the expression of this protein was confirmed by immunohistochemistry in hormone-related cases of IDC and DCIS. In contrast, the activity of decorin, another member of the ASPN family of genes is controversial. Decorin expression has been correlated with poor prognosis in estrogen receptor-negative breast cancers (26). Other studies have indicated an inhibitory effect by decorin on both primary tumor growth and metastatic spreading (27).
The upregulation of genes related to cell adhesion in carcinomas, such as GJB2, is unexpected because neoplasms are characterized by loss of cell cohesion. GJB2 encodes connexins 26 and 43, which participate in specialized structures on plasma membranes by contacting adherent cells and forming cell-to-cell channels. In other tumors, such as colorectal carcinomas, the prognostic significance of connexin 26 is controversial (28, 29). In breast cancer cell cultures the downregulation of connexin 26 is associated with EMT inhibition (30). More recent studies of human breast carcinomas have shown an association of connexin 26 expression with invasion and lymph node metastases (31). Our transcriptome studies indicated that GJB2 upregulation correlated with invasion and increased GJB2 mRNA production was detected by qRT-PCR. Connexin 26 was also identified by immunohistochemistry in tumor cells and in stroma. Furthermore, a statistical association of GJB2 upregulation with DCIS was demonstrated in PyMT mouse samples, thus supporting its role in DCIS associated with IDC and pure IDC, but not in pure DCIS.
Invasion is a multi-step process in which a multidirectional cross talk of tumor cells and stroma is modulated by paracrine signals coming from associated tumor-stroma and/or inflammatory processes. Our study confirmed that expression of ASPN and GJB2 occurs very early during carcinogenesis and may be related to the initiation of invasion and tumor dissemination. Further studies are required to confirm our data. These data would assist in the development of precise diagnostic markers of invasion and in the identification of new therapeutic targets.
Supplementary Material
Table S1: Up-regulated genes in IDC versus DCIS. Table S2: Down-regulated genes in IDC versus DCIS.
Competing Interests
All authors declare that they have no competing interests.
Acknowledgements
This paper was presented in part at the 100th Annual Meeting of the United States and Canadian Academy of Pathology; San Antonio, TX. March 2010 (Mod Pathol 2011; 24S: 31A).
This work was funded by grant of Mutua Madrileña Foundation (2008-11).
We thank Gemma Llaveria PhD and Franciso Blanco-Vaca Md, PhD, who kindly provided MMTV-PyMT Tg mice tumor samples, Elena Serrano PhD and Josefina Muñoz for their technical assistance, and Sergi Beltran PhD (Parc Cientific de Barcelona) who repeated and confirmed the microarray analysis.
Abbreviations
DCIS: ductal carcinoma in situ; EMT: epithelial-mesenchymal transition; HR: hormone receptors; IDC: invasive ductal carcinoma; MMP: matrix metalloproteinases; TMA: tissue microarray.
References
1. Carter CL, Corle DK, Micozzi MS, Schatzkin A, Taylor PR. A prospective study of the development of breast cancer in 16,692 women with benign breast disease. Am J Epidemiol. 1988;128:467-77
2. Castro NP, Osorio CA, Torres C. et al. Evidence that molecular changes in cells occur before morphological alterations during the progression of breast ductal carcinoma. Breast Cancer Res. 2008;10:R87
3. Hu M, Yao J, Carroll DK. et al. Regulation of in situ to invasive breast carcinoma transition. Cancer Cell. 2008;13:394-406
4. Ma XJ, Dahiya S, Richardson E, Erlander M, Sgroi DC. Gene expression profiling of the tumor microenvironment during breast cancer progression. Breast Cancer Res. 2009;11:R7
5. van de Vijver MJ. Ductal carcinoma in situ of the breast: histological classification and genetic alterations. Recent Results Cancer Res. 1998;152:123-34
6. Sotiriou C, Pusztai L. Gene-Expression Signatures in Breast Cancer. N Engl J Med. 2009;360:790-800
7. Ma XJ, Salunga R, Tuggle JT. et al. Gene expression profiles of human breast cancer progression. Proc Natl Acad Sci U S A. 2003;100:5974-9
8. Schuetz CS, Bonin M, Clare SE. et al. Progression-specific genes identified by expression profiling of matched ductal carcinomas in situ and invasive breast tumors, combining laser capture microdissection and oligonucleotide microarray analysis. Cancer Res. 2006;66:5278-86
9. Hannemann J, Velds A, Halfwerk JB. et al. Classification of ductal carcinoma in situ by gene expression profiling. Breast Cancer Res. 2006;8:R-61
10. Nagaraja GM, Othman M, Fox BP. et al. Gene expression signatures and biomarkers of noninvasive and invasive breast cancer cells: comprehensive profiles by representational difference analysis, microarrays and proteomics. Oncogene. 2006;25:2328-38
11. Carvalho B, Bengtsson H, Speed TP, Irizarry RA. Exploration, normalization, and genotype calls of high-density oligonucleotide SNP array data. Biostatistics. 2007;8:485-99
12. Smyth GK. Linear models and empirical bayes methods for assessing differential expression in microarray experiments. Stat Appl Genet Mol Biol. 2004;3:Article3
13. Benjamini Y, Drai D, Elmer G, Kafkafi N, Golani I. Controlling the false discovery rate in behavior genetics research. Behav Brain Res. 2001;125:279-84
14. Hu Z, Fan C, Oh DS. et al. The molecular portraits of breast tumors are conserved across microarray platforms. BMC Genomics. 2006;7:96
15. Lin EY, Jones JG, Li P. et al. Progression to malignancy in the polyoma middle T oncoprotein mouse breast cancer model provides a reliable model for human diseases. Am J Pathol. 2003;163:2113-26
16. Carter CL, Corle DK, Micozzi MS. et al. A prospective study of the development of breast cancer in 16,692 women with benign breast disease. Am J Epidemiol. 1988;128:467-77
17. Buerger H, Mommers EC, Littmann R. et al. Ductal invasive G2 and G3 carcinomas of the breast are the end stages of at least two different lines of genetic evolution. J Pathol. 2001;194:165-70
18. Clark SE, Warwick J, Carpenter R. et al. Molecular subtyping of DCIS: heterogeneity of breast cancer reflected in pre-invasive disease. Br J Cancer. 2010;104:120-7
19. West RB, Nuyten DS, Subramanian S. et al. Determination of stromal signatures in breast carcinoma. PLoS Biol. 2005;3:e187
20. Visse R, Nagase H. Matrix metalloproteinases and tissue inhibitors of metalloproteinases: structure, function, and biochemistry. Circ Res. 2003;92:827-39
21. Allinen M, Beroukhim R, Cai L. et al. Molecular characterization of the tumor microenvironment in breast cancer. Cancer Cell. 2004;6:17-32
22. Nakajima M, Kizawa H, Saitoh M. et al. Mechanisms for asporin function and regulation in articular cartilage. J Biol Chem. 2007;282:32185-92
23. Orr B, Riddick AC, Stewart GD. et al. Identification of stromally expressed molecules in the prostate by tag-profiling of cancer-associated fibroblasts, normal fibroblasts and fetal prostate. Oncogene. 2011 doi:10.1038/onc.2011.312
24. Rajkumar T, Vijayalakshmi N, Gopal G. et al. Identification and validation of genes involved in gastric tumorigenesis. Cancer Cell Int. 2010;10:45
25. Turashvili G, Bouchal J, Baumforth K. et al. Novel markers for differentiation of lobular and ductal invasive breast carcinomas by laser microdissection and microarray analysis. BMC Cancer. 2007;7:55
26. Troup S, Njue C, Kliewer EV. et al. Reduced expression of the small leucine-rich proteoglycans, lumican, and decorin is associated with poor outcome in node-negative invasive breast cancer. Clin Cancer Res. 2003;9:207-14
27. Goldoni S, Seidler DG, Heath J. et al. An antimetastatic role for decorin in breast cancer. Am J Pathol. 2008;173:844-55
28. Nomura S, Maeda K, Noda E. et al. Clinical significance of the expression of connexin26 in colorectal cancer. J Exp Clin Cancer Res. 2010;29:79
29. Knosel T, Emde A, Schluns K. et al. Immunoprofiles of 11 biomarkers using tissue microarrays identify prognostic subgroups in colorectal cancer. Neoplasia. 2005;7:741-7
30. McLachlan E, Shao Q, Wang HL, Langlois S, Laird DW. Connexins act as tumor suppressors in three-dimensional mammary cell organoids by regulating differentiation and angiogenesis. Cancer Res. 2006;66:9886-94
31. Kanczuga-Koda L, Sulkowski S, Lenczewski A. et al. Increased expression of connexins 26 and 43 in lymph node metastases of breast cancer. J Clin Pathol. 2006;59:429-33
Author contact
![]() Corresponding author: Enrique Lerma, MD, Hospital de la Santa Creu i Sant Pau Universitat Autònoma de Barcelona, Department of Pathology, Sant Quinti 87-89, 08041 Barcelona, Spain. E-mail: elermacat
Corresponding author: Enrique Lerma, MD, Hospital de la Santa Creu i Sant Pau Universitat Autònoma de Barcelona, Department of Pathology, Sant Quinti 87-89, 08041 Barcelona, Spain. E-mail: elermacat