Impact Factor ISSN: 1837-9664

 Global reach, higher impact
J Cancer 2012; 3:269-284. doi:10.7150/jca.4592 This volume Cite
Research Paper
Identification of Potential Glycoprotein Biomarkers in Estrogen Receptor Positive (ER+) and Negative (ER-) Human Breast Cancer Tissues by LC-LTQ/FT-ICR Mass Spectrometry
Suzan M. Semaan1, Xu Wang1, Alan G. Marshall1,2, Qing-Xiang Amy Sang1 ![]()
1. Department of Chemistry and Biochemistry and Institute of Molecular Biophysics;
2. Center for Interdisciplinary Magnetic Resonance, National High Magnetic Field Laboratory, Florida State University, Tallahassee, Florida 32306-4390, USA.
Received 2012-5-14; Accepted 2012-6-20; Published 2012-6-21
Abstract
Breast cancer is the second most fatal cancer in American women. To increase the life expectancy of patients with breast cancer new diagnostic and prognostic biomarkers and drug targets must be identified. A change in the glycosylation on a glycoprotein often causes a change in the function of that glycoprotein; such a phenomenon is correlated with cancerous transformation. Thus, glycoproteins in human breast cancer estrogen receptor positive (ER+) tissues and those in the more advanced stage of breast cancer, estrogen receptor negative (ER-) tissues, were compared. Glycoproteins showing differences in glycosylation were examined by 2-dimensional gel electrophoresis with double staining (glyco- and total protein staining) and identified by reversed-phase nano-liquid chromatography coupled with a hybrid linear quadrupole ion trap/ Fourier transform ion cyclotron resonance mass spectrometer. Among the identified glycosylated proteins are alpha 1 acid glycoprotein, alpha-1-antitrypsin, calmodulin, and superoxide dismutase mitochondrial precursor that were further verified by Western blotting for both ER+ and ER- human breast tissues. Results show the presence of a possible glycosylation difference in alpha-1-antitrypsin, a potential tumor-derived biomarker for breast cancer progression, which was expressed highest in the ER- samples.
Keywords: Two-dimensional gel electrophoresis, Estrogen receptor positive and negative breast cancer, Biomarkers, Alpha-1-antitrypsin, Fourier transform ion cyclotron resonance mass spectrometry, Proteomics
Introduction
Breast cancer, if cancers of the skins are excluded, is the most frequently diagnosed cancer in American women and ranks immediately after lung cancer in mortality. According to the American Cancer Society Breast Cancer Facts and Figures, approximately 39,510 women (i.e., 14.4% of those diagnosed) will die from breast cancer in the USA. In 2012, estimated new breast cancer occurrences will reach 226,870, not including in situ carcinoma. About 63,300 in situ breast carcinomas will be diagnosed in 2012 [1]. Based on proteomic and genomic studies, prognostic biomarker candidates identified from breast cancer include growth factor receptors, steroid receptors, p53, Ki-67, cyclins, BRCA1 and BRCA2, urokinase plasminogen activator, p21, and pro- and anti-apoptotic factors [2]. The Food and Drug Administration has approved biomarkers CA 15.3, human epidermal growth factor receptor 2 (Her-2/neu), and CA27-29. However, the combination of several biomarkers may produce the best prognosis [3].
Breast cancer development and progression are regulated by estrogen and its receptor (ER) that is one of the predictive markers including progesterone receptor (PR), Her-2/neu, and ER for breast cancer. Yet, the anti-estrogen drug tamoxifen is often ineffective even after estrogen receptor positivity [2]. Previous research has revealed that the tumorigenic epithelial cells in the breast duct are ER positive (ER+) cells overlying an intact myoepithelial membrane, but some adjacent cells overlying a focally disrupted myoepithelial cell layer have lost their response to anti-estrogen drugs because they no longer express the ER. Moreover, the loss of the ER of those once tumorigenic cells at the invasion site contributes to their higher potential for aggressiveness and invasion [4-6]. Therefore, it is important to search for new prognostic and predictive markers for breast cancer progression from ER+ to ER-.
Many fundamental cellular processes such as cellular differentiation, control of cell division, cell-cell recognition, adhesion, and malignant transformation are controlled by oligosaccharides [7-10]. In most cases, oligosaccharides are conjugated with other biomolecules known as glycol-conjugates. This process is observed within the endoplasmic reticulum, Golgi apparatus, nucleus, and the cytoplasm of a cell. More than half of all proteins are glycosylated, either N- and/or O-linked [11]. Within the endoplasmic reticulum and Golgi apparatus, O-linked glycans are usually attached to the peptide chain by a serine or threonine hydroxyl group. Mostly within the endoplasmic reticulum, N-linked glycans, the predominant carbohydrate attachment in mammalian cells [12], are linked to the side chain by means of an amide bond to asparagine in a 60-65% conserved Asn-Xxx-Ser/Thr motif (in which Xxx can be any amino acid except proline) [11, 13-14]. N-linked carbohydrates are frequently found together with O-linked oligosaccharides in proteins such as fetuin [15], insulin receptor [16], IgG immunoglobulins [17], and O-linked glycoproteins include collagens [18], mucins [19], and proteoglycans [20].
In breast cancer cells, changes in O-linked [21-26] and N-linked [27-28] oligosaccharide structures are frequently correlated with cancerous transformation. For example, breast carcinomas may display altered expression of secreted and membrane-bound mucins, such as MUC1 and MUC2 [29]. When epithelial cell-surface mucin MUC1 is abnormally glycosylated, its expression shows up-regulation in breast cancer [30]. As a result, new epitopes are exposed leading to humoral and cell-mediated immune responses [31]. Furthermore, those cancer-related peptide epitopes have been exploited as immunogens for cancer [32]. Therefore, identification of glycoproteins in the ER+ and ER- breast cancer tissues might reveal possible target(s) and identify putative biomarkers or tumor suppressors for pro- and pre-aggressive breast cancer stages. Here, we compare glycoproteins in breast cancer ER+ tissue and those in ER- tissue, the more aggressive breast cancer, after sample N-deglycosylation to compare glycosylation differences with controls and double staining of the two-dimensional electrophoresis (2-DE) gels. Glycoproteins were identified by reversed-phase nano-liquid chromatography coupled with a hybrid linear quadrupole ion trap/ Fourier transform ion cyclotron resonance mass spectrometer (LC-LTQ/FT-ICR MS) and the glycosylation type for selected breast cancer-related proteins was verified by Western blotting.
Materials and Methods
Chemicals and materials
Ready immobilized pH gradient (IPG) Strips, pH 4-7, 11 cm long, were purchased from Bio-Rad. Dithiothreitol was purchased from Promega Corporation (Madison, WI). Bromophenol blue, Tris, SDS, Tricine, Ponseau S solution, bovine serum albumin (BSA), and cholamidopropyl dimethylammonio propanesulfonate hydrate (CHAPS) were purchased from Sigma-Aldrich. Glacial acetic acid was purchased from EMD chemicals Inc. Urea was purchased from Fisher Scientific. Primary polyclonal anti-human rabbit antibodies against ER-α MC-20 (MW 66 kDa), calmodulin FL-149 (MW 17 kDa), and superoxide dismutase FL-222 (MW 25 kDa) were purchased from Santa Cruz Biotechnology, Inc. (Santa Cruz, CA). Polyclonal rabbit anti-human alpha-1-antitrypsin A0012 (MW ~57 kDa) was purchased from DakoCytomation, Denmark. Rabbit polyclonal anti-human alpha-1-acid glycoprotein ab440-2 (MW ~50 kDa) was bought from Abcam. Anti-rabbit IgG (whole molecule) peroxidase antibody A0545 produced in goat and monoclonal mouse anti-β-actin antibody A5316 (MW 42 kDa) were purchased from Sigma-Aldrich. Protease and phosphatase inhibitor cocktails were purchased from Thermo-Pierce (Rockford, IL).
Sample preparation
Human ductal breast carcinoma tissue samples were obtained from the Cooperative Human Tissue Network-Midwestern Division. Tissues were cut into 1 mm cubes on ice [33]. Tissues were suspended in cold tissue lysis buffer in 10 mM Tris pH 7.5, 130 mM NaCl, 1% octylglucopyranoside (OG), 1% CHAPS, 10 mM sodium phosphate, 10 mM sodium fluoride, and 1x phosphatase and protease inhibitor (EDTA-free). Samples were centrifuged for 15 min at 14,000 rpm at 4 ˚C to remove insoluble material. The supernatant layer was transferred to a new tube, and the pellet and the top lipid layer were discarded. Samples were then stored at -20 ˚C until further analysis.
Determination of sample protein concentration
Bicinchoninic Acid (BCA) Protein Assay Kit (Pierce, Rockford, IL) was utilized to determine the protein concentration of all tissue lysates. Bovine serum albumin was used to make the standards according to the manufacturer's instructions. The enhanced test tube protocol was followed and tissue lysis buffer was the diluent. A standard curve was employed to determine the protein concentration of the sample tissue lysates.
Western blots
Western blots were done essentially as described by Towbin et al. [34]. Samples were probed first by use of ER alpha primary antibody and all ER+ and ER- samples were identified (Figure 1). 25 μg of each sample lysate was vacuum-dried. Proteins were reconstituted with sample buffer (1.25 mL of 1 M Tris-HCl pH 6.8, 500 mg sodium dodecyl sulfate, 25 mg bromophenol blue, 2.5 mL glycol, and freshly added 1% mercaptoethanol), boiled for 5 min, and loaded onto a 10% polyacrylamide gel. The gel was electrophoresed at 50 V for 30 min, then at 100 V until the end of the separation. To transfer the separated proteins onto a nitrocellulose membrane, the gel was incubated in cold transfer buffer (100 mM CAPS, pH 11) for 15 min, then electroblotted with 30 V at 4 ˚C overnight. Ponseau S solution was used to verify the transfer of the proteins onto the nitrocellulose and in some cases as a loading control. After 1 h of blocking with 5% BSA, the nitrocellulose was incubated in 1 µg/mL of primary antibody ER-α anti-human rabbit followed by three 10 min Tris buffer saline with 1% Tween-20 (TBST) washes and a 45 min incubation with a horseradish peroxidase-conjugated secondary antibody against primary antibody (1:20,000 in 5% BSA). Chemiluminescence detection was achieved by applying SuperSignal West Pico-Stable Substrate (Pierce, Rockford, IL), Kodak Scientific Imaging Film (Kodak), and Fixer/Developer and Replenisher (Kodak) according to the manufacturer's instructions. Similar procedures were followed to probe for alpha-1 antitrypsin (1:2,000), alpha-1-acid glycoprotein (1:1,000), calmodulin (1:200), superoxide dismutase (1:200), and β-actin (loading control) (1:5,000) proteins, and antibodies were diluted in 1% BSA in TBST. For multiple probing on the same nitrocellulose, the membrane was treated with 30% H2O2 for 15 min at 37 ºC while covered, then rinsed with TBST, followed by blocking and normal probing procedure [35]. The H2O2 inactivates the peroxidase enzyme on the secondary antibody under the above conditions and encourages multiple probing with minimal loss of protein by comparison to stripping buffers [35].
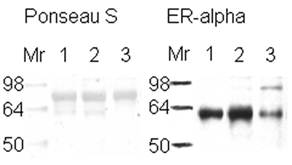
Western Blot to verify the presence of estrogen receptor in breast tissue samples. Western blot of 25 µg of ductal breast cancer tissue samples (1, 2, & 3) for estrogen receptor alpha are shown on the right side of the figure. The left side represents those samples in Ponseau S staining that shows the total loading of protein. Sample 1 is known to be ER+ from its pathology report.
Deglycosylation of sample
The GlycoProfileTM II Enzymatic In-Solution N-Deglycosylation Kit (Sigma, Saint Louis, MO) was followed with ultra-pure water as the sample solvent. 1 mg of tissue lysate from ER+ and ER- samples was boiled for 10 min until glycoproteins were identified and then for 30 min, because glycoproteins like alpha-1-antitrypsin need longer incubation for denaturation prior to deglycosylation, according to manufacturer's procedure. Deglycosylated samples (ER+D, ER-D) were treated with 50 μL PNGase F, whereas controls were treated with 50 μL ultra-pure water. The four tubes were incubated overnight at 37 ˚C. The deglycosylation reaction was stopped by heating at 100 ˚C for 10 min. After cooling to room temperature, samples in the four tubes underwent one of two treatments: they were either vacuum-dried, reconstituted with 800 µL of lysis buffer (5 M urea, 2 M thiourea, 4% CHAPS, 10% 2-propanol, 5% glycerol, and 50 mM dithiothreitol (DTT)), divided into four aliquots of ~125 μg/200 μL of lysis buffer, and stored at -20 ˚C for further analysis; or they underwent glycoprotein accumulation (see glycoprotein accumulation section), their protein concentration determined, and used for Western blot probing.
Two dimensional gel electrophoresis
For isoelectric focusing, the whole sample (125 µg in 200 µL lysis buffer) of each resulting tube was loaded on 11 cm IPG strips at pH 4-7 (Bio-Rad). By use of PROTEAN IEF Cell (Bio-Rad), isoelectric focusing was performed according to the following procedure: rehydration of the IPG strips was done at 20 ˚C and 50 V for 16 h followed by focusing the proteins at 250 V for 15 min and then at 8,000 V maintained for a total of 50,000 V h per gel. 10% SDS-PAGE Tris-HCl Criterion (Bio-Rad, Hercules, CA) gels were prepared for 2-DE. The cathode buffer consisted of 0.1 M Tricine, 0.1 M Tris-HCl pH 8.2, and 0.1% SDS whereas the anode buffer consisted of 0.2 M Tris-HCl pH 8.9. Equilibration of the IPG-strips was conducted for 15 min in 2 mL of equilibration buffer 1 (6 M urea, 2% SDS, 375 mM Tris-HCl pH 8.8, 2% DTT, and bromophenol blue) then for another 15 min in 2 mL of equilibration buffer 2 (identical to equilibration buffer 1 except with 2% iodoacetamide instead of DTT). The IPG strips were loaded onto the prepared gels, and run at 50 V for 30 min, and then at 130 V per gel until the end of the separation. Gels were fixed by overnight incubation in a 5:4:1 (methanol (MeOH): H2O: acetic acid) fixing solution.
Double staining and scanning
Some gels were double stained and scanned for visualization of the proteins. Multiplexed Proteomics Glycoprotein Gel Stain Kit (Molecular Probes) was used to stain 2-DE-fixed gels by Pro-Q Emerald 300 or 488 (glycoprotein stain) followed by Sypro Ruby (Bio-Rad, Hercules, CA) total protein gel staining. After glycoprotein staining, gels were scanned with 300 nm UV illumination and for total protein staining, gels were scanned with a Typhoon 9410 Scanning System (GE Healthcare, Amersham Biosciences) at an excitation wavelength of 457 nm detected at 610 nm.
Spot counting
Colony counting in ImageQuant TL version 7 was utilized to count gel spots with specific parameters: rectangular area of interest, sensitivity 9,740, operator size 11, noise factor 5, background 1, and automatic splitting 7. Images were filtered by means of a medium filter type. To get rid of gel speckling, filter options were set as maximum width and height of 5 for .gel files or 10 for .tif files. The mean spot count was used for comparison in Figure 3. Error bars represent a 95% confidence interval, calculated from the standard deviation for each sample (see Supplementary Table 1).
In-gel trypsin digestion
After four iterations of 2-DE for each of the four samples, glycoprotein spots were manually excised under UV light, combined in labeled microtubes, and analyzed by LC-LTQ 14.5 T FT-ICR MS. The gel pieces were de-stained with 25 mM ammonium bicarbonate in 50:50 (v/v) acetonitrile (ACN)/H2O three times and dried in a vacuum centrifuge. Gel spots were incubated with 15 µL of 10 pmol/µL trypsin (Roche, Switzerland) solution at 37 °C overnight following a standard in-gel digestion protocol [36]. Then gel spots were immersed in 20 µL of 75:25 (v/v) ACN/H2O with 5% trifluoroacetic acid to extract peptides and vacuum dried. The digests were stored at -80 °C.
Reversed phase capillary chromatography and mass spectrometry
The tryptic peptides were dissolved in 10 µL 95:5 (v/v) MeOH/H2O with 0.5% formic acid and were separated and purified by nano-HPLC, pre-packed C18 column (New Objective, Ringoes, NJ, USA). An Eksigent NanoLC (Dublin, CA) delivered a 45 min gradient (5 to 95% B) at 400 nL/min (solution A: 0.5% formic acid in 5% aqueous MeOH; solution B: 0.5% formic acid in 95% aqueous MeOH) [37].
Mass spectrometry was performed with a modified hybrid linear quadrupole ion trap (LTQ)/FT-ICR mass spectrometer (Thermo Fisher Corp., Bremen Germany) equipped with an actively shielded 14.5 T superconducting magnet (Magnex, Oxford, U.K.) [38-39]. The in-gel digested samples were analyzed by LC MS/MS with the 14.5 T LTQ FT-ICR MS operated in top-5 data-dependent mode: high resolution FT-ICR MS for precursor ions and low resolution LTQ MS/MS for product ions [40]. For each precursor ion measurement (FT-ICR MS), mass range was set to m/z 400 - 1600, resolving power was set to 100,000 at m/z 400, and 3 million charges were accumulated in the LTQ prior to transfer to the ICR cell. The five most abundant ions were fragmented separately by collision-induced dissociation in the LTQ for low-resolution MS/MS (3 microscans; 10,000 target ions; m/z = 2.0 isolation width; normalized collision energy, 35.0; activation Q, 0.250; 30 ms activation period; and dynamic exclusion list size of 60 for 1 min). Automatic gain control produced less than 500 ppb rms mass error with external calibration. Data was collected with Xcalibur software (Thermo) [41].
Data analysis and informatics
Raw mass spectra were analyzed with a custom peak-picking algorithm. In addition to the 6σ of rms baseline noise threshold, an additional 10% signal-to-noise threshold was applied during peak-picking for MS/MS [42]. The resulting files were searched with MASCOT (Matrix Science, Cambridge, UK) against an IPI human database v3.30 (2 ppm mass tolerance for parent ions; 1.5 Da tolerance for MS/MS; assumed trypsin protease specificity; one missed cleavage). Specified variable modifications include oxidation of methionine, iodoacetamide derivatization of cysteine, and phosphorylation of serine, threonine, and tyrosine.
Scaffold (version Scaffold 2.05, Proteome Software Inc., Portland, OR) was used to validate MS/MS based peptide and protein identifications. Peptide identifications were accepted if they could be established at greater than 95.0% probability as specified by the Peptide Prophet algorithm [43]. Glycoprotein identifications were accepted if they could be established at greater than 99.0% probability and contained at least two identified peptides. Protein probabilities were assigned by the Protein Prophet algorithm [44].
Glycoprotein accumulation
Glycoprotein Isolation Kit WGA (Thermo Scientific) was used to accumulate the glycoproteins rich in N-acetylglucosamine and sialic acid from the ER+ PR+, ER+ PR-, and ER- PR- deglycosylated or glycosylated samples. The ER and PR status of the breast cancer tissue samples was known from the pathology reports provided from the Cooperative Human Tissue Network-Midwestern Division. After glycoprotein capture, the flow-through was also collected for Western blot probing. Sample protein concentration was determined as mentioned before by use of the BCA kit.
Results and Discussion
ER+ vs. ER-
The expression of estrogen receptor alpha indicates the aggressiveness of the breast cancer stage, with the loss of this receptor correlated with a more aggressive stage of disease [5-6]. ER+ or ER- samples were verified with ER alpha antibody (Figure 1). Lane number 1 is a positive control according to its pathology report. Because the same amount of protein from similar ductal breast cancer tissue samples was loaded in the lanes (see Figure 1, Ponseau S), the lighter ER band indicates the presence of ER- cells. The result observed in lane 3 is because the whole tissue lysate was used, not microdissections of only the ER- cells within the tissue [45].
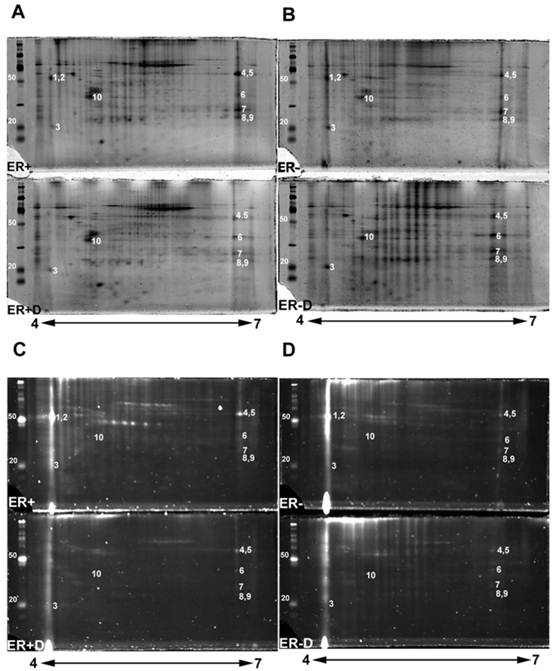
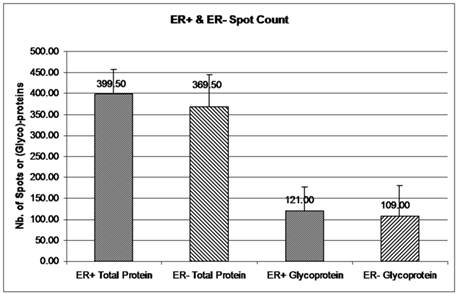
The double stained 2-DE gels of ER+ and ER- (Fig. 2A-2D) were spot-analyzed with ImageQuant. Averaged spot counts from 12 iterations of ER+ and ER- 2-DE gels were compared, of which 6 were double stained, while the others were stained only with Sypro Ruby (for total protein). Results show that 30% of the total proteins are glycoproteins (Figure 3). To our knowledge there are no studies comparing the percentage of glycoproteins in ER+ and ER- breast cancer tissues.
2-DE gel scans presenting glycoproteins versus total proteins. Double staining 2-DE gels of human breast tissue samples with estrogen receptor alpha positive (ER+), estrogen receptor alpha negative (ER-) samples, and their treated N-deglycosylated samples (ER+D) and (ER-D). Double staining of 2-DE gels utilized Pro-Q Emerald 300 glycoprotein staining C and D followed by Sypro Ruby total protein gel staining A and B. 125 µg of total lysate was loaded on 4-7 pH ranged 10% SDS-PAGE gels. The sugar cane molecular weight ladder provided in the Multiplexed Proteomics Glycoprotein Gel Stain Kit is presented at the left of each 2-DE gel.
Glycoprotein and total protein spot count in ER+ versus ER- samples. The mean number of total protein and glycoprotein in ER+ and ER- 2-DE gels was obtained from ImageQuant TL. Spot count data were collected from 12 iterations of 2-DE gels for ER+ and ER- total proteins and from 6 iterations of ER+ and ER- glycoproteins. Six out of 12 iterations had double staining for glycoproteins and total proteins. Error bars represent a 95% confidence interval calculated from the standard deviation of each sample.
Identification of glycoproteins
Double stained ER+ and ER- 2-DE gels (Fig. 2A-2D) were analyzed with Progenesis SameSpot v3.3 software (Nonlinear Dynamics, Newcastle-upon-Tyne, UK). The comparison between 2-DE gels of controls to ER+D and ER-D shows significant differential glycosylations in some glycoproteins (with p <0.05 and power >0.8) present in both ER+ and ER- samples (Fig. 2A-2D). Spot detection and matching were performed automatically by the software whereas warping was done manually. Statistically significant glycoprotein spots were excised, combined from several iterations, and analyzed by high-resolution LC-LTQ/FT-ICR MS. Table 1 shows the list of identified glycoproteins. Some glycoproteins were identified in both ER+ and ER- human breast tissue samples indicated in the MS/MS sample location in Table 1, including alpha-1-acid glycoprotein (A1A), alpha-1-antitrypsin glycoprotein (A1AT), annexin A1, peroxiredoxin-1, malate dehydrogenase mitochondrial precursor, myosin-reactive immunoglobulin kappa chain variable region, and superoxide dismutase [Mn] mitochondrial precursor (SOD2). Calmodulin (CaM) (Figure 2, spot 3) was identified in the ER- samples as indicated in Table 1, yet was also seen in ER+ samples, as later verified by Western blot. Immunoglobulins identified in Table 1 are proteins available in the cancer tissue sample but not specifically from ER+ or ER- breast cancer cells. Table 1 also lists the possible N-glycosylation sites and the O-glycosylation sites if available from www.cbs.dtu.dk/services/NetNGlyc/ and www.cbs.dtu.dk/services/NetOGlyc/ [46-47].
LC-LTQ/FTICR-MS identified common glycoproteins in ER+ and ER- breast cancer tissue samples.
| Index no. | MS/MS sample location | Gene Symbol and Protein name | Accession number | pI | Mw kDa | Protein ID probability | Nb. of unique peptides | Possible N-(top) or O-Glycosylation Sites (bold) | % Seq. Coverage |
|---|---|---|---|---|---|---|---|---|---|
| 1 | 1+ [1-] | ORM1 Alpha-1-acid glycoprotein 1 precursor | IPI00022429 | 4.93 | 24 | 100.00% [99.80%] | 4 [2] | 33NATL, 56NKSV, 72NKTE, 93NTTY, 103NGTI | 21.90% [9.95%] |
| 2 | 2+ [2-] | SERPINA1 Alpha-1-antitrypsin precursor | IPI00553177 | 5.26 | 47 | 99.80% [100.00%] | 2 [15] | 70NSTN, 107NLTE, 271NATA 416T | 6.70% [35.90%] |
| 3 | [3-] | CALM3; CALM2;CALM1 Calmodulin | IPI00075248 | 4.09 | 17 | [100.00%] | [7] | 25NGTI | [50.70%] |
| 4 | 4+ [4-] (4+D) <4-D> | IGHM IGHM protein | IPI00472610 | 7.5 | 53 | 100.00% [99.90%] (100.00%) <99.70%> | 8 [2] (8) <2> | 46NNSD, 209NASS, 272NISE, 279NATF, 439NVSL 4S, 7T, 379T | 17.20% [3.97%] (20.70%) <3.77%> |
| 5 | (5+D) | IGHG1 IGHG1 protein | IPI00844246 | 8.13 | 51 | (99.80%) | (2) | 180NSTY 2T, 3T, 7S, 22T, 106T, 108T, 233T | (18.70%) |
| 6 | (6+D) <6-D> | ANXA1 Annexin A1 | IPI00218918 | 6.75 | 39 | (100.00%) <99.80%> | (4) <2> | none NXS/T 41T | (11.80%) <8.09%> |
| 6 | [6-] (6+D) | MDH2 Malate dehydrogenase, mitochondrial precursor | IPI00291006 | 8.92 | 36 | [100.00%] (100.00%) | [3] (3) | 117NATI, 145NSTI 147T | [11.80%] (11.80%) |
| 7 | 7+ [7-] <7-D> | Myosin-reactive immunoglobulin kappa chain variable region (Fragment) | IPI00384401 | 8.74 | 12 | 99.80% [99.80%] <99.80%> | 2 [2] <2> | none NXS/T 5T, 7S, 10T, 20T, 69T | 24.80% (24.80%) <24.80%> |
| 8 | 8+ [8-] (8+D) <8-D> | PRDX1 Peroxiredoxin-1 | IPI00000874 | 8.27 | 19 | 100.00% [100.00%] (100.00%) <100.00%> | 7 [6] (9) <4> | none NXS/T 54T | 43.30% [37.40%] (48.50%) <25.10%> |
| 9 | 9+ [9-] (9+D) <9-D> | SOD2 Superoxide dismutase [Mn], mitochondrial precursor | IPI00022314 | 8.35 | 25 | 100.00% [100.00%] (100.00%) <100.00%> | 3 [4] (5) <3> | 63NVTE, 97NHSI, 212NVTE | 14.40% [19.80%] (24.80%) <14.40%> |
| 10 | 10+ (10+D) | ENDOD1 Endonuclease domain-containing 1 protein precursor | IPI00001952 | 5.55 | 55 | 99.80% (99.8%) | 2 (2) | none NXS/T 308T, 310S, 314T | 5.40% (4.80%) |
The index number (same as the spot labeling in Figure 2), location from which each MS/MS sample was identified, gene symbol and protein name, accession number, isoelectric point (pI), calculated molecular weight (Mw) in kDa, the number of unique peptides, possible N-(top) or O-(bottom) glycosylation sites, the percentage sequence coverage of peptides, and the Scaffold protein identification probability for each protein are shown. The possible glycosylation sites were gathered from two websites: www.cbs.dtu.dk/services/NetNGlyc/ and www.cbs.dtu.dk/services/NetOGlyc/. N-glycosylation sites are presented as amino acid location-in-protein number followed by the consensus amino acid letter symbols with the N-linked amino acid letter symbol in bold font. O-linked sites are presented as serine (S) or threonine (T) amino acid letter symbols in bold font with the number referring to the amino acid location in the protein.
Footnote: Number represents ER+, [Number] represents ER-, (Number) represents ER+D, and <Number> represents ER-D values. The values are separated by this respective order if identified in the corresponding gel(s).
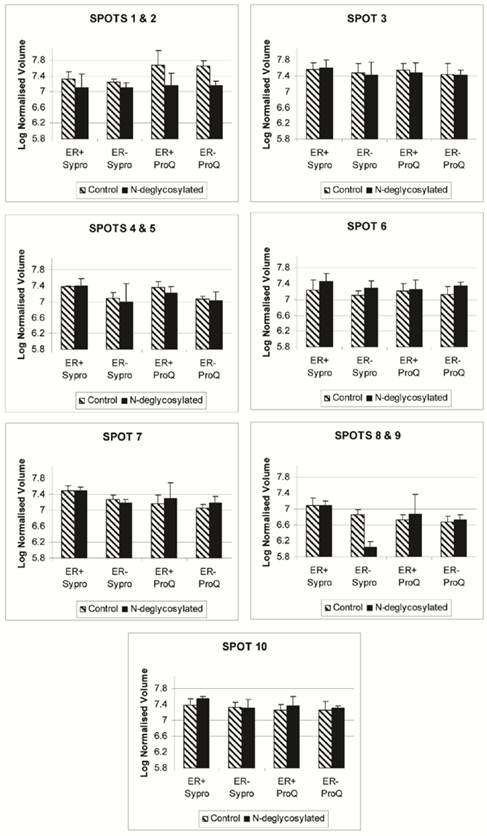
The disappearance, or intensity decrease, of glycoprotein spots after deglycosylation treatment indicates that they are mainly N-glycosylated, such as A1A and A1AT (Figure 2, spots 1 and 2; Figure 4, spots 1 and 2). Spots 1 through 10 show a similar trend of expression, in the total protein and glycoprotein stained gels, which are slightly higher in the ER+ than the ER- samples (Figure 4). This trend was also seen, yet more obvious, in our previous work with microdissected ER+ and ER- breast cell samples [45], because lysates of ER- microdissections include dramatically lower abundance ER+ cell proteins than ER- whole tissue lysates. The major problem with microdissections however, is sample availability.
Progenesis SameSpot v3.3 software results for the expression level of spots 1 through 10 after Sypro Ruby (total protein) and ProQ Emerald 300 glycoprotein staining of the ER+, ER+D, ER-, and ER-D gels. ER represents the estrogen receptor. ER+D represent the N-deglycosylated estrogen receptor positive sample. Error bars represent a 95% confidence interval calculated by the Progenesis SameSpot v3.3 software from the normalized-to-background peak volume and peak height of each spot/protein from each 2-DE gel.
Importance of N-glycoproteins in breast cancer
Several of the identified glycoproteins are important in breast cancer. For example, A1A, A1AT, CaM, annexin A1, peroxiredoxin-1, immunoglobulin gamma-1C region, and SOD2 have all been found to play roles that affect breast cancer [48-54]. Since O-glycosylated proteins have been studied more than N-glycosylated proteins, this study focused on the N-glycosylated proteins A1AT, A1A, SOD2, and CaM and their significance in breast cancer. A1A (orosomucoid) is an acute phase plasma protein, synthesized in the liver, that has been associated with neoplasia, rheumatoid arthritis, and severe burns [55]. When A1A serum concentrations are elevated it may play an immunosuppressive role by inhibiting mitogen induced lymphoproliferation as well as ligand-induced capping on the surface of human mononuclear cells [56]. A1A's only established function is that it acts as a carrier of basic and neutrally charged lipophilic compounds, and in medicine, it is known as the primary carrier of basic drugs, steroids, and protease inhibitors [57-58]. The membrane form of A1A, that is approximately 52 kDa, was found present on normal human lymphocytes, granulocytes, and monocytes and would subsequently be cleaved and released as a 42 kDa soluble serum form [59]. Approximately 45% of A1A's molecular weight is carbohydrate content [60] that are N-linked glycosylations according to Table 1, supporting why a decrease in signal was seen when samples were N-deglycosylated (Figure 4, spot 2). Testing of the serum A1A was shown to reflect prognosis and monitor progress in patients with early, recurrent, and disseminated breast cancer [48]. Plasma A1A concentration was found to be 2 fold higher in metastatic breast cancer from liver and visceral sites than from healthy samples [61]. These findings encourage research to reveal potential glycosylation differences present on A1A affecting its function in breast cancer.
A1AT is an acute phase protein, synthesized mainly in the liver, but also in neutrophils and some cancer cells [62-64]. It primarily functions as a serine protease and leukocyte elastase inhibitor. Plasma concentration of A1AT rises during inflammation [65], infection, and malignant diseases [64, 66-67], which correlates with tumor progression [68]. Native A1AT exists as an inhibitory active form. The non-inhibitory forms are produced by cleavage or degradation due to the action of matrix metalloproteinases (MMP) -1, -3, -7, -8, -11, or -26 [69-74]. Both forms were suggested to play a role in modulating tumor growth and invasiveness [49, 74], as discussed below for the Western blot results.
CaM is a calcium binding protein responsible for stimulating enzymes such as phosphatases and kinases. In human breast cancer cell lines, CaM was found to be a regulatory partner of estrogen receptor alpha [75] and a modulator of Akt activity [76]. The concentrations of soluble and particulate CaM in ER+ tumors are significantly higher than similar fractions in ER- tumors [50]. We observed a similar trend of CaM in ER+ versus ER- samples (Figure 4, spot 3). The further interest is glycosylation difference of CaM in these samples.
SOD2 converts superoxide radicals to hydrogen peroxide and oxygen, protecting the cell against their potential damage. In cancer, SOD2 is reduced and with it its anti-oxidant role, contributing to a number of cancer cell properties, including altering key enzyme activities by oxidizing sulfhydryl groups, changing the oxidation-reduction state of various metal ions, damaging key subcellular structures, breaking the DNA chain, and potential chromosomal and mitochondrial damage [77]. According to one study, the expression of SOD2 expression in breast cancer does not correlate with proliferation or apoptosis [78]. The expression of SOD2 is higher in non-neoplastic breast epithelial cells and in situ carcinomas than in invasive breast cancer cells, suggesting that SOD2 may act as a tumor suppressor during the development of an invasive breast carcinoma phenotype [78]. Meanwhile, SOD2 upregulates maspin, a protease inhibitor blocking tumor cell motility and invasion, supports that the downregulation of SOD2 may increase motility of cells and result in an increased invasive potential in breast cancer [54]. Recently, gene expression of SOD2 was also seen downregulated in breast cancer ER- MDA-MB-231 co-cultured cells with nodal fibroblasts, in which the viability and migration of MDA-MB-231 was enhanced [79]. Figure 4 also shows a decrease in SOD2 (spot 9) expression in the ER- samples relative to the ER+ samples.
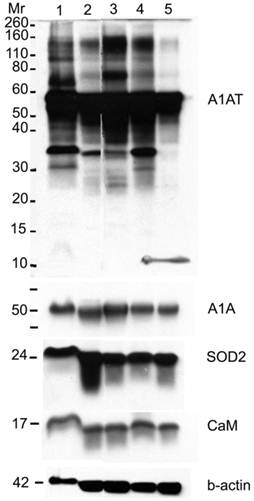
A1AT, A1A, SOD2, and CaM proteins were probed for by means of Western blot to verify their presence in a normal breast and different stages of cancer tissue samples (Figure 5). Cancer tissues that are ER- and PR- (progesterone receptor negative) are those cancers that are not affected by anti-hormonal drugs and were proven to be more aggressive than ER+ PR+ breast cancer [4-6, 80]. A1AT shows several bands per sample, in which some show differential expression among the different samples of breast cancer. A1A, SOD2, and CaM were expressed in all the wells with no significant difference in expression between the cancer stages (Figure 7), yet their expression in the normal was higher than the ER+ PR- cancer sample (Figure 5, wells 1 and 4, and Table 2).
A1AT, A1A, SOD2, and CaM protein's relative intensity ratio of cancer to their corresponding breast normal tissues.
| Ratio of Cancer to its Corresponding Normal Sample (fold) | A1AT | A1A | SOD2 | CaM |
|---|---|---|---|---|
| ER+PR+/N | 0.42-0.6 | 0.91 | 0.46-0.6 | 0.32-0.43 |
| ER+PR-/N | 0.21-0.5 | 0.5-0.67 | 0.18-0.6 | 0.24-0.5 |
| ER-PR-/N | 0.7 | 0.7 | 0.46 | 0.52 |
The protein relative intensity was produced by Adobe Photoshop 6.0 by comparing the absolute intensity to B-actin from all Western blot trials. The absolute intensity for each protein in each sample was calculated by multiplying the mean and pixels of the band. N represents the normal breast sample provided with the breast cancer tissue sample from the same donor. ER+PR+ represents estrogen receptor and progesterone receptor positive breast cancer tissue sample.
Western blot for A1AT, A1A, SOD2, and CaM in: normal (well 1), ER+ PR+ (well 2), ER+ PR weakly + (well 3), ER+ PR- (well 4) (whose corresponding normal is in well 1), and ER- PR- (well 5) breast tissue samples. B-actin was used as a loading control. 25 µg of each sample was loaded onto a 10% SDS-PAGE gel. Novex® Sharp Pre-stained Protein Standard (Invitrogen) was used as the molecular weight marker (Mr).
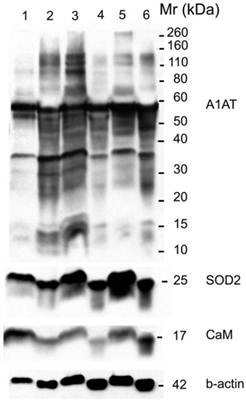
A1AT, SOD2, and CaM were also probed for to verify any differential expression within ER+ PR+, ER+ PR-, and ER- PR- breast cancer versus their corresponding normal breast tissues (Figure 6). SOD2 shows a significant decrease (p <0.01 and p <0.05) in ER+PR+ and ER+PR- cancer samples compared with their normal tissue, and CaM shows a similar decrease (p =0.004 and p =0.1) in the same comparison (Table 2), but none of them exhibited significant difference among the different cancer samples (Figures 6 and 7). The t-test p-value is calculated for each normalized value and represents a confidence measure on how reproducible is an expression level measurement. The student t-test compared the first data set with the second data set, with one-tailed distribution and paired type specifications. SOD2's results are supported by another study that showed SOD2 expression was higher in normal versus cancer samples [78]. A1AT shows several bands per sample, in which some expressions vary among the different breast cancer samples and between the normal and their cancer samples (Figure 6). A decrease was observed in the A1AT between the normal of ER+ PR+ and ER+ PR- versus their cancer samples (Table 2, p <0.05), but no significant difference between the cancer samples (Figure 7). A1AT deficiency is previously associated with higher risk of malignant lymphoma and cancers of the liver, bladder, gallbladder, and lung [81]. In a recent study, A1AT showed higher expression in human breast tumor tissues relative to normal breast tissues from healthy donors [64]. But comparison in this work between cancer and normal breast tissues from the same donor showed a decrease in the A1AT expression level in the cancer samples (Table 2).
Western blot for A1AT, SOD2, and CaM in: normal (well 1), ER+ PR+ breast cancer tissue (well 2) whose corresponding normal is in well 1, normal (well 3), ER+ PR- breast cancer tissue (well 4) whose corresponding normal is in well 3, normal (well 5), and ER- PR- breast cancer tissue (well 6) whose corresponding normal is in well 5. B-actin was used as a loading control. 25 µg of each sample was loaded on a 10% SDS-PAGE gel. Same molecular weight marker used in Figure 5.
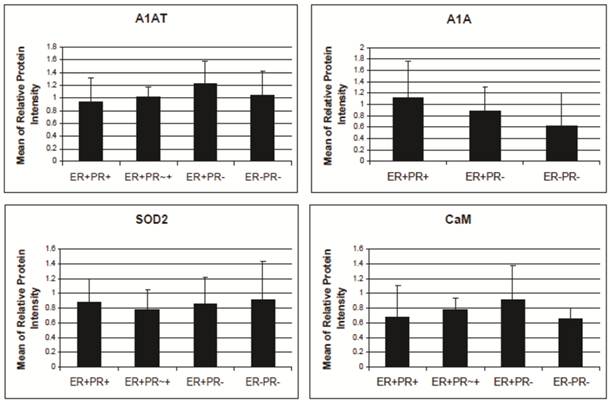
A1AT, A1A, SOD2, and CaM's expression level in breast cancer tissues. There is no significant difference among the expression level of any of these proteins in any of the presented cancer samples. The relative protein intensity was produced by Adobe Photoshop 6.0 by comparing their absolute intensity to B-actins from all Western blot trials. The absolute intensity for each protein in each sample was calculated by multiplying the mean and pixels of the band. Error bars represent a 95% confidence interval calculated from the standard deviation of each sample. ER+PR+ represents estrogen receptor and progesterone receptor positive breast cancer tissue sample. ER+PR~+ represents a breast cancer tissue sample with ER+ and PR weakly positive.
Glycosylation difference in different stages of cancer
To verify if any difference in bands is due to a variation in the glycosylation pattern, more Western blots were performed probing for A1AT, A1A, SOD2, and CaM (Figure 8). Glycoproteins in ER+ PR+, ER+ PR-, and ER- PR- breast cancer tissue samples were enriched with a WGA glycoprotein isolation kit (Figure 8, wells 1, 2, and 3). WGA lectins target on N-acetyl glucosamine and sialic acid. To verify the type of glycosylation linkage, the ER- PR- breast tissue sample was divided into: (1) a treated with PNGase F to N-deglycosylate it; and (2) untreated sample used as an ER- PR- control. Those prepared samples also underwent glycoprotein enrichment and were loaded in wells 4 and 5. Western blots were performed after enrichment (Figure 8). The flow-through during the glycoprotein enrichment was loaded in wells 6 to 10. No probed proteins were observed in the negative control (well 11), bovine serum albumin (see Fig. 8A-8H).
Western blot to verify any difference in bands is due to a glycosylation difference. Western blots for A1AT, A1A, SOD2, and CaM were performed with 10% SDS-PAGE gel. With a glycoprotein isolation kit WGA, 25 µg of accumulated glycoproteins from the breast cancer tissue samples ER+ PR+ (well 1), ER+ PR- (well 2), ER- PR- (well 3), ER- PR- N-deglycosylated (well 4) (same ER- PR- sample but N-deglycosylated), and ER- PR- control (well 5) (same ER- PR- sample used treated with water instead of PNGase F enzyme) were loaded onto the Western blot. Their flow-through, containing the rest of the proteins in each sample other than the WGA lectin-attached glycoproteins, was loaded onto the same Western blot in wells 6 to 10. As a negative control, bovine serum albumin was loaded in well 11. Presented is the same Western blot at low and high exposure time to the nitrocellulose membrane for A1AT (A) & (B), A1A (C) & (D), and SOD2 (E) & (F), respectively, whereas only high nitrocellulose exposure of CaM and B-actin are presented as (G) and (H). The same molecular weight marker (kDa) was used as in Figure 5. The * in (B) points to the ~69 kDa band on its left.
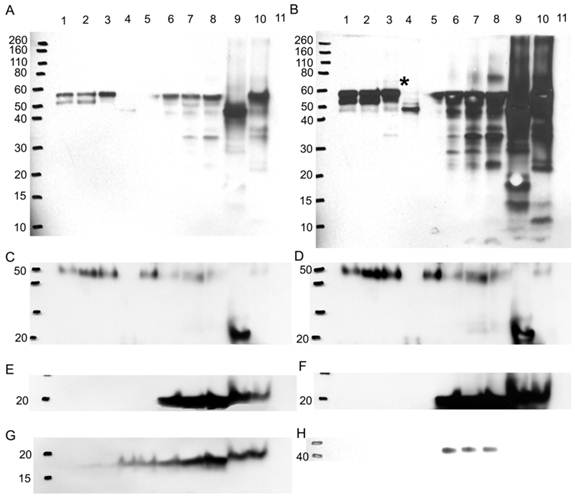
After enrichment, A1AT was observed in wells 1-3 and 5 (Fig. 8A). The band at molecular weight of ~57 kDa is full length A1AT, and 52 kDa is a degraded form. Along with results from Figures 2 and 4, this result further confirms glycosylation of A1AT. In well 4, only a band at molecular weight ~47 kDa was observed. The existence of the same band with high intensity in the flow-through (well 9) suggests that the drop of molecular weight is due to the deglycosylation. Although a faint band was not expected to be seen in well 4, presumably due to the presence of possible O-linked glycosylation (Table 1) and non-specific binding. Moreover, because WGA targets only limited glycoforms, insufficient resins, and at less than 100% efficiency, the glycosylated A1AT at molecular weight of ~52 kDa or 57 kDa was seen in wells 6-8 and 10. The lower molecular weight bands present in wells 6-10 are the result of A1AT degradation by matrix metalloproteinases (MMPs) [69-74]. Wells 1-3 show that there is a differential expression of the glycosylated bands. For instance, the ~52 kDa proteins have highest expression in well 2, less in well 1, and disappeared in well 3. This band is a result of MMP-7 or -26 cleaving off the C-terminus of A1AT causing the inactivation of A1AT's ~52 kDa N-terminus [71, 74]. MMP-26 is associated with ER tumors targeting A1AT [71] and the results from this study reported the same trend as we observed, ER+ PR+ and ER+ PR- samples (wells 1 and 2, Fig. 8A) showed the cleaved A1AT ~52 kDa band but the ER- PR- (well 3, Fig. 8A) did not. The cleaved C-terminal fragment of A1AT is not a simple degradation product of the full-length A1AT, but a functionally active fragment. In human pancreas adenocarcinoma cells, A1AT C-terminus fragments may serve as tumor-derived immunosuppressors, through the modulation of natural killer cell-mediated control of tumor growth, resulting in larger tumors and increased tendency toward metastasis [82]. A1AT C-terminus fragment was found to induce MDA-MB- 468 breast cancer cell proliferation and invasiveness [49]. In Fig. 8B, a band less than 10 kDa may be representative of the A1AT's C-terminus and was seen highest in the ER- PR- sample, well 8, compared to wells 6 and 7.
The higher molecular weight bands could be the result of a post-translational modification by adding sugar moieties to native A1AT to increase its molecular weight and ultimately affect its function. At higher exposure to the nitrocellulose (Fig. 8B), a band ~69 kDa appears in the ER- PR- sample (well 3, Fig. 8B, with * on its right) and barely in the ER+ PR- sample (well 2, Fig. 8B), but not in the ER+ PR+ sample (well 1, Fig. 8B). Because samples were boiled for 30 min in fresh sample buffer during the preparation it disrupts protein-protein interaction. Meanwhile, the molecular weight of the band is much less than the dimer of A1AT. Therefore, this band may be the result of a glycosylation. The glycosylation of A1AT may be a derived immunosuppressor or contributor to develop the primary cancer into a more aggressive/malignant stage such as ER- PR-. To understand the relationship between glycosylation of A1AT and cancer development, a further study on the sugar part needs to be performed. Since more exposure to the nitrocellulose was needed to be able to see this band, it is presumably low in abundance, and higher loading is needed to accumulate more of this band for further study.
A1A also showed that it is N-glycosylated because of the observation of lower molecular weight band after deglycosylation digestion (Fig. 8C and D, wells 4 and 9). Along with 5 possible N-linked glycosylation sites shown in Table 1, it further confirms previous conclusions from Figures 2 and 4. But A1A has no glycosylation difference even with higher exposure to the nitrocellulose (Fig. 8D). SOD2 shows no glycosylations, because no band was detected in wells 1-3 and 5, and no effect was noticed due to N-deglycosylation in well 9 (Fig. 8E and F).
CaM is glycosylated as a 17 kDa band, though faint, was seen in the glycoprotein accumulated wells 1-5, yet it proves that it is not N-glycosylated, because N-deglycosylation treatment in wells 4 and 9 did not affect the molecular weight of CaM (Fig. 8G). CaM may be glycated or O-glycosylated. The primary binding specificity sites of WGA are terminal (β-1,4)-linked N-acetyl glucosamine (GlcNAc) dimers, galactosyl (β -1,4) GlcNAc (β -1,3) repeats of large oligiosaccharides and also binds weaker to (α-2,3)- and (α-2,6)-linked terminal sialic acid residues [83-85]. Because the glycosylated band is not a result of GlcNAc or sialic acid from an N-linked sugar to CaM then for CaM to bind to the WGA resin it probably has an O-GlcNAc, yet www.cbs.dtu.dk/services/NetOGlyc/ website did not show possible O-glycosylation sites on CaM. Glycation involves the simple sugars glucose, fructose, and galactose; fructose and galactose have approximately ten times the glycation activity of glucose, the primary body fuel [86]. CaM may be glycated by glucose sugars at seven lysine residues on CaM, in which the carbonyl group of the sugar reacts with the amino group of the amino acid producing N-substituted glycosylamine and water (Maillard reaction) [87]. Further non-enzymatic reactions may change the N-glycosylamine to an advanced glycation end product. Glycation affects the function of CaM [88], for example, glycated-CaM appears to be less prone for binding calcium [89] and, therefore, CaM may be less capable to activate its enzyme targets. The N-substituted glucosamine at the lysine residues of glycated-CaM, after further reactions, may resemble N-acetyl glucosamine and therefore may attach to WGA resin. The highest expression level of the 17 kDa band was seen in the ER- PR- sample in wells 3 and 8 (Fig. 8G) when compared to the ER+ PR+ and ER+ PR- samples.
B-actin, the loading control, (Fig. 8H) is not glycosylated, as seen from the absence of bands in the glycoprotein enriched samples in wells 1-5. It showed up in the flow-through wells 6-8 but not in wells 9 and 10. For reasons not known, the boiling and solutions used in the N-deglycosylation treatment must have affected the B-actin protein.
Conclusion
This study utilized N-deglycosylation and double staining of 2-DE gels followed by LC-LTQ/FTICR-MS identification and further verification by Western blotting. A list of glycoproteins was identified and only the N-linked were verified in normal, ER+ PR+, ER+ PR-, and ER- PR- human breast cancer tissues. Several of those identified proteins play a role in breast cancer; yet only those that show a glycosylation difference, that may have affected their function and thus played a role in the progression of breast cancer, were of interest. The native form of A1AT controls excessive proteolytic activity of enzymes released by leukocytes at the site of inflammation. An imbalance between neutrophil elastase and A1AT is thought to cause tissue damage creating a tissue favorable for malignant progression [82]. The native form of A1AT thus acts like a tumor suppressor. For instance, A1AT blocks transforming growth factor (TGF) alpha that is known to stimulate proliferation [90], upregulates levels of TGF-β1[49] (a negative growth regulator of breast tumor cells) [91], decreases release level of interleukin 6 (an autocrine and paracrine growth factor for various cancers including breast cancer), and inhibits cell proliferation [49]. Matrix metalloproteinases (MMPs) regulate A1AT's activity and can cleave off the C-terminus into shorter active fragments. Studies have shown that A1AT C-terminus fragments were tumor-derived immunosuppressors that promote cancer metastasis [49, 74, 82]. A1AT was shown to be expressed higher in human breast tumor tissues when compared to normal breast tissues from healthy donors [64]; yet results from this study compared cancer and normal breast tissues from the same donor and show an overall decrease in the native A1AT expression level of the cancer samples relative to their corresponding normal tissue samples. This phenomenon could be due to both the degradation of native A1AT as previously proposed, and a post-translational modification adding carbohydrate moieties to the native A1AT, thereby increasing its molecular weight, whereas Figure 8 shows that both scenarios exist simultaneously. In breast cancer cells, a difference in an N-linked [27-28] oligosaccharide structure was frequently correlated with cancerous transformation. Another study reflected that A1AT expression was highest in the more aggressive cell line of a series of isogenic breast cancer cell lines [92]. Again these results and findings suggest that A1AT, in all its forms, plays an important role in carcinogenesis. A1AT with a glycosylation difference, that affects the function of A1AT and is recognized by an increase in native A1AT's molecular weight, was seen highest in the more aggressive ER- PR- human breast cancer sample relative to the ER+ PR+ and ER+ PR- human breast cancer samples. A1AT glycosylation sites, possible sugars, and antennary structures at each site are already determined in human cerebrospinal fluid [93] and human plasma [94], which should make it feasible to compare A1AT in ER+ and ER- breast cancer and identify the A1AT's differential sugars in the ER- samples. Further study is needed to verify if this tumor derived glycosylation difference is affecting the function of A1AT in the aggressive stage of breast cancer.
Abbreviations
2-DE, two dimensional gel electrophoresis; A1A, alpha 1 acid glycoprotein; A1AT, alpha 1 antitrypsin; ACN, acetonitrile; BCA, bicinchoninic acid; BSA, bovine serum albumin; CaM, calmodulin; CHAPS, cholamidopropyl dimethylammonio propanesulfonate hydrate; DTT, dithiothreitol; ER+D, deglycosylated estrogen receptor positive sample; H2O, water; Her-2/neu, human epidermal growth factor 2 receptor; HCl, hydrochloric acid; FTICR, Fourier transform ion cyclotron resonance; IPG, immobilized pH gradient; LC-MS/MS, liquid chromatography-tandem mass spectrometry; LTQ, linear quadrupole ion trap; MeOH, methanol; MMP, matrix metalloproteinase; PR, progesterone receptor; SOD2, superoxide dismutase [Mn] mitochondrial precursor; TBST, Tris buffer saline with Tween-20.
Supplementary Material
Supplementary Table 1Acknowledgements
This work was supported by grant BCTR0504465 from the Susan G. Komen for the Cure Breast Cancer Foundation, grants from the Florida Breast Cancer Coalition Research Foundation, the Elsa U. Pardee Foundation, and the Florida State University to Prof. Q.-X. Sang, and by NSF Division of Materials Research through DMR-0654118 and State of Florida grants to Prof. A.G. Marshall. The authors are grateful to Margaret Seavy, Steve Noblitt, Dr. Mark Druen Roycik, and Dr. Doris Terry for their excellent technical assistance. We also acknowledge the Cooperative Human Tissue Network-Midwestern division, the Ohio State University, from which we obtained the tissues for this project.
Competing Interests
The authors have declared that no competing interest exists.
References
1. Siegel R, Naishadham D, Jemal A. Cancer statistics, 2012. CA Cancer J Clin. 2012;62:10-29
2. Mandal SSaM. Growth factor receptors and apoptosis regulators: signaling pathways, prognosis, chemosensitivity and treatment outcomes of breast cancer. Breast Cancer: Basic and Clinical Research. 2009;3:47-60
3. Sahab ZJ, Semaan SM, Sang QXA. Methodology and Applications of Disease Biomarker Identifi cation in Human Serum. Biomarker Insights. 2007;2:21-43
4. Yousefi M, Mattu R, Gao CL, Man YG. Mammary ducts with and without focal myoepithelial cell layer disruptions show a different frequency of white blood cell infiltration and growth pattern: Implications for tumor progression and invasion. Appl Immunohisto M M. 2005;13:30-7
5. Man YG, Shekitka KM, Bratthauer GL, Tavassoli FA. Immunohistochemical and genetic alterations in mammary epithelial cells immediately overlying focally disrupted myoepithelial cell layers. Breast Cancer Res Treat. 2002;76:S143-S
6. Man YG, Sang QXA. The significance of focal myoepithelial cell layer disruptions in human breast tumor invasion: a paradigm shift from the "protease-centered" hypothesis. Expl Cell Res. 2004;301:103-18
7. Humphries MJ, Matsumoto K, White SL, Olden K. Oligosaccharide Modification by Swainsonine Treatment Inhibits Pulmonary Colonization by B16-F10 Murine Melanoma-Cells. Proc. Natl. Acad. Sci. U. S. A. 1986;83:1752-6
8. Varki A. Biological Roles of Oligosaccharides - All of the Theories Are Correct. Glycobiology. 1993;3:97-130
9. Helenius A, Aebi M. Intracellular functions of N-linked glycans. Science. 2001;291:2364-9
10. Isaji T, Gu JG, Nishiuchi R, Zhao YY, Takahashi M, Miyoshi E. et al. Introduction of bisecting GlcNAc into integrin alpha(5)beta(1) reduces ligand binding and down-regulates cell adhesion and cell migration. J. Biol. Chem. 2004;279:19747-54
11. Apweiler R, Hermjakob H, Sharon N. On the frequency of protein glycosylation, as deduced from analysis of the SWISS-PROT database. Bba-Gen Subjects. 1999;1473:4-8
12. Nair KS, Jaleel A, Asmann YW, Short KR, Raghavakaimal S. Proteomic research: potential opportunities for clinical and physiological investigators. Am J Physiol-Endoc M. 2004;286:E863-E74
13. Petrescu AJ, Milac AL, Petrescu SM, Dwek RA, Wormald MR. Statistical analysis of the protein environment of N-glycosylation sites: implications for occupancy, structure, and folding. Glycobiology. 2004;14:103-14
14. Ben-Dor S, Esterman N, Rubin E, Sharon N. Biases and complex patterns in the residues flanking protein N-glycosylation sites. Glycobiology. 2004;14:95-101
15. Spiro RG, Bhoyroo VD. Structure of O-Glycosidically Linked Carbohydrate Units of Fetuin. J. Biol. Chem. 1974;249:5704-17
16. Collier E, Gorden P. O-Linked Oligosaccharides on Insulin-Receptor. Diabetes. 1991;40:197-203
17. Fanger MW, Smyth DG. Oligosaccharide Units of Rabbit Immunoglobulin-G - Multiple Carbohydrate Attachment Sites. Biochem J. 1972;127:757
18. Nayak BR, Spiro RG. Localization and Structure of the Asparagine-Linked Oligosaccharides of Type-Iv Collagen from Glomerular-Basement-Membrane and Lens Capsule. J. Biol. Chem. 1991;266:13978-87
19. PerezVilar J, Eckhardt AE, Hill RL. Porcine submaxillary mucin forms disulfide-bonded dimers between its carboxyl-terminal domains. J. Biol. Chem. 1996;271:9845-50
20. Parthasarathy N, Spiro RG. Isolation and Characterization of the Heparan-Sulfate Proteoglycan of the Bovine Glomerular Basement-Membrane. J. Biol. Chem. 1984;259:2749-55
21. Brockhausen I. Pathways of O-glycan biosynthesis in cancer cells. Bba-Gen Subjects. 1999;1473:67-95
22. Fenlon S, Ellis IO, Bell J, Todd JH, Elston CW, Blamey RW. Helix-Pomatia and Ulex Europeus Lectin Binding in Human-Breast Carcinoma. J. Pathol. 1987;152:169-76
23. Leathem AJ, Brooks SA. Predictive Value of Lectin Binding on Breast-Cancer Recurrence and Survival. Lancet. 1987;1:1054-6
24. Springer GF. Tn Epitope (N-Acetyl-D-Galactosamine-Alpha-O-Serine Threonine) Density in Primary Breast-Carcinoma - a Functional Predictor of Aggressiveness. Mol. Immunol. 1989;26:1-5
25. Lloyd KO, Burchell J, Kudryashov V, Yin BWT, TaylorPapadimitriou J. Comparison of O-linked carbohydrate chains in MUC-1 mucin from normal breast epithelial cell lines and breast carcinoma cell lines - Demonstration of simpler and fewer glycan chains in tumor cells. J. Biol. Chem. 1996;271:33325-34
26. Muller S, Alving K, Peter-Katalinic J, Zachara N, Gooley AA, Hanisch FG. High density O-glycosylation on tandem repeat peptide from secretory MUC1 of T47D breast cancer cells. J. Biol. Chem. 1999;274:18165-72
27. Dennis JW, Laferte S. Oncodevelopmental Expression of -Glcnac-Beta-1-6man-Alpha-1-6man-Beta-1-Branched Asparagine-Linked Oligosaccharides in Murine Tissues and Human-Breast Carcinomas. Cancer Res. 1989;49:945-50
28. Fernandes B, Sagman U, Auger M, Demetrio M, Dennis JW. Beta-1-6 Branched Oligosaccharides as a Marker of Tumor Progression in Human Breast and Colon Neoplasia. Cancer Res. 1991;51:718-23
29. Walsh MD, Mcguckin MA, Devine PL, Hohn BG, Wright RG. Expression of Muc2 Epithelial Mucin in Breast-Carcinoma. J. Clin. Pathol. 1993;46:922-5
30. Girling A, Bartkova J, Burchell J, Gendler S, Gillett C, Taylorpapadimitriou J. A Core Protein Epitope of the Polymorphic Epithelial Mucin Detected by the Monoclonal-Antibody Sm-3 Is Selectively Exposed in a Range of Primary Carcinomas. Int J Cancer. 1989;43:1072-6
31. Rughetti A, Turchi V, Ghetti CA, Scambia G, Panici PB, Roncucci G. et al. Human B-Cell Immune-Response to the Polymorphic Epithelial Mucin. Cancer Res. 1993;53:2457-9
32. Kotera Y, Fontenot JD, Pecher G, Metzgar RS, Finn OJ. Humoral Immunity against a Tandem Repeat Epitope of Human Mucin Muc-1 in Sera from Breast, Pancreatic, and Colon-Cancer Patients. Cancer Res. 1994;54:2856-60
33. Semaan SM, Sang QX. Prefractionation enhances loading capacity and identification of basic proteins from human breast cancer tissues. Anal Biochem. 2011;411:80-7
34. Towbin H, Staehelin T, Gordon J. Electrophoretic Transfer of Proteins from Polyacrylamide Gels to Nitrocellulose Sheets - Procedure and Some Applications. Proc. Natl. Acad. Sci. U. S. A. 1979;76:4350-4
35. Sennepin AD, Charpentier S, Normand T, Sarre C, Legrand A, Mollet LM. Multiple reprobing of Western blots after inactivation of peroxidase activity by its substrate, hydrogen peroxide. Anal Biochem. 2009;393:129-31
36. Shevchenko A, Tomas H, Havlis J, Olsen JV, Mann M. In-gel digestion for mass spectrometric characterization of proteins and proteomes. Nat Protoc. 2006;1:2856-60
37. Wang X, Tipton JD, Emmett MR, Marshall AG. Sites and extent of selenomethionine incorporation into recombinant Cas6 protein by top-down and bottom-up proteomics with 14.5 T Fourier transform ion cyclotron resonance mass spectrometry. Rapid Commun Mass Spectrom. 2010;24:2386-92
38. Marshall AG, Hendrickson CL, Jackson GS. Fourier transform ion cyclotron resonance mass spectrometry: a primer. Mass Spectrom Rev. 1998;17:1-35
39. Li W, Hendrickson CL, Emmett MR, Marshall AG. Identification of intact proteins in mixtures by alternated capillary liquid chromatography electrospray ionization and LC ESI infrared multiphoton dissociation Fourier transform ion cyclotron resonance mass spectrometry. AnaCh. 1999;71:4397-402
40. Yi K, Wang X, Emmett MR, Marshall AG, Stewart M, Roberts TM. Dephosphorylation of major sperm protein (MSP) fiber protein 3 by protein phosphatase 2A during cell body retraction in the MSP-based amoeboid motility of Ascaris sperm. Mol Biol Cell. 2009;20:3200-8
41. Schaub TM, Hendrickson CL, Horning S, Quinn JP, Senko MW, Marshall AG. High-performance mass spectrometry: Fourier transform ion cyclotron resonance at 14.5 tesla. AnaCh. 2008;80:3985-90
42. Wang X, Stewart PA, Cao Q, Sang QX, Chung LW, Emmett MR. et al. Characterization of the phosphoproteome in androgen-repressed human prostate cancer cells by fourier transform ion cyclotron resonance mass spectrometry. J Proteome Res. 2011;10:3920-8
43. Keller A, Nesvizhskii AI, Kolker E, Aebersold R. Empirical statistical model to estimate the accuracy of peptide identifications made by MS/MS and database search. Anal Chem. 2002;74:5383-92
44. Nesvizhskii AI, Keller A, Kolker E, Aebersold R. A statistical model for identifying proteins by tandem mass spectrometry. Anal Chem. 2003;75:4646-58
45. Sahab ZJ, Man YG, Semaan SM, Newcomer RG, Byers SW, Sang QX. Alteration in protein expression in estrogen receptor alpha-negative human breast cancer tissues indicates a malignant and metastatic phenotype. Clin Exp Metastasis. 2010;27:493-503
46. Julenius K, Molgaard A, Gupta R, Brunak S. Prediction, conservation analysis, and structural characterization of mammalian mucin-type O-glycosylation sites. Glycobiology. 2005;15:153-64
47. Gupta R, Jung E. et al. Prediction of N-glycosylation sites in human proteins. 2004.
48. Roberts JG, Keyser JW, Baum M. Serum Alpha-1-Acid Glycoprotein as an Index of Dissemination in Breast-Cancer. Br. J. Surg. 1975;62:816-9
49. Zelvyte I, Lindgren S, Janciauskiene S. Multiple effects of alpha1-antitrypsin on breast carcinoma MDA-MB 468 cell growth and invasiveness. Eur J Cancer Prev. 2003;12:117-24
50. Krishnaraju K, Murugesan K, Vij U, Kapur BML, Farooq A. Calmodulin Levels in Estrogen-Receptor Positive and Negative Human Breast-Tumors. Brit J Cancer. 1991;63:346-7
51. Nair S, Hande MP, Lim LH. Annexin-1 protects MCF7 breast cancer cells against heat-induced growth arrest and DNA damage. Cancer Lett. 2010;294:111-7
52. Wang X, He S, Sun JM, Delcuve GP, Davie JR. Selective association of peroxiredoxin 1 with genomic DNA and COX-2 upstream promoter elements in estrogen receptor negative breast cancer cells. Mol Biol Cell. 2010;21:2987-95
53. Chen Z, Gu J. Immunoglobulin G expression in carcinomas and cancer cell lines. FASEB J. 2007;21:2931-8
54. Li JJ, Colburn NH, Oberley LW. Maspin gene expression in tumor suppression induced by overexpressing manganese-containing superoxide dismutase cDNA in human breast cancer cells. Carcinogenesis. 1998;19:833-9
55. Routledge PA. Clinical relevance of alpha 1 acid glycoprotein in health and disease. Prog Clin Biol Res. 1989;300:185-98
56. Cheresh DA, Haynes DH, Distasio JA. Interaction of an Acute Phase Reactant, Alpha-1-Acid Glycoprotein (Orosomucoid), with the Lymphoid-Cell Surface - a Model for Non-Specific Immune Suppression. Immunology. 1984;51:541-8
57. Urien S, Bree F, Testa B, Tillement JP. Ph-Dependency of Basic Ligand-Binding to Alpha-1-Acid Glycoprotein (Orosomucoid). Biochemical Journal. 1991;280:277-80
58. Colombo S, Buclin T, Decosterd LA, Telenti A, Furrer H, Lee BL. et al. Orosomucoid (alpha(1)-acid glycoprotein) plasma concentration and genetic variants: Effects on human immunodeficiency virus protease inhibitor clearance and cellular accumulation. Clin. Pharmacol. Ther. 2006;80:307-18
59. Gahmberg CG, Andersson LC. Leukocyte Surface Origin of Human Alpha1-Acid Glycoprotein (Orosomucoid). J. Exp. Med. 1978;148:507-21
60. Schmid K, Nimberg RB, Kimura A, Yamaguchi H, Binette JP. The carbohydrate units of human plasma a1-Acid glycoprotein. BBA- Prot Struc. 1977;492:297-302
61. Duche JC, Urien S, Simon N, Malaurie E, Monnet I, Barre J. Expression of the genetic variants of human alpha-1-acid glycoprotein in cancer. Clin Biochem. 2000;33:197-202
62. Dubois RM, Bernaudin JF, Paakko P, Hubbard R, Takahashi H, Ferrans V. et al. Human Neutrophils Express the Alpha-1-Antitrypsin Gene and Produce Alpha-1-Antitrypsin. Blood. 1991;77:2724-30
63. Sawaya R, Zuccarello M, Highsmith R. Alpha-1-antitrypsin in human brain tumors. J Neurosurg. 1987;67:258-62
64. Hamrita B, Chahed K, Trimeche M, Guillier CL, Hammann P, Chaieb A. et al. Proteomics-based identification of alpha 1-antitrypsin and haptoglobin precursors as novel serum markers in infiltrating ductal breast carcinomas. Clin Chim Acta. 2009;404:111-8
65. Molmenti EP, Ziambaras T, Perlmutter DH. Evidence for an Acute-Phase Response in Human Intestinal Epithelial-Cells. J Biol Chem. 1993;268:14116-24
66. Nash DR, Mclarty JW, Fortson NG. Pretreatment, Prediagnosis Immunoglobulin, and Alpha-1-Antitrypsin Levels in Patients with Bronchial-Carcinoma. J Natl Cancer I. 1980;64:721-4
67. Sawaya R, Zuccarello M, Highsmith R. Alpha-1-Antitrypsin in Human-Brain Tumors. J Neurosurg. 1987;67:258-62
68. Zelvyte I, Wallmark A, Piitulainen E, Westin U, Janciauskiene S. Increased plasma levels of serine proteinase inhibitors in lung cancer patients. Anticancer Res. 2004;24:241-7
69. Pei DQ, Majmudar G, Weiss SJ. Hydrolytic Inactivation of a Breast-Carcinoma Cell-Derived Serpin by Human Stromelysin-3. J. Biol. Chem. 1994;269:25849-55
70. Desrochers PE, Jeffrey JJ, Weiss SJ. Interstitial Collagenase (Matrix Metalloproteinase-1) Expresses Serpinase Activity. J Clin Invest. 1991;87:2258-65
71. Li W, Savinov AY, Rozanov DV, Golubkov VS, Hedayat H, Postnova TI. et al. Matrix metalloproteinase-26 is associated with estrogen-dependent malignancies and targets alpha 1-antitrypsin serpin. Cancer Res. 2004;64:8657-65
72. Sires UI, Murphy G, Baragi VM, Fliszar CJ, Welgus HG, Senior RM. Matrilysin Is Much More Efficient Than Other Matrix Metalloproteinases in the Proteolytic Inactivation of Alpha(1)-Antitrypsin. Biochem Bioph Res Co. 1994;204:613-20
73. Zhang Z, Winyard PG, Chidwick K, Murphy G, Wardell M, Carrell RW. et al. Proteolysis of Human Native and Oxidized Alpha-1-Proteinase Inhibitor by Matrilysin and Stromelysin. Bba-Gen Subjects. 1994;1199:224-8
74. Zhou JM, Trock B, Tsangaris TN, Friedman NB, Shapiro D, Brotzman M. et al. A unique proteolytic fragment of alpha1-antitrypsin is elevated in ductal fluid of breast cancer patient. Breast Cancer Res Tr. 2010;123:73-86
75. Gallo D, Jacquot Y, Laurent G, Leclercq G. Calmodulin, a regulatory partner of the estrogen receptor alpha in breast cancer cells. Mol Cell Endocrinol. 2008;291:20-6
76. Coticchia CM, Revankar CM, Deb TB, Dickson RB, Johnson MD. Calmodulin modulates Akt activity in human breast cancer cell lines. Breast Cancer Res Tr. 2009;115:545-60
77. Oberley LW, Buettner GR. Role of superoxide dismutase in cancer: a review. Cancer Res. 1979;39:1141-9
78. Soini Y, Vakkala M, Kahlos K, Paakko P, Kinnula V. MnSOD expression is less frequent in tumour cells of invasive breast carcinomas than in in situ carcinomas or non-neoplastic breast epithelial cells. J Pathol. 2001;195:156-62
79. Santos RP, Benvenuti TT, Honda ST, Del Valle PR, Katayama ML, Brentani HP. et al. Influence of the interaction between nodal fibroblast and breast cancer cells on gene expression. Tumour Biol. 2010 Epub ahead of print
80. Andre F, Pusztai L. Molecular classification of breast cancer: implications for selection of adjuvant chemotherapy. Nat Clin Pract Oncol. 2006;3:621-32
81. Sun Z, Yang P. Role of imbalance between neutrophil elastase and alpha 1-antitrypsin in cancer development and progression. Lancet Oncol. 2004;5:182-90
82. Kataoka H, Uchino H, Iwamura T, Seiki M, Nabeshima K, Koono M. Enhanced tumor growth and invasiveness in vivo by a carboxyl-terminal fragment of alpha1-proteinase inhibitor generated by matrix metalloproteinases: a possible modulatory role in natural killer cytotoxicity. Am J Pathol. 1999;154:457-68
83. Bhavanandan VP, Katlic AW. The interaction of wheat germ agglutinin with sialoglycoproteins. The role of sialic acid. J Biol Chem. 1979;254:4000-8
84. Allen AK, Neuberger A, Sharon N. The purification, composition and specificity of wheat-germ agglutinin. Biochem J. 1973;131:155-62
85. Goldstein IJ, Hammarstrom S, Sundblad G. Precipitation and carbohydrate-binding specificity studies on wheat germ agglutinin. Biochim Biophys Acta. 1975;405:53-61
86. McPherson JD, Shilton BH, Walton DJ. Role of fructose in glycation and cross-linking of proteins. Biochemistry-Us. 1988;27:1901-7
87. Shaw S. et al. Non-specific binding of lysine-glucose-derived Maillard products to macrophages outweighs specific receptor-mediated interactions. Food Chemistry. 1995;52:399-404
88. Nicolau J, de Souza DN, Carrilho M. Increased glycated calmodulin in the submandibular salivary glands of streptozotocin-induced diabetic rats. Cell Biochem Funct. 2009;27:193-8
89. Kowluru RA, Heidorn DB, Edmondson SP, Bitensky MW, Kowluru A, Downer NW. et al. Glycation of calmodulin: chemistry and structural and functional consequences. Biochemistry-Us. 1989;28:2220-8
90. Yavelow J, Tuccillo A, Kadner SS, Katz J, Finlay TH. Alpha 1-antitrypsin blocks the release of transforming growth factor-alpha from MCF-7 human breast cancer cells. J Clin Endocrinol Metab. 1997;82:745-52
91. Valverius EM, Walker-Jones D, Bates SE, Stampfer MR, Clark R, McCormick F. et al. Production of and responsiveness to transforming growth factor-beta in normal and oncogene-transformed human mammary epithelial cells. Cancer Res. 1989;49:6269-74
92. Mbeunkui F, Metge BJ, Shevde LA, Pannell LK. Identification of differentially secreted biomarkers using LC-MS/MS in isogenic cell lines representing a progression of breast cancer. J Proteome Res. 2007;6:2993-3002
93. Hakansson K, Emmett MR, Marshall AG, Davidsson P, Nilsson CL. Structural analysis of 2D-gel-separated glycoproteins from human cerebrospinal fluid by tandem high-resolution mass spectrometry. J Proteome Res. 2003;2:581-8
94. Kolarich D, Weber A, Turecek PL, Schwarz HP, Altmann F. Comprehensive glyco-proteomic analysis of human alpha1-antitrypsin and its charge isoforms. Proteomics. 2006;6:3369-80
Author contact
![]() Corresponding author: Tel: +1-850-644-8683. Fax: +1-850-644-8281. Email: qxsangfsu.edu. Room 3501, Chemical Sciences Laboratory Building, 102 Varsity Way, Florida State University, Tallahassee, Florida 32306-4390, U.S.A.
Corresponding author: Tel: +1-850-644-8683. Fax: +1-850-644-8281. Email: qxsangfsu.edu. Room 3501, Chemical Sciences Laboratory Building, 102 Varsity Way, Florida State University, Tallahassee, Florida 32306-4390, U.S.A.