Impact Factor ISSN: 1837-9664

 Global reach, higher impact
J Cancer 2013; 4(8):626-634. doi:10.7150/jca.6990 This issue Cite
Research Paper
Nuclear Nano-architecture Markers of Gastric Cardia and Upper Squamous Esophagus Detect Esophageal Cancer “Field Effect”
Kenneth E. Fasanella1, Rajan K. Bista2, Kevin Staton2, Sumera Rizvi1, Shikhar Uttam2, Chengquan Zhao3, Antonia Sepulveda4, Randall E. Brand1, Kevin McGrath1, Yang Liu1,2,5 ![]()
1. Department of Medicine, Division of Gastroenterology, Hepatology and Nutrition, University of Pittsburgh, Pittsburgh, Pennsylvania, USA;
2. Biomedical Optical Imaging Laboratory (BOIL), Departments of Medicine and Bioengineering, University of Pittsburgh, Pittsburgh, Pennsylvania, USA;
3. Department of Pathology, Magee-Womens Hospital of University of Pittsburgh Medical Center Pittsburgh, Pennsylvania, USA;
4. Division of Gastrointestinal Pathology, Department of Pathology & Cell Biology, Columbia University, New York, New York, USA;
5. University of Pittsburgh Cancer Institute, Pittsburgh, Pennsylvania, USA.
Received 2013-6-24; Accepted 2013-8-7; Published 2013-9-10
Abstract
Background: Barrett's esophagus (BE) affects up to 12 million Americans and confers an increased risk for development of esophageal adenocarcinoma (EAC). EAC is often fatal unless detected early. Given the high prevalence, high cost of surveillance and relatively low risk of most affected individuals, identification of high-risk patients for additional scrutiny, regular surveillance, or ablative therapy is crucial. The exploration of “field effect” by probing uninvolved esophageal mucosa to predict the risk of EAC has the potential as an improved surveillance and prevention strategy. In this study, we evaluate the ability of nuclear nano-architecture markers from normal squamous esophagus and gastric cardia to detect the “field effect” of esophageal dysplasia and EAC, and their response to endoscopic therapy.
Methods: Patients with normal esophagus, gastroesophageal reflux, BE and EAC were eligible for enrollment. We performed endoscopic cytology brushings of the gastric cardia, ~1-2 cm below the gastroesophageal junction, and of the normal squamous esophageal mucosa at ~20 cm from the incisors and standard cytology slides were made using Thinprep method. Optical analysis was performed on the cell nuclei of cytologically normal-appearing epithelial cells.
Results: The study cohort consisted of 128 patients. The nuclear nano-architecture markers detected the presence of esophageal dysplasia and EAC with statistical significance. The field effect does not exhibit a spatial dependence. These markers reverted toward normal in response to endoscopic therapy.
Conclusions: Optical analysis of gastric cardia and upper squamous esophagus represents a potentially viable method to improve risk stratification and ease of surveillance of patients with Barrett's esophagus and to monitor the efficacy of ablative therapy.
Keywords: nuclear architecture, nanoscale, esophagus, dysplasia, field effect.
INTRODUCTION
Esophageal adenocarcinoma (EAC) is often fatal, with a dismal 5-year survival rate of 13% for advanced cancer. If cancer is detected at an early stage, however, the 5-year survival can be as high as 83-90% [1]. Thus, early detection and regular surveillance in high-risk patients is crucial. Critical in this detection is the initial identification of Barrett's esophagus (BE), a premalignant condition affecting the esophagus which is the only known precursor of EAC. Given that BE affects up to 12 million Americans [2, 3], endoscopic screening and surveillance of individuals at risk has major economic implications. Current guidelines recommend that patients with BE undergo endoscopic surveillance every 3 to 5 years in the absence of dysplasia, and more often if dysplasia is identified. The standard surveillance protocol includes an upper endoscopy and intensive, four-quadrant random biopsies every 1-2 cm along the entire length of Barrett's mucosa followed by pathological examination to identify dysplasia or adenocarcinoma. Such an invasive approach requires extensive procedure time and expense, and is still associated with a significant false-negative rate. As only ~1 case out of 860 patient-years progress from BE to EAC [4], surveillance of all of the affected BE patients with such a protocol is not cost-effective or practical [5]. More reliable and cost-effective methods of identifying high risk patients are urgently needed.
The exploration of “field effect” by probing the uninvolved, normal-appearing mucosa to predict the risk of esophageal dysplasia and EAC has the potential as an improved surveillance and prevention strategy. The gastric cardia and upper squamous esophageal mucosa may serve as alternative locations to assess the state of the cancer field in esophageal dysplasia and neoplasia, as both sites are easily accessible endoscopically and do not interfere with biopsies. Several biomarkers have been reported to detect the “field effect” of Barrett's-associated EAC, such as gene expression signatures [6], epigenetic changes [7] and metabolic profiling [8]. On the other hand, the nanoscale structural properties (also known as nano-architecture or nano-morphology) of the cell or cell nucleus, as a manifestation of complex molecular changes [9-11], have emerged as a new promising class of “biomarker” to identify pre-cancerous changes [12, 13]. It was reported that cellular nano-architectural changes early in carcinogenesis can precede microscopically detectable cytological abnormalities [14, 15]. The nanoscale structural properties have also shown promise in detecting the “field effect” of several types of cancers, such as breast [16], colorectal [17-19], lung [20] and pancreatic [21].
In this study, we evaluate the ability of nano-architecture markers of cell nucleus from epithelial cells obtained by cytology brushings from both normal squamous esophageal mucosa and gastric cardia, to detect the “field effect” of esophageal dysplasia and EAC. These nano-architecture markers were derived from a recently developed novel optical microscopy technique - Spatial-domain Low-coherence Quantitative Phase Microscopy (SL-QPM) - capable of detecting structural changes in the cell nucleus at a sensitivity of 1 nm [11, 15, 16, 18, 22-25] and can be used to analyze the standard cytology and histology specimens. Further, we also evaluate how these nuclear nano-architecture markers change in response to endoscopic therapy.
MATERIALS AND METHODS
Human Specimens
The study was performed with the approval of the institutional review board at the University of Pittsburgh. Patients undergoing scheduled elective upper endoscopy or endoscopic ultrasound to evaluate gastroesophageal reflux disease (GERD), Barrett's or EAC at University of Pittsburgh Medical Center Presbyterian Shadyside Hospital (tertiary care center) were recruited to this study. Patients included those with normal esophageal mucosa (squamous), GERD, intestinal metaplasia, low-grade dysplasia (LGD), high-grade dysplasia (HGD) and EAC.
Representative epithelial cells were obtained via endoscopic cytology brushings from both the gastric cardia located at ~1-2 cm below the gastroesophageal (GE) junction and normal squamous mucosa at ~20 cm from incisors. The cells were fixed with Cytolyt® (Hologic Inc) and subsequently prepared with a Thinprep® processor (Hologic Inc) within 48 hours after the sample acquisition. The cells were then stained using the standard Papanicolaou staining protocol for non-gynecological cytology. All the cytology slides were reviewed by cytopathologist (CZ) blindly. Optical analysis was done by observers blinded to endoscopic and pathological diagnosis. The instrument was operated by a trained research specialist (KS).
Spatial-domain Low-coherence Quantitative Phase Microscopy (SL-QPM)
A detailed description of SL-QPM instrument and data analysis have been reported in detail elsewhere [11, 15, 18]. The instrument records a reflectance-mode scattering intensity cube I(x,y,k), where x and y represent the spatial position of each image pixel and k is the wavenumber. The transmission-mode intensity image is also recorded to document a conventional cytology image. The nanoscale information is derived from the common-path interferometry configuration inherent in the original cytology slide itself [11, 15]. The reflected light from glass/cell interface serves as a reference wave and the backscattered light from the cell on the cytology slide serves as the sample waves. This configuration inherent in the glass slide eliminates the multiple noise sources of traditional interferometry, achieving a high stability of ~1 nm [11, 15, 24].
Optical Path Length (OPL) Map
We used SL-QPM to obtain the two-dimensional spatial distribution optical path length map (OPL map) of the cell nucleus, which is subsequently used to quantify the nanoscale nuclear architecture properties [15]. The reflectance spectrum I(x,y,k) from each pixel (x,y) is first normalized by the spectral profile of the optical system to account for the wavelength dependent response of the light source and optical components. After taking the Fourier transform of the collected signal I(x,y,k), the OPL at a fixed optical path length of interest is obtained using the following equation:
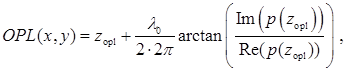
where λ0 is the source central wavelength (λ0 = 550 nm), zopl is the fixed optical depth location, and Im and Re denote the imaginary and real parts of the complex value p(zopl) respectively. Note that the factor of 2 accounts for the double OPL due to the reflection configuration. As a result, we obtain a two-dimensional spatial distribution of nanoscale optical path length (i.e., OPL map).
Quantitative Analysis of OPL Map
To quantify the nano-architectural properties of the cell nucleus, we calculated three statistical texture descriptors from the OPL map OPL(x,y) for each cell nucleus: standard deviation of OPL σOPL, entropy EOPL, and uniformity UOPL [26]. The standard deviation σOPL of the OPL map measures the spread of the OPL values at different (x, y) locations around the mean, and therefore, can be thought of as a measure of the structural heterogeneity. For nucleus with high heterogeneity, the standard deviation value would be large. The entropy EOPL, on the other hand, measures the distribution of the structural heterogeneity of the OPL map. To compute the entropy, we used the well-known Shannon entropy equation: 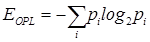 , where pi is computed from the normalized histogram of OPL(x,y). We also measure the structural homogeneity of the OPL maps of the cell nuclei by characterizing its uniformity UOPL. If the OPL map is perfectly homogenous, then the value of UOPL will be 1; otherwise, it will always be less than 1. Uniformity was calculated using the relation
 . The normalized histogram was generated from OPL(x,y) by considering 1000 sample bins within the appropriate optical path length range and the bins were chosen to ensure that the histogram details are captured without introducing sampling noise.
Statistical Analysis
To obtain a characteristic nuclear architecture marker for each patient, we calculate the statistical average of these three nanoscale nuclear architecture parameters over approximately 30-40 cells for each patient, denoted as (σOPL)p, (EOPL)p, and (UOPL)p. We performed statistical analyses using Microsoft Excel 2012 and SAS statistical software (SAS Institute). All statistical analyses were performed based on the Student's t-test at 95% confidence interval. Two-tailed P- values were used for all analyses. The alpha level was assumed to be 0.05. The two-tailed P-values of less than 0.05 were considered to be statistically significant. We constructed receiver operating characteristic (ROC) curve using a logistic regression with one marker - nuclear entropy. The discriminant power of the model was assessed by means of the area under the ROC curve (AUC).
RESULTS
Nuclear nano-architecture markers of normal gastric cardia and upper squamous esophagus
A total of 128 patients were prospectively enrolled into this study, which are split into two patient cohorts. The first cohort consists of 82 patients who had never received any treatment nor had any personal history of esophageal dysplasia or EAC; and the second cohort consists of 46 patients who had received either radiofrequency ablation (RFA) or endoscopic mucosal resection (EMR) or both.
The first patient cohort was categorized into three groups (shown in Table 1): a non-Barrett's (non-BE) control group consisting of patients with normal squamous esophagus and GERD; a low-risk BE group consisting of patients with non-dysplastic intestinal metaplasia; a high-risk BE group consisting of patients with low-grade dysplasia, high-grade dysplasia and/or EAC. No patient had undergone endoscopic therapy at enrollment.
Categorization of esophageal patients who have never been treated and had no prior history of esophageal dysplasia or EAC.
| Category | Age (year, mean±SD) | Most advanced diagnosis |
|---|---|---|
| Non-Barrett's control (never treated) | 62.0±16.9 | Normal squamous esophagus (12) GERD (2) |
| Low-risk Barrett's esophagus (never treated) | 63.0±9.0 | Intestinal Metaplasia Only (16) |
| High-risk Barrett's esophagus (never treated) | 68.5±11.1 | Low-grade dysplasia (LGD) (14) |
| High-grade dysplasia (HGD) (16) | ||
| Esophageal adenocarcinoma (EAC) (22) |
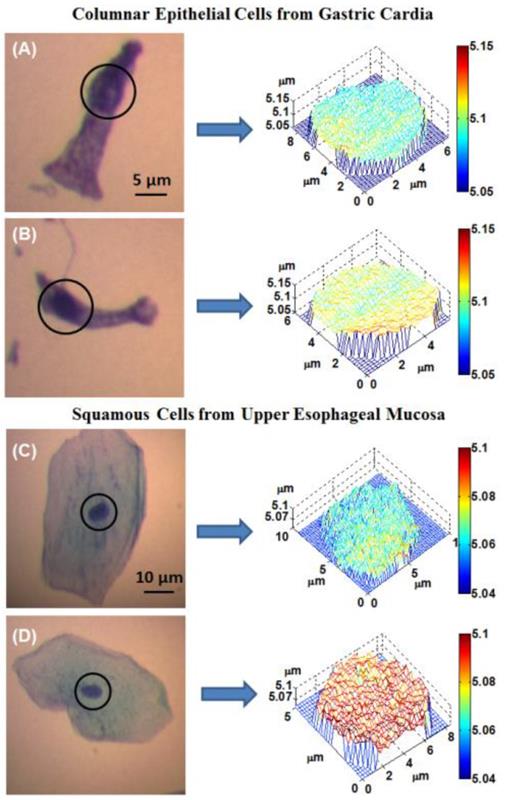
Figure 1 shows the representative optical path length (OPL) maps of cell nuclei together with the corresponding conventional bright-field microscopic images from both normal-appearing columnar epithelial cells from the gastric cardia located at ~1-2 cm below the GE junction, and normal squamous cells from the upper esophageal mucosa at ~20 cm from the incisors. Although these cells appear normal for the experienced pathologist, their architectural patterns in the OPL maps exhibit distinct differences between a BE patient without any dysplasia (low-risk) and a BE patient with dysplasia or EAC (high-risk) prior to any treatment.
(A-B) The representative bright-field microscopic images of columnar epithelial cells from gastric cardia and corresponding optical path length maps of the cell nuclei (marked in circles) from: (A) low-risk and (B) high-risk patient. (C-D) The representative bright-field images of squamous cells from upper esophageal mucosa and corresponding optical path length maps of the cell nuclei (marked in circles) from: (C) a low-risk and (D) a high-risk patient.
To quantify these architectural signatures reflected in these OPL maps, Fig. 2(A) shows the statistical analysis of three nuclear nano-architecture markers from the columnar epithelial cells of the gastric cardia located at ~1-2 cm below the GE junction. All three nuclear nano-architecture markers (i.e., (σOPL)p, (EOPL)p, and (UOPL)p) show a significant difference in high-risk BE patients compared to low-risk BE patients (P < 0.05). The structural heterogeneity features within the cell nucleus are significantly increased in high risk BE patients. For example, the intra-nuclear standard deviation (σOPL)p and entropy (EOPL)p are significantly increased in high-risk BE patients; while the intra-nuclear uniformity (UOPL)p) is significantly reduced in high-risk BE patients. No statistical significance is seen between non-BE control group and low-risk BE patients, suggesting that these nuclear nano-architecture markers do not differentiate BE from non-Barrett's patients. However, some of these markers do not distinguish well between non-Barrett's patients and high-risk BE patients. It should be noted that all of the cells analyzed are normal-appearing epithelial cells, as confirmed by an expert pathologist with special training in cytopathology.
The nano-architecture markers from the columnar-shaped epithelial cell nuclei of (A) gastric cardia located ~1-2 cm below the GE junction and (B) upper normal esophagus located at ~20 cm from the incisors.
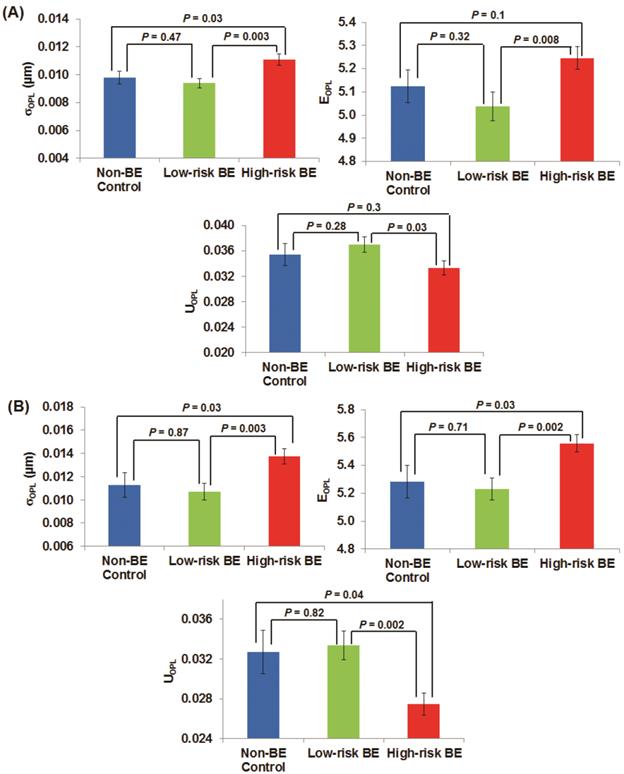
Figure 2(B) shows the analysis of these three nuclear nano-architecture markers from the normal-appearing squamous cells of the upper normal esophagus located ~20 cm from the incisors. There is a similar statistical significance between high-risk BE patients compared to low-risk BE patients (P < 0.01) as well as non-Barrett's esophagus (P < 0.05). The cancer field of esophageal dysplasia/neoplasia does extend as far as upper squamous esophagus. These markers again cannot differentiate the low-risk BE group from non-BE control patients.
Given these results, a question remained with regard to distance limits of the “field effect” within the esophagus. To address this question, we then analyzed the spatial dependence on the distance between the nuclear nano-architecture markers at the gastric cardia and the highest grade of dysplasia (or any dysplasia) found on mapping biopsies in high risk BE patients. Spearman correlation coefficient was calculated for each of the three nuclear nano-architecture markers, as shown in Table 2. The result suggests that the optical markers from the gastric cardia show little dependence on the distance from any dysplasia or the highest grade of dysplasia.
Spatial dependence of the nuclear nano-architecture markers between dysplasia and proximal gastric fold.
| Category | Standard deviation | Entropy | Uniformity | |
|---|---|---|---|---|
| Distance between highest grade of dysplasia and gastric fold | Correlation coefficient | 0.002 | -0.006 | -0.014 |
| P-value | 0.99 | 0.97 | 0.92 | |
| Distance between any dysplasia and gastric fold | Correlation coefficient | 0.092 | 0.05 | -0.04 |
| P-value | 0.52 | 0.73 | 0.75 | |
Nuclear nano-architecture markers of normal gastric cardia and upper squamous esophagus in response to endoscopic therapy
As endoscopic therapy such as radiofrequency ablation (RFA) and endoscopic mucosal resection (EMR) is frequently used in high-risk patients with low-grade, high-grade dysplasia and adenocarcinoma, we also evaluated how these nuclear nano-architecture markers change in response to endoscopic therapy. In the second patient cohort of 46 patients who had been treated with RFA or EMR or both at least 6 weeks prior (as shown in Table 3), we analyzed these markers from their normal-appearing gastric cardia and upper squamous esophagus and compared them with those markers from patients who had never been treated (the first patient cohort).
Categorization of esophageal patients who had been treated with radiofrequency ablation (RFA) or endoscopic mucosal resection (EMR) or both.
| Category | Age (year, mean±SD) | Most advanced diagnosis post treatment | Treatment |
|---|---|---|---|
| Low-risk BE post treatment | 69.0±13.0 | Normal squamous esophagus (16) | RFA (24) |
| Intestinal Metaplasia Only (13) | EMR (12) | ||
| High-risk BE post treatment | 70.0±11.2 | High-grade dysplasia (6) | RFA (9) |
| Esophageal adenocarcinoma (3) | EMR (7) |
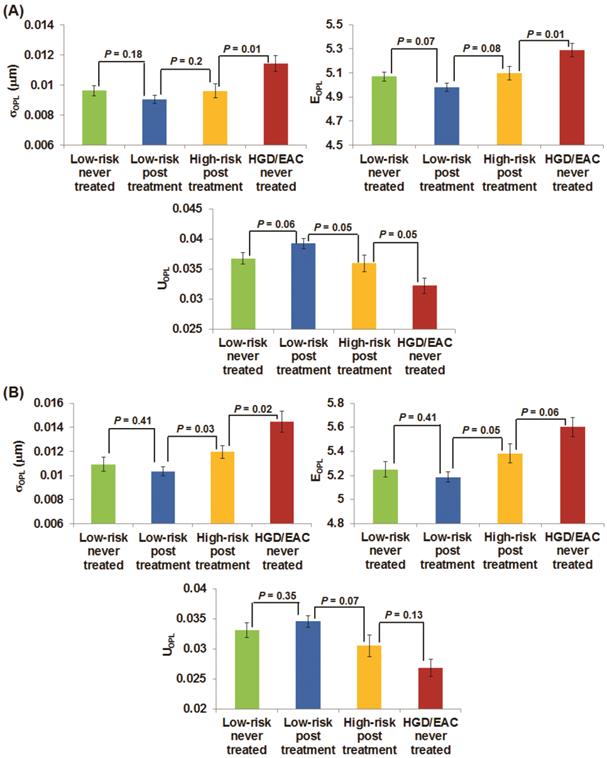
Figures 3(A-B) demonstrate the changes of the three nuclear nano-architecture markers (i.e., (σOPL)p, (EOPL)p, and (UOPL)p) in the gastric cardia at ~1-2 cm below the GE junction and upper squamous esophagus 20 cm from the incisors, respectively, in response to RFA or EMR. These markers show a progressive change in patients with HGD and EAC prior to the treatment, post-treatment high-risk patients (residual dysplasia) and post treatment low-risk patients (no residual dysplasia). In contrast to the significantly increased structural intra-nuclear heterogeneity from low-risk to high-risk BE patients, these intra-nuclear heterogeneity markers reverted toward normal in post-treatment low-risk patients compared to the never-treated patients with HGD and EAC, with a dramatic decrease in intra-nuclear standard deviation and entropy (P ≤ 0.0002) and a substantial increase in intra-nuclear uniformity (P < 0.0001). The nuclear nano-architecture markers in post-treatment low-risk patients become similar to those never-treated low-risk patients including those with BE and non-BE controls (P > 0.05). These results provide further evidence that the nuclear nano-architecture markers are indeed due to the neoplastic changes, rather than other non-specific changes. Interestingly, even in the post-treatment high-risk patients, most of their nuclear nano-architecture markers from the uninvolved gastric cardia and upper squamous esophagus show a significant change compared to those never-treated patients with HGD and EAC, which might indicate a potential risk reduction in these treated patients.
The changes of three nano-architecture markers from the columnar-shaped epithelial cell nuclei of (A) gastric cardia located ~1-2 cm and (B) upper normal esophagus located at ~20 cm from the incisors below the GE junction in response to endoscopic therapy.
DISCUSSION
In this study, we demonstrate that several nuclear nano-architecture markers (intra-nuclear standard deviation, entropy, uniformity) detect the “field effect” of esophageal dysplasia and neoplasia in BE patients from two normal-appearing non-dysplastic and non-Barrett's uninvolved areas - gastric cardia and upper squamous esophagus. Further, the nano-architecture markers in both uninvolved areas reverted toward normal as a response to endoscopic treatment, suggesting their potential to monitor the effect of therapy and also confirming the neoplastic relevance of these nuclear nano-architecture markers.
The gastric cardia at ~1-2 cm below the GE junction exhibits a similar cancer “field effect” for esophageal dysplasia/neoplasia with the upper esophagus located 20 cm from the incisors. Both gastric cardia and upper esophagus are non-dysplastic non-Barrett's-involved areas. As BE always originates from lower esophagus, the gastric cardia is in close proximity to Barrett's segment, presenting a close “cancer field”. On the other hand, the upper squamous esophagus represents a far “cancer field” which may be more-easily accessible for cytology procurement using non-endoscopic techniques. Our data show that the “field effect” detected by nano-architecture markers does extend as far as the upper esophagus. In addition, these markers do not seem to be localized to the small regions around the esophageal dysplasia, as suggested by the little dependence on the distance between dysplasia and the gastric cardia.
Several molecular markers have also been previously reported to detect the “field effect” in esophageal dysplasia/neoplasia. For example, the global gene expression signatures have been identified in normal squamous cells from patients with Barrett's-associated adenocarcinoma [6]. A recent study using next-generation sequencing reports mutation detected in gastric cardia in patients with HGD [27]. The epigenetic patterns were also found in the normal esophagus among a subset of patients with Barrett's-associated esophageal dysplasia and adenocarcinoma [7]. Further, the metabolic profiles of histologically normal tissue in non-Barrett's segments have shown distinct differences between BE patients with EAC from those controls without EAC [8], supporting the presence of metabonomic field effect in esophageal cancer. These molecular markers provide additional biological evidence to support the presence of “field effect” in esophageal cancer. The nuclear nano-architectural markers are the structural manifestation of these complex molecular events. Although the exact biological mechanisms responsible for the altered nuclear nano-architecture markers are not known, some evidence has shown that they detect changes in nuclear density and chromatin condensation [22, 23].
These provocative results potentially have significant clinical implications. Rather than intensive, time-consuming and expensive biopsy protocols to select high-risk patients, the analysis of epithelial cells from gastric cardia or upper squamous esophagus obtained by cytology brushings represent potential alternatives to improve the risk stratification and surveillance of patients with Barrett's esophagus or monitor the efficacy of ablative therapy. Alternatively, given the decreased esophageal mucosal disruption with such sampling, the assessment of uninvolved gastric cardia or upper squamous esophagus may also be useful as a way to collect diagnostic information during the same endoscopy as an ablative therapy session, thus decreasing the need for interval surveillance procedures.
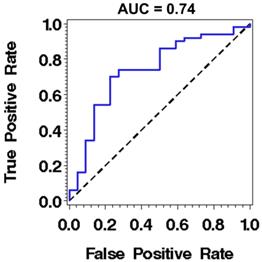
While these results are encouraging with demonstrated statistical significance in detecting high-risk from low-risk BE patients, the current performance of these nano-architecture markers remains sub-optimal for clinical use, as the area under the receiving operating characteristics (ROC) curve using one marker is 0.74 (sensitivity of 86% at a specificity of 50%) for distinguishing high-risk BE patients with any dysplasia or EAC from low-risk BE patients with intestinal metaplasia only, as shown in Fig. 4. A number of potential factors may be contributing to this limitation. First, about one third of the patients in the high risk group have low-grade dysplasia, whose actual risk for developing cancer is still controversial [28, 29]. The reason the low-grade dysplasia is categorized as high-risk BE group in our study is that as our goal is to identify an enriched population who should be surveyed more closely, according to the current guidelines [30]. Second, although the nuclear nano-architectural markers describe different aspects of structural heterogeneity within the cell nucleus, some of them are correlated, such as intra-nuclear entropy and uniformity. The high-level of correlation limits the use of multiple markers in the prediction model. Therefore, we are exploring additional complementary nano-architecture markers [31] to improve the accuracy in order to supersede current clinical practice. We are also evaluating the optical analysis of histology preparation of tissue biopsies directly from non-dysplastic Barrett's segment that have shown promise of higher accuracy [32].
The performance characteristics described by receiver operating characteristic (ROC) curve using nuclear entropy from the squamous cell nuclei of normal esophagus located ~20 cm from the incisors to distinguish low-risk from high-risk BE patients. The discriminatory accuracy assessed by the area under the curve (AUC) is 0.74.
This study suggest that the gastric cardia and upper squamous esophagus represent potential alternative sites to improve the risk stratification during screening and surveillance of patients with Barrett's esophagus or to monitor the efficacy of endoscopic therapy, based on the “field effect” of esophageal dysplasia and neoplasia. We discovered that the nuclear nano-architecture markers of these two non-dysplastic and non-Barrett's sites detect the presence of esophageal dysplasia and EAC and respond to endoscopic therapy. While these results are encouraging, additional molecular or optical markers are needed to yield improved performance.
Acknowledgements
The project described was supported by the National Institutes of Health through Grant Number UL1TR000005, R21CA164433 and R01EB016657.
COMPETING INTERESTS
The authors claim no financial interest.
References
1. Eloubeidi MA, Mason AC, Desmond RA, El-Serag HB. Temporal trends (1973-1997) in survival of patients with esophageal adenocarcinoma in the United States: a glimmer of hope? Am J Gastroenterol. 2003;98:1627-33
2. Ronkainen J, Aro P, Storskrubb T, Johansson SE, Lind T, Bolling-Sternevald E. et al. Prevalence of Barrett's esophagus in the general population: an endoscopic study. Gastroenterology. 2005;129:1825-31
3. Hayeck TJ, Kong CY, Spechler SJ, Gazelle GS, Hur C. The prevalence of Barrett's esophagus in the US: estimates from a simulation model confirmed by SEER data. Dis Esophagus. 2010;23:451-7
4. Hvid-Jensen F, Pedersen L, Drewes AM, Sorensen HT, Funch-Jensen P. Incidence of adenocarcinoma among patients with Barrett's esophagus. N Engl J Med. 2011;365:1375-83
5. Kahrilas PJ. The problems with surveillance of Barrett's esophagus. N Engl J Med. 2011;365:1437-8
6. Selaru FM, Wang S, Yin J, Schulmann K, Xu Y, Mori Y. et al. Beyond Field Effect: Analysis of Shrunken Centroids in Normal Esophageal Epithelia Detects Concomitant Esophageal Adenocarcinoma. Bioinform Biol Insights. 2007;1:127-36
7. Eads CA, Lord RV, Wickramasinghe K, Long TI, Kurumboor SK, Bernstein L. et al. Epigenetic patterns in the progression of esophageal adenocarcinoma. Cancer Res. 2001;61:3410-8
8. Yakoub D, Keun HC, Goldin R, Hanna GB. Metabolic profiling detects field effects in nondysplastic tissue from esophageal cancer patients. Cancer Res. 2010;70:9129-36
9. Backman V, Roy HK. Light-scattering technologies for field carcinogenesis detection: a modality for endoscopic prescreening. Gastroenterology. 2011;140:35-41
10. Roy HK, Hensing T, Backman V. Nanocytology for field carcinogenesis detection: novel paradigm for lung cancer risk stratification. Future Oncol. 2011;7:1-3
11. Uttam S, Bista RK, Staton K, Alexandrov S, Choi S, Bakkenist CJ. et al. Investigation of depth-resolved nanoscale structural changes in regulated cell proliferation and chromatin decondensation. Biomed Opt Express. 2013;4:596-613
12. Iyer S, Gaikwad RM, Subba-Rao V, Woodworth CD, Sokolov I. Atomic force microscopy detects differences in the surface brush of normal and cancerous cells. Nat Nanotechnol. 2009;4:389-93
13. Knecht H, Mai S. 3D imaging of telomeres and nuclear architecture: An emerging tool of 3D nano-morphology-based diagnosis. J Cell Physiol. 2011;226:859-67
14. Subramanian H, Pradhan P, Liu Y, Capoglu IR, Li X, Rogers JD. et al. Optical methodology for detecting histologically unapparent nanoscale consequences of genetic alterations in biological cells. Proc Natl Acad Sci U S A. 2008;105:20118-23
15. Wang P, Bista RK, Khalbuss WE, Qiu W, Uttam S, Staton K. et al. Nanoscale nuclear architecture for cancer diagnosis beyond pathology via spatial-domain low-coherence quantitative phase microscopy. J Biomed Opt. 2010;15:066028
16. Bista RK, Wang P, Bhargava R, Uttam S, Hartman DJ, Brand RE. et al. Nuclear nano-morphology markers of histologically normal cells detect the "field effect" of breast cancer. Breast Cancer Res Treat. 2012;135:115-24
17. Bista RK, Brentnall TA, Bronner MP, Langmead CJ, Brand RE, Liu Y. Using optical markers of nondysplastic rectal epithelial cells to identify patients with ulcerative colitis-associated neoplasia. Inflamm Bowel Dis. 2011;17:2427-35
18. Bista RK, Uttam S, Hartman DJ, Qiu W, Yu J, Zhang L. et al. Investigation of nuclear nano-morphology marker as a biomarker for cancer risk assessment using a mouse model. J Biomed Opt. 2012;17:066014
19. Damania D, Roy HK, Subramanian H, Weinberg DS, Rex DK, Goldberg MJ. et al. Nanocytology of rectal colonocytes to assess risk of colon cancer based on field cancerization. Cancer Res. 2012;72:2720-7
20. Roy HK, Subramanian H, Damania D, Hensing TA, Rom WN, Pass HI. et al. Optical detection of buccal epithelial nanoarchitectural alterations in patients harboring lung cancer: implications for screening. Cancer Res. 2010;70:7748-54
21. Subramanian H, Roy HK, Pradhan P, Goldberg MJ, Muldoon J, Brand RE. et al. Nanoscale cellular changes in field carcinogenesis detected by partial wave spectroscopy. Cancer Res. 2009;69:5357-63
22. Bista RK, Uttam S, Wang P, Staton K, Choi S, Bakkenist CJ. et al. Quantification of nanoscale nuclear refractive index changes during the cell cycle. J Biomed Opt. 2011;16:070503
23. Uttam S, Bista RK, Hartman DJ, Brand RE, Liu Y. Correction of stain variations in nuclear refractive index of clinical histology specimens. J Biomed Opt. 2011;16:116013
24. Wang P, Bista R, Bhargava R, Brand RE, Liu Y. Spatial-domain low-coherence quantitative phase microscopy for cancer diagnosis. Optics letters. 2010;35:2840-2
25. Wang P, Bista RK, Qiu W, Khalbuss WE, Zhang L, Brand RE. et al. An insight into statistical refractive index properties of cell internal structure via low-coherence statistical amplitude microscopy. Opt Express. 2010;18:21950-8
26. Gonzalez RC, Woods RE, Eddins SL. Digital Image processing using MATLAB. Upper Saddle River, NJ: Pearson/Prentice Hall. 2004
27. Sepulveda AR, Yao Y, Uehara T, Jhala N, Ganguly T, Sepulveda J. et al. Mutational Analysis by Next-Generation Sequencing of Pre-Neoplastic Intestinal Metaplasia and Neoplastic Lesions in Barrett's Esophagus From Endoscopic Samples. Digestive Disease Week. 2013:386. Orlando, Florida
28. Curvers WL, ten Kate FJ, Krishnadath KK, Visser M, Elzer B, Baak LC. et al. Low-grade dysplasia in Barrett's esophagus: overdiagnosed and underestimated. Am J Gastroenterol. 2010;105:1523-30
29. Wani S, Falk GW, Post J, Yerian L, Hall M, Wang A. et al. Risk factors for progression of low-grade dysplasia in patients with Barrett's esophagus. Gastroenterology. 2011;141:1179-86
30. Committee ASoP, Evans JA, Early DS, Fukami N, Ben-Menachem T, Chandrasekhara V. et al. The role of endoscopy in Barrett's esophagus and other premalignant conditions of the esophagus. Gastrointest Endosc. 2012;76:1087-94
31. Alexandrov SA, Uttam S, Bista RK, Staton K, Liu Y. Spectral encoding of spatial frequency approach for characterization of nanoscale structures. Appl Phys Lett. 2012;101:33702
32. Rizvi S, Davison JM, Bista RK, Wang P, Holinga J, Staton KD. et al. Nuclear Refractive Index Properties of Non-Dysplastic Metaplastic Cells to Detect the Presence of Esophageal High-Grade Dysplasia and Adenocarcinoma From Barrett's Esophagus. Gastroenterology. 2011;140:S-217
Author contact
![]() Corresponding author: Yang Liu, PhD, Department of Medicine and Bioengineering, 5117 Centre Avenue, Hillman Cancer Center 2.32, Pittsburgh, Pennsylvania 15232, USA. E-mail: liuyedu; Tel: 412-6233751.
Corresponding author: Yang Liu, PhD, Department of Medicine and Bioengineering, 5117 Centre Avenue, Hillman Cancer Center 2.32, Pittsburgh, Pennsylvania 15232, USA. E-mail: liuyedu; Tel: 412-6233751.