Impact Factor ISSN: 1837-9664

 Global reach, higher impact
J Cancer 2014; 5(6):446-456. doi:10.7150/jca.9140 This issue Cite
Research Paper
Glioma Malignancy-Dependent NDRG2 Gene Methylation and Downregulation Correlates with Poor Patient Outcome
Daina Skiriutė1, Giedrius Steponaitis1, Paulina Vaitkienė1, Mykolas Mikučiūnas1, Kęstutis Skauminas1, Arimantas Tamašauskas2, Arunas Kazlauskas1 ![]()
1. 1 Laboratory of Neurooncology and Genetics, Neuroscience Institute, Medical Academy, Lithuanian University of Health Sciences, Eiveniu str. 4, LT-50009, Kaunas, Lithuania.
2. 2 Department of Neurosurgery, Medical Academy, Lithuanian University of Health Sciences, Eiveniu str. 2, LT-50009, Kaunas, Lithuania
Received 2014-3-17; Accepted 2014-4-10; Published 2014-5-13
Abstract
Aims: NDRG2 (N-myc downstream regulated gene 2) gene is involved in important biological processes: cell differentiation, growth and apoptosis. Several molecular studies have shown NDRG2 as a promising diagnostic marker involved in brain tumor pathology. The aim of the study was to investigate how changes in epigenetic modification and activity of NDRG2 reflect on glioma malignancy and patient outcome. Methods: 137 different malignancy grade gliomas were used as the study material: 14 pilocytic astrocytomas grade I, 45 diffuse astrocytomas grade II, 29 anaplastic astrocytomas grade III, and 49 grade IV astrocytomas (glioblastomas). Promoter methylation analysis has been carried out by using methylation-specific PCR, whereas RT-PCR and Western-blot analyses were used to measure NDRG2 expression levels. Results: We demonstrated that NDRG2 gene methylation frequency increased whereas expression at both mRNA and protein levels markedly decreased in glioblastoma specimens compared to the lower grade astrocytomas. NDRG2 transcript and protein levels did not correlate with the promoter methylation state, suggesting the presence of alternative regulatory gene expression mechanisms that may operate in a tissue-specific manner in gliomas. Kaplan-Meier analyses revealed significant differences in survival time in gliomas stratified by NDRG2 methylation status and mRNA and protein expression levels. Conclusions: Our findings highlight the usefulness of combining epigenetic data to gene expression patterns at mRNA and protein level in tumor biomarker studies, and suggest that NDRG2 downregulation might bear influence on glioma tumor progression while being associated with higher malignancy grade.
Keywords: glioma malignancy grade, NDRG2, DNA methylation, protein and mRNA expression, patient survival.
Introduction
Gliomas are the most common among primary malignant brain tumors with the characteristic heterogeneity in histology, molecular profile and outcome. During the course of pathogenesis, brain tumors acquire malignancy features ranging from mild morphological signs of anaplasia in World Health Organization (WHO) grade I and II astrocytomas to highly malignant WHO grade III astrocytomas and especially grade IV astrocytomas, which also known as glioblastomas, with high mitotic activity, aberrant vasculature and necrosis. It is now known that glioblastomas can develop through two distinct pathways: 95% of glioblastomas are primary or de novo arising without clinically evident precursor, whereas secondary glioblastomas can progress in patients with previously histologically confirmed low grade gliomas. Both types of glioblastoma clinically manifest as an aggressive infiltrating brain tumor with patient survival less than 1 year [1]. From molecular standpoint, gliomas are highly heterogeneous brain tumors, which scholars have attempted to classify into clinically relevant subtypes according to gene expression and DNA methylation profiles [2, 3]. However, molecular markers that could routinely be used in clinical practice for determining malignancy grade of glioma with the high accuracy as well as to provide reliable diagnostic and prognostic information on this type of cancer are currently unknown.
Several molecular studies in meningiomas and gliomas have shown NDRG2 (N-myc downstream regulated gene 2) gene as a promising diagnostic marker involved in brain tumor pathology [4-7]. The protein encoded by this gene, NDRG2, is a member of the non-enzymatic alpha/beta hydrolase superfamily [8]. NDRG2 is a cytoplasmic protein involved in cell differentiation, cell growth, neuronal plasticity, stress response and apoptosis [9]. Because of its high expression in brain tissue, NDRG2 gene was related to some important functions and pathophysiological processes in the brain such as Alzheimer's disease, cerebral ischemia, etc. [10, 11]. The first evidence of NDRG2 involvement in cancer was presented in glioblastomas, where NDRG2 was shown to reduce tumor cell proliferation [12]. Subsequent studies demonstrated NDRG2 as an inhibitor of extracellular matrix-based cancer cell invasion and migration in liver cancer cells [13]. In several cancer cell lines, NDRG2 gene expression was shown to be hypoxia inducible and responsible for hypoxia-associated apoptosis, and also playing a role in hypoxia-induced radioresistance of cancer cells [14, 15]. A number of reports from studies on cancer tissues have shown that NDRG2 expression was associated with differentiation and advanced grade of liver cancer, and esophageal squamous carcinoma [13, 16]. Reduced NDRG2 expression was correlated with poor survival prognosis in patients with liver cancer, esophageal squamous cell carcinoma, colorectal cancer, clear cell renal cell carcinoma, gallbladder cancer, and lung cancer [13, 17-21].
With particular regard to glioma, recent clinical studies demonstrated NDRG2 as a putative tumor suppressor gene silenced in the majority of glioblastomas [5, 7, 22]. However, the main mechanism that underlies NDRG2 silencing in glioma is unknown. There is also a debate whether NDRG2 gene activity reflects on survival of glioma patient. Thus, the shortage of the consistent data on NDRG2 involvement in gliomagenesis and conflicting evidence on association of NDRG2 activity with glioma patient survival prompted us to investigate the role of epigenetic modification and expression of NDRG2 gene in glioma progression and the resulting patient outcome by setting up a complex analysis of NDRG2 activity at DNA, RNA and protein levels in gliomas of different malignancy grade. Understanding how NDRG2 is involved in the process of gliomagenesis could help to understand more about the function and molecular regulatory mechanisms of this gene.
Material and methods
Patients and tissue samples
We investigated 137 WHO grade I-IV gliomas: 14 (10.2%) pilocytic astrocytomas WHO grade I, 45 (32.8%) diffuse astrocytomas WHO grade II, 29 (21.2%) anaplastic astrocytomas grade III, and 49 (35.8%) malignant astrocytomas WHO grade IV (glioblastomas). All glioma tumors were surgically resected from patients without prior treatment and histologically diagnosed according to the 2007 WHO criteria [23] in the Department of Neurosurgery of Hospital of Lithuanian University of Health Sciences, Kaunas, Lithuania, from 2003 through 2012. Database closure was in September 2013. Investigation have been performed in accordance with the principles of Declaration of Helsinki and approved by the Ethics Committee for Biomedical Research of the Lithuanian University of Health Sciences. All patients gave written informed consent. The following clinical data were collected for each patient: age at the time of the operation, gender, time of the last follow-up and patient life status. Patient survival has been calculated from the date of operation to the date of analysis or death of the patient.
Methylation analyses were performed on all 137 samples, however, due to the scarcity of the material, NDRG2 expression studies were conducted with two smaller groups of samples. More specifically, 112 glioma samples (10 astrocytomas grade I, 39 astrocytomas grade II, 20 astrocytomas grade III and 43 glioblastomas) were used for mRNA studies, whereas 88 tumor samples (12 astrocytomas grade I, 31 astrocytomas grade II, 18 astrocytomas grade III and 27 glioblastomas) were used for Western blot analysis. Noteworthy, the overlap between these two sample groups was 77 glioma samples (9 astrocytomas grade I, 29 astrocytomas grade II, 13 astrocytomas grade III and 26 glioblastomas).
DNA extraction. MS-PCR
Brain tumor tissue specimens after dissection were snap-frozen in liquid nitrogen and stored until analysis. Tumor DNA was purified from 50-100 mg of frozen tissue using ZR Genomic DNA Tissue MiniPrep (Zymo Research) according to manufacturer's protocol. Methylation status of NDRG2 gene promoter was determined by bisulfite treatment of DNA. 400 ng of total genomic DNA was modified using EZ DNA Methylation Kit (Zymo Research). Bisulfite-treated DNA was eluted in 40 µl nuclease-free water, and stored in -80°C until analysis. "Human brain DNA" (Zymo Research, Catalog No. D5018) served as a normal brain tissue control. For negative methylation control normal human blood lymphocyte DNA treated with bisulfite was used. Bisulfite Converted Universal Methylated Human DNA Standard (Zymo Research) was used as a positive control for DNA methylation. Promoter methylation was detected by methylation-specific PCR (MSP). Each MSP reaction incorporated approximately 20 ng of bisulfite-treated DNA as template. Specific primers for methylated and unmethylated target DNA sequence were designed according to the published data [24]. MSP primers for methylated NDRG2 allele were: 5'-AGAGGTATTAGGATTTTGGGTACG-3' (sense) and 5'-GCTAAAAAAACGAAA ATCTCGC-3' (antisense) and for unmethylated allele: 5'-AGAGGTATTAGGATTTT GGGTATGA-3' (sense) and 5'-CCACTAAAAAAACAAAAATCTCACC-3' (antisense). Reaction was performed in 15 µl of total volume by using 7.5 µl Maxima Hot Start PCR Master Mix (Thermofisher Scientific) with Hot start Taq DNA polymerase and 10 pmol of each primer (Metabion International AG). MSP was performed for 38 cycles with the reaction starting at 95°C for 1 min., annealing of 58°C for 15 sec., and extension of 72°C for 30 sec. Amplification products were analyzed on 2% agarose gels with ethidium bromide and documented under UV. The presence of a PCR product of the correct molecular weight indicated the presence of either unmethylated or methylated alleles. In case of appearance of both unmethylated and methylated signals in a gel, gene was considered as being methylated.
RNA extraction, cDNA synthesis and real time quantitative RT-PCR
Samples were collected after surgical resection, snap-frozen and stored in liquid nitrogen until RNA extraction. Total RNA from cryogenically homogenized tumor tissue was purified using TRIzol Reagent (Ambion, Life Technologies). To increase the yield of RNA, homogenate was additionally sonicated using ultrasound (500-Watt ultrasonic processor, Cole Parmer). After purification, RNA quality and amount was estimated by NanoDrop system (Thermo Scientific) and stored at -80 °C. RNA integrity was verified by electrophoresis in a 2% agarose gel. RNase-free DNase (ThermoFisher Scientific) was used in order to avoid DNA contamination. Reverse transcription was carried out using RevertAid H Minus M-MuLV Reverse Transcriptase (Thermofisher Scientific) and random hexamer primers (Thermofisher Scientific) in a total reaction volume of 20 µl according to the manufacturer's protocol. For inhibition of mRNA degradation RiboLock RNase inhibitor (ThermoFisher Scientific) was used. After synthesis cDNA stock was stored at -80 °C.
NDRG2 mRNA expression study was performed using quantitative real-time reverse transcriptase PCR SYBR Green I analysis in 3 replicates on 7500 Fast Real-time PCR detection system (Applied Biosystems) and Relative Quantitation method (ΔCT). Primer pair 5'-CATTACACATGCACCCAACC-3' (sense) and 5'-GGAGTCAGCCATCTTGAGGA-3' (antisense) has been used for detection of NDRG2 gene (amplicon length: 128 bp); primer pair 5'-AGAGCTACGAGCTGCCTGAC-3' (sense) and 5'-AGCACTGTGTTGGCGTA CAG-3' (antisense) has been used for detection of endogenous control β-actin gene (amplicon length: 184 bp) (Metabion International AG). Reactions have been assembled into a total volume of 12 µl of each, which included: 15 ng of the cDNA, 6 μl Maxima Hot Start PCR Master Mix (Thermofisher Scientific) with Hot start Taq DNA polymerase, primers for NDRG2 and β-actin to a total concentration of 0.5 µM and 0.2 µM, respectively, and nuclease-free water. PCR has been carried out for 40 cycles consisting of 95 °C for 30 sec., 60 °C for 30 sec., and 72 °C for 30 sec. Fluorescent data were converted to threshold cycle (CT) measurements. CT values from three replicates were averaged for both the target (NDRG2) and control (β-actin) genes, and ΔCT values were calculated according to the formula ΔCT = CT NDRG2 - CT β-actin. The final result was given as 2-(ΔCT) calculation. Human normal brain RNA sample “FirstChoice Human Brain Reference RNA” (Ambion), which was a pool of RNAs assembled from multiple donors from several brain regions, as described by the manufacturer, served as a control sample for standard curve design. Standard curve parameters were as follows: for NDRG2: efficiency 105.7 %, R2 0.99, slope -3.33; for β-actin: efficiency 101.2 %, R2 0.997, slope -3.29, thereby confirming the suitability of PCR conditions and primers for mRNA quantitation.
Whole-tissue extract preparation and Western blot analysis
Whole-tissue extracts of the tumor samples have been routinely prepared by resuspending the sample (100-200 µg) in RIPA lysis buffer (50 mM Tris-HCl, pH 7.5, 150 mM NaCl, 1% Igepal CA-630 (Sigma-Aldrich), 0.5% sodium deoxycolate, 0.1% SDS) supplemented with a protease inhibitor cocktail (Sigma-Aldrich) and homogenizing using an ultrasonic sonifier (500-Watt Ultrasonic Processor, Cole-Parmer). Subsequently, the extracts were cleared by centrifugation for 30 min at 13.000×g at 4 °C. 80 μg of the total extract protein were fractionated by 7.5% SDS-PAGE and transferred to nitrocellulose membranes. Immobilized proteins were incubated for 2 h at 25 °C with the primary rabbit antibody against NDRG2 (Nordic BioSite, catalog No. 12015-1-AP (antigen peptide region 1-357 a.a.), dilution 1:500) in blocking solution (5% nonfat milk in phosphate-buffered saline (PBS)). After extensive washing in PBS-T buffer (PBS supplemented with 0.5% Tween-20), membranes were incubated with the horseradish peroxidase- (HRP-) conjugated anti-rabbit secondary antibody (Life Technologies, catalog No. 656120, dilution 1:2000) for 1 h at 25 °C. For detection of beta-actin on the same membranes, the membranes were first cleared of the NDRG2 antibody complexes by washing in the mild-striping buffer (25mM glycine, 2% SDS, pH 2.0) and reprobed with the primary monoclonal mouse antibody against beta-actin (Antibodies-Online, catalog No. ABIN559692, dilution 1:2000) for 1 h at 25 °C followed by incubation with the HRP-conjugated anti-mouse secondary antibody (Life Technologies, catalog No. 626520, dilution 1:2000) for 1 h at 25 °C. Immunocomplexes were visualized using enhanced chemiluminescence reagents (Life Technologies) and documented by using gel imaging system GelDoc-It2 (Analytika Jena AG). Values of NDRG2 and beta-actin signals were calculated by using image analysis program ImageJ (National Institutes of Health, U.S.A.).
In the experimental setup, the set of 88 glioma tumor samples was organized in 6 groups each of which containing of 16-17 tissue extracts prepared from tumors of different malignancy grade (groups 1-4 contained samples of grades I-IV, whereas groups 5 and 6 contained only grades II-IV due to the scarcity of the grade I and grade III material). NDRG2 protein levels of each of the tested glioma sample were estimated by performing a densitometric analysis of the digital chemiluminiscence signals of immunoblots (Figure 3C). A separate immunoblot analysis was performed on a group of samples containing arbitrarily chosen representative samples from each of the 6 sample groups. NDRG2 signals obtained from these group representatives were used to normalize NDRG2 values (in addition to the normalization with the beta-actin values) obtained from all 6 sample groups. Subsequently, the normalized NDRG2 signal value of each tumor sample was divided by the average signal value calculated from the total of 89 samples resulting to the final value of the relative NDRG2 protein expression.
Statistical analyses
For real-time PCR and Western-blot assays, differences across groups were analyzed using Kruskal-Wallis test (comparison of >2 groups). For MSP data analysis, chi-square test was used to evaluate methylation frequency differences between tumor grades. To evaluate expression differences across gene methylation groups, Mann-Whitney test was used (comparison of 2 groups). Correlation between gene expression at mRNA and protein level was calculated using Spearman correlation coefficient. The association among various factors, such as NDRG2 promoter methylation, mRNA and protein expression level, and clinical parameters (age, gender, tumor grade, survival groups) were analyzed with the chi-square test.
For the analysis of the prognosis of the patients, survival was calculated from the date of operation until death, or the date of the last follow-up. Survival was analyzed with the Kaplan-Meier method, and the log-rank test was used to compare difference of survival curve between groups. To show the reliability of the survival estimate, the confidence interval (CI) with 95% confidence level was presented. Prognostic factors such as gender, age and clinical grade were first examined individually (univariate analysis), and all factors that had strong impact on survival were then evaluated jointly in Cox regression analysis (multivariate analysis).
Data analysis was performed using the SPSS for Windows (version 21.0, IBM) and p<0.05 was considered significant.
Results
NDRG2 promoter methylation frequency in glioma is grade-dependent
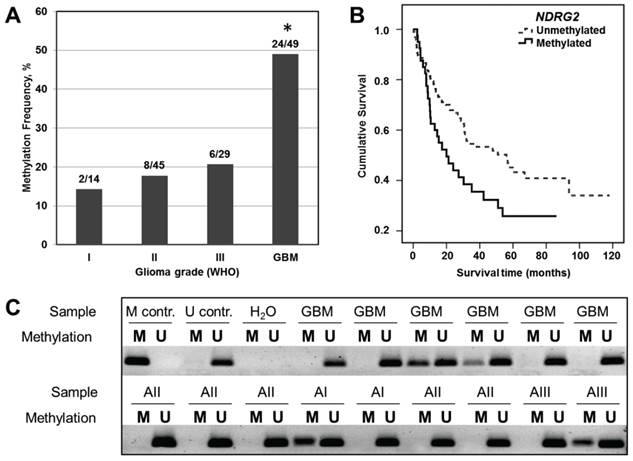
NDRG2 promoter methylation status has been determined in 137 samples of different grade gliomas by using methylation-specific PCR (Figure 1C). As shown in Figure 1A and Table 1, moderate NDRG2 promoter methylation frequencies have been determined in grade I, II and III astrocytomas with the slight variation in methylation percentage values between these grades: 14.3% (2 out of 14), 17.8% (8 out of 45), and 20.7% (6 out of 29), respectively. In contrast, methylation frequency of NDRG2 promoter was markedly increased to the value of 49.0% (24 out of 49) in glioblastoma tumors (Chi-square test, p>0.05). It should be noted, that NDRG2 methylation signal in control normal brain tissue was absent (Figure 1C). These results indicate that promoter methylation of NDRG2 is tumor-specific and is associated with the aggressiveness of glioma tumor.
Analysis of NDRG2 methylation in different grade gliomas and effects of NDRG2 methylation on patient survival. (A) Methylation frequency (%) shown in the bar plot; asterisk indicates significant differences between glioma grades (p<0.05). (B) Kaplan-Meier survival curves for survival (months) of all glioma patients stratified by NDRG2 methylation status; Log-rank test, χ2=5.99, df=1, p=0.014. (C) Representative MS-PCR for NDRG2 in different grade glioma tumor specimens. U represents amplification of unmethylated alleles, and M represents methylated alleles. Standard Bisulfite Converted Universal Methylated Human DNA (M contr.) and normal human peripheral lymphocytes (U contr.) served as positive and negative methylation controls, respectively. H2O - water control, GBM - glioblastoma (astrocytoma of WHO grade IV), AI, AII, and AIII designate astrocytomas of WHO grade I, II, and III, respectively.
Relationship between NDRG2 promoter methylation, patient clinical characteristics, mRNA and protein expression level.
| Number of patients | NDRG2 methylation | p-value | |||
|---|---|---|---|---|---|
| aM (%) | bU (%) | ||||
| Cases | 137 | 39 (28.5) | 98 (71.5) | ||
| Sex | Male | 62 | 16 (25.8) | 46 (74.2) | 0.346 |
| Female | 75 | 24 (32.0) | 51 (68.0) | ||
| Age (years) | ≤50 | 73 | 15 (20.5) | 58 (79.5) | 0.037 |
| >50 | 64 | 24 (37.5) | 40 (62.5) | ||
| Grade | I | 14 | 2 (14.3) | 12 (85.7) | 0.001 |
| II | 45 | 8 (17.8) | 37 (82.2) | ||
| III | 29 | 5 (17.2) | 24 (82.8) | ||
| GBM | 49 | 24 (49.0) | 25 (51.0) | ||
| Survival (months) | <24 | 56 | 23 (41.1) | 33 (58.9) | 0.008 |
| ≥24 | 81 | 16 (19.8) | 65 (80.2) | ||
| NDRG2 mRNA expression | Low | 40 | 15 (37.5) | 25 (62.5) | 0.555 |
| Medium | 49 | 14 (28.6) | 35 (71.4) | ||
| High | 23 | 6 (26.1) | 17 (73.9) | ||
| NDRG2 protein expression | Low | 42 | 11 (26.2) | 31 (73.8) | 0.472 |
| Medium | 29 | 11 (37.9) | 18 (62.1) | ||
| High | 17 | 4 (23.5) | 13 (76.5) | ||
aM - methylated; bU - unmethylated
NDRG2 expression is reduced in glioblastoma
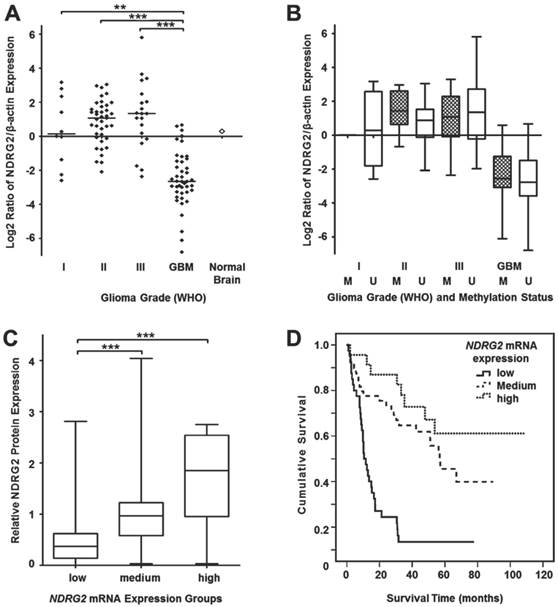
Since our DNA methylation experiments demonstrated a grade-dependent increase in NDRG2 promoter methylation frequency in gliomas, in our next series of experiments, we asked whether the methylation status of the NDRG2 promoter reflects on expression levels of this gene. First, we decided to analyze NDRG2 mRNA levels by using real-time PCR (RT-PCR) technique on mRNA isolated from glioma tumor samples of the same set that has been used for DNA methylation studies. NDRG2 mRNA values determined in 112 gliomas (10 astrocytomas grade I, 39 astrocytomas grade II, 20 astrocytomas grade III and 43 glioblastomas) were normalized to the values of β-actin mRNA, which has been used as an internal control. As shown in Figure 2A, median mRNA NDRG2 expression levels were dramatically reduced in glioblastoma samples to about 10-fold compared to grade I-III gliomas (Kruskal-Wallis test, p<0.0001). Pairwise comparisons of grade I, II and III gliomas using the Kruskal-Wallis test (p>0.05) did not reveal significant differences in NDRG2 mRNA median values in those grades.
Relative NDRG2 mRNA expression in different grade gliomas. (A) Real-time qRT-PCR was used to determine relative NDRG2 mRNA levels in gliomas while using β-actin as an internal control for normalization. Data are expressed as log2 of fold change in NDRG2 mRNA expression compared to the normal brain control (indicated by an unfilled diamond). Horizontal lines mark median expression. Relative mRNA expression was highly downregulated in glioblastomas (GBM) as compared to I, II and III grade astrocytomas (**p<0.01, ***p<0.001). (B) Box plots of relative NDRG2 mRNA expression in different grade glioma sample groups, each stratified by methylation statuses of NDRG2 promoter. The line inside each box represents the median, and the lower and upper edges of the boxes represent the 25th and 75th percentiles, respectively, and upper and lower lines outside the boxes represent minimum and maximum values (error bars). Cross-hatched boxes represent samples with methylated NDRG2 (marked as M), whereas unfilled boxes represent samples with unmethylated NDRG2 (marked as U). (C) The box plot demonstrates relative NDRG2 protein expression in 77 glioma samples stratified by low, medium and high mRNA expression groups. Significant (***p<0.001) correlation was observed between NDRG2 mRNA and protein expression. The plot markings are the same as those in panel B. (D) Kaplan-Meier survival curves representing the overall survival of the whole set of glioma samples (n=112) stratified by mRNA expression levels (low, medium, high); Log-rank test, χ2=31.08, df=2, p=0.0001.
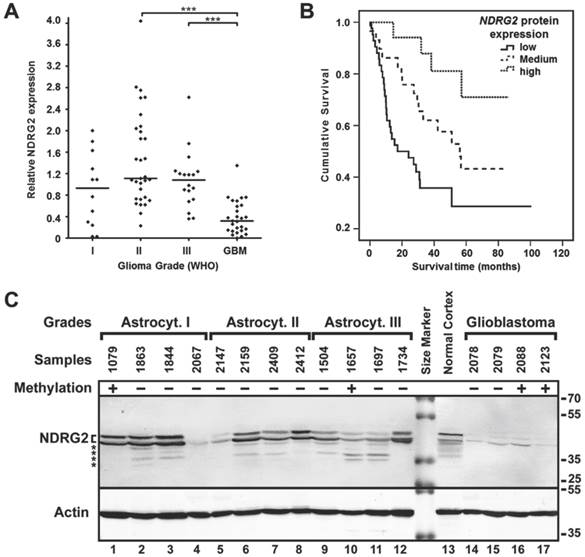
To investigate whether the reduced NDRG2 expression levels detected at mRNA level in highly malignant glioblastomas were associated with reduced NDRG2 protein expression, we decided to perform Western blot analysis on 88 glioma tumors (12 astrocytomas grade I, 31 astrocytomas grade II, 18 astrocytomas grade III and 27 glioblastomas) by using a NDRG2-specific antibody (Figure 3C, please see "Materials and Methods" for details about the experimental setup). Consistent with the mRNA data, NDRG2 protein level was markedly reduced in glioblastomas (to about 3- to 4-fold) as compared to grade I, II and III gliomas (Kruskal-Wallis test, p<0.0001, Figure 3A). Similarly to what has been observed for mRNA levels of NDRG2, differences in NDRG2 protein expression were not significant between grade I, II and III gliomas according to the Kruskal-Wallis test (p>0.05). As a noteworthy observation, the value of the relative NDRG2 protein expression obtained from normal cortex sample (1.6) was closer to the median expression values of grade I, II and III gliomas (1.1, 1.1, and 1.2, respectively) compared to the significantly lower median value of glioblastomas (0.3).
NDRG2 protein expression analysis. (A) NDRG2 protein expression levels in glioma grades I, II, III and IV (GBM). Protein expression was highly downregulated in glioblastomas (GBM) as compared to lower grade (I, II, III) astrocytomas (***p<0.001). (B) Kaplan-Meier survival curves for survival of all glioma patients (n=88) stratified by protein expression (low, medium, high); Log-rank test, χ2=13.4, df=2, p=0.001. (C) Representative Western blot result of NDRG2 protein expression in glioma in one of the sample groups. Methylation status in samples is indicated as (+) methylated, and (-) unmethylated. Positions of two isoforms [33] of NDRG2, β-actin (Actin), kDa values of the protein size marker, and possible degradation products of NDRG2 (asterisks) are indicated.
Next, we analyzed the relationship between NDRG2 transcript levels and NDRG2 protein levels in 77 glioma samples (9 astrocytomas grade I, 29 astrocytomas grade II, 13 astrocytomas grade III and 26 glioblastomas). For this purpose, NDRG2 mRNA expression values were categorized into three expression groups (“low”, “medium” and “high”) compared to the mean value of NDRG2 expression in normal brain tissue: expression values 1.5-fold lower (≤-1.5) compared to the mRNA levels in normal brain were referred to as “low” NDRG2 expression, expression values 1.5-fold higher (>1.5) compared to normal brain were referred to as “high” expression, and values ranging in between (from -1.5 to 1.5) were referred to as “medium” expression. This mRNA expression level classification refers to the log2 scale used in Figure 2. The comparison of NDRG2 protein expression levels in tumors of “low” (n=23), “medium” (n=42) and “high” (n=12) mRNA expression groups demonstrated a significant correlation of NDRG2 transcript level with the NDRG2 protein expression level (Spearman correlation 0.653, p<0.0001, Figure 2C). Taken together, our data shows that: 1) NDRG2 expression is significantly downregulated in glioblastomas at both mRNA and protein levels and 2) expression of this gene is negatively associated with tumor progression.
Correlation analysis of NDRG2 gene promoter methylation, mRNA and protein expression in gliomas
To investigate whether methylation of NDRG2 promoter accounted for the reduced expression of this gene in gliomas, we compared NDRG2 mRNA level values (obtained from RT-PCR experiment) in glioma tumors with methylated NDRG2 promoter with those of which NDRG2 promoter was unmethylated within each malignancy group (Figure 2B). The analysis showed no significant differences in NDRG2 transcript levels when tumors with methylated NDRG2 compared with tumors with unmethylated NDRG2 in all four glioma malignancy grades (Mann-Whitney test, p>0.05). In addition, the comparison of NDRG2 mRNA levels between the group of NDRG2 methylation samples (a total of 35 tumors) and the group of tumors with umethylated NDRG2 (a total of 77) also revealed no significant differences (Chi-square test, p>0.05, Table 1).
Next, we analyzed NDRG2 protein level correlation with gene methylation. For this purpose, NDRG2 protein expression data values have been divided into three categories: values that were lower than 0.75 compared to the total average value (i.e., average immunoblot signal deduced from all tested protein samples, please see “Materials and Methods” for details) were ranked as “low” NDRG2 protein expression, values ranging between 0.75 and 1.5 were considered as “medium” NDRG2 expression, and values that exceeded 1.5 were ranked as “high” NDRG2 expression. In line with mRNA observations, a statistical analysis of the Western blot data showed that the NDRG2 protein expression levels within the group of total 26 tumors with methylated NDRG2 promoter do not differ significantly from the group of total 62 tumors with unmethylated NDRG2 (Chi-square test, p>0.05, Table 1). These findings suggest that NDRG2 gene promoter methylation does not represent as being the major mechanism of gene silencing in gliomas.
Survival analyses
Next, we assessed how changes in NDRG2 promoter methylation and NDRG2 expression reflect on the outcome of glioma patient by using a log-rank test. The follow-up clinical data was available for all of the patients the tumor samples of whom have been analyzed in our study. 81 patients out of 138 had died of their tumors, while 57 patients at the closure of the study were still alive and were censored during the survival analysis. We detected significant differences in survival time between sets of gliomas stratified by NDRG2 methylation status (Log-rank test, χ2=5.99, df=1, p=0.014; Figure 1B). The cumulative 2-year survival rate in unmethylated group was about 65% compared to 42% of surviving patients in methylated group. Median survival time in unmethylated NDRG2 group was 56 months (95% Confidence interval, CI, 29.9-82.3 months), whereas in methylated NDRG2 group the length of survival time was reduced to 20 months (95% CI, 9.0-30.9 months).
Experimental values of relative mRNA and protein expression of NDRG2 categorized into “low”, “medium” and “high” expression groups (described above) were used for survival analysis. We found that the “low” expression level of NDRG2 was significantly associated with the less favorable survival rate compared to the “high” expression group in both mRNA (Log-rank test, χ2=31.08, df=2, p=0.0001; Figure 2D) and protein analyses (Log-rank test, χ2=13.4, df=2, p=0.001; Figure 3B). Median survival time in “low” expression group was 10.5 months (95% CI, 7.3-13.8 months) and 17.2 months (95% CI, 0-34.9 months) in mRNA and protein analysis, respectively. Survival time in patients having tumors expressing “medium” mRNA and protein level was 56.8 months (95% CI, 40.8-72.7 months) and 56.1 months (95% CI, 36.5-75.7 months), respectively. Median survival time in “high” mRNA and protein expression groups could not be determined because more than 50% of patients in those groups were alive at the time of the analysis and survived longer than the overall median level of each group.
Cox univariate regression analysis showed patient age (p=0.0001), glioma pathological grade (p=0.0001), NDRG2 promoter methylation (p=0.016), mRNA transcript level (p=0.0001) and protein expression (p=0.001) as independent variables associated with patient survival (data not shown). These analyses suggest that astrocytoma progression from low to high grade is correlated with NDRG2 gene promoter methylation and reduced mRNA and protein expression in tumor. However, results from multivariate Cox analysis did not confirm this when the NDRG2 methylation status, mRNA level and protein expression level were considered as independent prognostic factors (p>0.05). Thus, future studies with larger sample sizes should be completed to confirm this trend.
Relationship between NDRG2 promoter methylation, mRNA and protein expression and clinical characteristics of glioma patients
Clinicopathological significance of NDRG2 gene methylation and downregulation of NDRG2 expression in gliomas was evaluated by correlating methylation and expression patterns of NDRG2 with clinical parameters of the patient (Table 1 and 2). We found positive significant relationship between NDRG2 gene promoter methylation and older patient age, higher tumor malignancy and shorter survival time (Chi-square test, p<0.05, Table 1). Patients older than 50 years 1.6 times more frequently had tumors with methylated NDRG2 promoter as compared to the younger patients. Nearly half (49%) of glioblastoma patients had tumors with methylated NDRG2, whereas in grade I-III astrocytomas NDRG2 methylation was found in about one-fifth (17%) of tumors. When patients were categorized in two groups according survival time (<24 months and ≥24 months), analysis showed that tumors with methylated NDRG2 promoter were present in 41% of patients surviving less than 2 years after diagnosis. NDRG2 gene promoter methylation did not significantly correlate with patient gender and, as it has already been noted above, NDRG2 mRNA and protein expression values (Chi-square test, p>0.05, Table 1 and 2).
Relationship between NDRG2 protein expression and patient clinical characteristics, NDRG2 methylation and mRNA expression level.
| Number of patients | Protein expression | p-value | ||||
|---|---|---|---|---|---|---|
| Low (%) | Medium (%) | High (%) | ||||
| Cases | 88 | 42 (47.7) | 29 (33.0) | 17 (19.3) | ||
| Sex | Male | 40 | 20 (50.0) | 12 (30.3) | 8 (20.0) | 0.864 |
| Female | 48 | 22 (45.8) | 17 (35.4) | 9 (18.8) | ||
| Age (years) | ≤50 | 49 | 14 (28.6) | 23 (46.9) | 12 (24.5) | 0.0001 |
| >50 | 39 | 28 (71.8) | 6 (15.4) | 5 (12.8) | ||
| Grade | I | 12 | 5 (41.7) | 4 (33.3) | 3 (25.0) | 0.0001 |
| II | 31 | 8 (25.8) | 12 (38.7) | 11 (35.5) | ||
| III | 18 | 5 (27.8) | 10 (55.6) | 3 (16.7) | ||
| GBM | 27 | 24 (88.9) | 3 (11.1) | 0 | ||
| Survival (months) | <24 | 30 | 22 (73.3) | 7 (23.3) | 1 (3.3) | 0.001 |
| ≥24 | 58 | 20 (34.5) | 22 (37.9) | 16 (27.6) | ||
| NDRG2 methylation | aM | 26 | 11 (42.3) | 11 (42.3) | 4 (15.4) | 0.472 |
| bU | 62 | 31 (50.0) | 18 (29.0) | 13 (21.0) | ||
| NDRG2 mRNA expression | Low | 23 | 20 (87.0) | 2 (8.7) | 1 (4.3) | 0.0001 |
| Medium | 42 | 17 (40.5) | 18 (42.8) | 7 (16.7) | ||
| High | 12 | 2 (16.7) | 3 (25.0) | 7 (58.3) | ||
aM - methylated; bU - unmethylated}
We found negative significant relationships between NDRG2 protein expression and older age of the patient, higher tumor malignancy grade and shorter patient survival (Chi-square test, p<0.05, Table 2). Noteworthy, more than 70% of patients older than 50 years had glioma tumors with “low” NDRG2 protein expression, whereas younger patients more often had tumors with NDRG2 expression levels referred to as “medium” and “high”. In glioma grade groups 88.9% of glioblastomas had “low” protein expression pattern as compared to 25-40% of tumors in grade I-III malignancy groups with “low” NDRG2 expression. Correlation analysis with the survival time showed that 73.3 % of patients surviving less than 2 years after diagnosis had tumors with “low” NDRG2 protein expression (Chi-square test, p<0.05). However, no significant correlation was found between NDRG2 protein expression and patient gender (Chi-square test, p>0.05). These results confirm that NDRG2 epigenetic alterations and downregulation of expression are associated with the aggressive behavior of glioma in terms of tumor spread and poor patient survival.
Discussion
In the current study, we used a complex approach to define NDRG2 activity at DNA, RNA and protein levels and its involvement in glioma tumorigenesis. We began our study by defining NDRG2 promoter methylation status in different grade glioma samples. We have determined 14-20% NDRG2 methylation frequency in grade I-III gliomas, whereas methylation markedly increased to 49 % in grade IV glioblastomas (Figure 1A). In addtion to studies in glioblastoma, a number of studies using various techniques have shown frequent NDRG2 promoter methylation in different cancer cell lines and tumor tissues such as anaplastic meningiomas (20%), liver cancer (77%), colon cancer (27%), oral squamous cell carcinoma (62%), colorectal (64%) and gastric cancer (54%) [4, 13, 24-27]. NDRG2 promoter methylation was observed to be associated with higher malignancy grade in meningiomas, colon cancer, gastric cancer and, in agreement with our findings, in glioma tumors [4, 5, 24, 27]. The current study showed significant positive correlation between NDRG2 methylation and patient age in gliomas. Moreover, correlation analysis revealed that higher frequency of gene methylation was more often observed in higher malignancy grade tumors and that methylation was more frequently associated with shorter survival time (Table 1). Further survival analysis in this study, in which we included tumors of different malignancy grade, demonstrated significant correlation between NDRG2 promoter methylation and poor patient outcome (Figure 1B). This is in contrast to earlier findings [5, 22], where studies on NDRG2 promoter methylation and patient survival have been done with the focus on glioblastoma alone.
Along with the changes in promoter methylation frequency, we also observed a marked decrease in NDRG2 expression at mRNA level in glioblastomas as compared to normal brain and grade I-III gliomas. Similarly, NDRG2 expression at protein level was observed to be highly downregulated in glioblastomas as compared to grade I-III gliomas. NDRG2 protein expression profiles strongly correlated with those of mRNA (Figure 2C). It should be noted, however, that sharp decrease in NDRG2 protein expression, in addition to glioblastoma samples, has also been observed in individual samples of grade I-III gliomas. Several studies have shown low or undetectable NDRG2 expression in a number of human cancers including liver cancer, colon cancer, hepatocellular carcinoma, breast cancer, and squamous cell carcinoma [13, 16, 24, 28, 29]. Kaplan-Meier analysis indicated poor outcome for patients with reduced NDRG2 expression at both mRNA and protein level (Figures 2D and 3B, respectively), suggesting that gene downregulation have clinical importance in gliomas. In line with our observations, other studies by using immunohistochemical method have shown a negative correlation between NDRG2 expression level and glioma grade, and positive correlation with patient survival time [6, 7]. Taken together, our results support the evidence provided by other laboratories that NDRG2 expression is frequently reduced in clinically aggressive types of gliomas and that the gene is involved in gliomagenesis.
Molecular mechanisms underlying the downregulation of NDRG2 are yet to be elucidated. Several studies suggested the promoter methylation being the major cause of the loss of NDRG2 expression in meningioma, hepatocellular carcinoma, colon cancer, oral squamous cell carcinoma, colorectal cancer, as well as in glioma [4, 5, 13, 24-26]. In contrast to the earlier observations, our study have not found relationship between NDRG2 gene promoter methylation and expression of this gene at both mRNA level (Figure 2B) and protein level (correlation analysis not shown) in gliomas stratified by grades. Moreover, correlation analysis between gene methylation, mRNA and protein expression showed no association in the whole glioma sample as well (Table 1 and Table 2). Among possible explanations of the discrepancy between NDRG2 methylation and expression data could be intratumoral heterogeneous methylation pattern and normal cells (normal tissue and infiltrating white blood cells) contaminating tumor tissue. The discussed discrepancies do not exclude the possibility that NDRG2 promoter may be subjected to epigenetic silencing through DNA methylation, however, our data suggest that additional mechanisms of regulation could be responsible for differential expression of NDRG2. For example, it has been reported that DNA alterations, such as mutations and genomic deletions, may deregulate gene expression in breast cancer cell lines [30]. Loss of chromosome 14q, where the NDRG2 gene is located, is a common feature in different tumor types including astrocytic tumors [31]. An alternative regulatory mechanism for NDRG2 expression has been demonstrated in the study by Feng et al. [26], where it has been shown that NDRG2 expression in colon cancer was downregulated by microRNAs, whereas Yamamura et al. [32] found that histone modification by deacetylation in pancreatic cancer cell lines is yet another mechanism for downregulating NDRG2. Therefore, given the plethora of different mechanisms, of regulation of NDRG2 expression, including DNA methylation, future studies should clarify which of these possible mechanisms, if any in particular, could be delineated as major determinants of NDRG2 activity.
In conclusion, our findings highlight the usefulness of combining epigenetic data to gene expression patterns at mRNA and protein level in tumor biomarker studies, and suggest that NDRG2 downregulation might bear influence on glioma tumor progression while being associated with higher malignancy grade.
Abbreviations
NDRG2: N-myc downstream regulated gene 2; WHO: World Health Organization; MSP: methylation-specific PCR; CI: confidence interval.
Acknowledgements
We kindly thank student of bachelor studies of VMU Mr. Evaldas Simanavičius for help in gene methylation investigation. We also heartily thank Ms. Lina Piličiauskienė and Ms. Jūratė Žeglienė from LUHS for assistance in tissue biobanking and patient clinical data gathering.
Financial Support
This research was funded by a grant (No. LIG-11/2012) from the Research Council of Lithuania.
Competing Interests
The authors have declared that no competing interest exists.
References
1. Krex D, Klink B, Hartmann C, von Deimling A, Pietsch T, Simon M. et al. Long-term survival with glioblastoma multiforme. Brain: a journal of neurology. 2007;130:2596-606
2. Noushmehr H, Weisenberger DJ, Diefes K, Phillips HS, Pujara K, Berman BP. et al. Identification of a CpG island methylator phenotype that defines a distinct subgroup of glioma. Cancer cell. 2010;17:510-22
3. Phillips HS, Kharbanda S, Chen R, Forrest WF, Soriano RH, Wu TD. et al. Molecular subclasses of high-grade glioma predict prognosis, delineate a pattern of disease progression, and resemble stages in neurogenesis. Cancer cell. 2006;9:157-73
4. Lusis EA, Watson MA, Chicoine MR, Lyman M, Roerig P, Reifenberger G. et al. Integrative genomic analysis identifies NDRG2 as a candidate tumor suppressor gene frequently inactivated in clinically aggressive meningioma. Cancer research. 2005;65:7121-6
5. Tepel M, Roerig P, Wolter M, Gutmann DH, Perry A, Reifenberger G. et al. Frequent promoter hypermethylation and transcriptional downregulation of the NDRG2 gene at 14q11.2 in primary glioblastoma. International journal of cancer Journal international du cancer. 2008;123:2080-6
6. Li W, Chu D, Chu X, Meng F, Wei D, Li H. et al. Decreased expression of NDRG2 is related to poor overall survival in patients with glioma. Journal of clinical neuroscience: official journal of the Neurosurgical Society of Australasia. 2011;18:1534-7
7. Li L, Wang J, Shen X, Wang L, Li X, Liu Y. et al. Expression and prognostic value of NDRG2 in human astrocytomas. Journal of the neurological sciences. 2011;308:77-82
8. Hwang J, Kim Y, Kang HB, Jaroszewski L, Deacon AM, Lee H. et al. Crystal structure of the human N-Myc downstream-regulated gene 2 protein provides insight into its role as a tumor suppressor. The Journal of biological chemistry. 2011;286:12450-60
9. Lorentzen AB, Mitchelmore C. NDRG2: A Candidate Tumor Suppressor Gene in Search of a Function. Cancer Reports. 2012;2:9-17
10. Mitchelmore C, Buchmann-Moller S, Rask L, West MJ, Troncoso JC, Jensen NA. NDRG2: a novel Alzheimer's disease associated protein. Neurobiology of disease. 2004;16:48-58
11. Li Y, Shen L, Cai L, Wang Q, Hou W, Wang F. et al. Spatial-temporal expression of NDRG2 in rat brain after focal cerebral ischemia and reperfusion. Brain research. 2011;1382:252-8
12. Deng Y, Yao L, Chau L, Ng SS, Peng Y, Liu X. et al. N-Myc downstream-regulated gene 2 (NDRG2) inhibits glioblastoma cell proliferation. International journal of cancer Journal international du cancer. 2003;106:342-7
13. Lee DC, Kang YK, Kim WH, Jang YJ, Kim DJ, Park IY. et al. Functional and clinical evidence for NDRG2 as a candidate suppressor of liver cancer metastasis. Cancer research. 2008;68:4210-20
14. Wang L, Liu N, Yao L, Li F, Zhang J, Deng Y. et al. NDRG2 is a new HIF-1 target gene necessary for hypoxia-induced apoptosis in A549 cells. Cellular physiology and biochemistry: international journal of experimental cellular physiology, biochemistry, and pharmacology. 2008;21:239-50
15. Liu J, Zhang J, Wang X, Li Y, Chen Y, Li K. et al. HIF-1 and NDRG2 contribute to hypoxia-induced radioresistance of cervical cancer Hela cells. Experimental cell research. 2010;316:1985-93
16. Cao W, Yu G, Lu Q, Zhang J. Low expression of N-myc downstream-regulated gene 2 in oesophageal squamous cell carcinoma correlates with a poor prognosis. BMC cancer. 2013;13:305
17. Shi H, Li N, Li S, Chen C, Wang W, Xu C. et al. Expression of NDRG2 in esophageal squamous cell carcinoma. Cancer science. 2010;101:1292-9
18. Chu D, Zhang Z, Li Y, Wu L, Zhang J, Wang W. et al. Prediction of colorectal cancer relapse and prognosis by tissue mRNA levels of NDRG2. Molecular cancer therapeutics. 2011;10:47-56
19. Ma JJ, Kong LM, Liao CG, Jiang X, Wang Y, Bao TY. Suppression of MMP-9 activity by NDRG2 expression inhibits clear cell renal cell carcinoma invasion. Medical oncology. 2012;29:3306-13
20. Song SP, Zhang SB, Liu R, Yao L, Hao YQ, Liao MM. et al. NDRG2 down-regulation and CD24 up-regulation promote tumor aggravation and poor survival in patients with gallbladder carcinoma. Medical oncology. 2012;29:1879-85
21. Li SJ, Wang WY, Li B, Chen B, Zhang B, Wang X. et al. Expression of NDRG2 in human lung cancer and its correlation with prognosis. Medical oncology. 2013;30:421
22. Skiriute D, Vaitkiene P, Asmoniene V, Steponaitis G, Deltuva VP, Tamasauskas A. Promoter methylation of AREG, HOXA11, hMLH1, NDRG2, NPTX2 and Tes genes in glioblastoma. Journal of neuro-oncology. 2013;113:441-9
23. Louis DN, Ohgaki H, Wiestler OD, Cavenee WK, Burger PC, Jouvet A. et al. The 2007 WHO classification of tumours of the central nervous system. Acta neuropathologica. 2007;114:97-109
24. Piepoli A, Cotugno R, Merla G, Gentile A, Augello B, Quitadamo M. et al. Promoter methylation correlates with reduced NDRG2 expression in advanced colon tumour. BMC medical genomics. 2009;2:11
25. Furuta H, Kondo Y, Nakahata S, Hamasaki M, Sakoda S, Morishita K. NDRG2 is a candidate tumor-suppressor for oral squamous-cell carcinoma. Biochemical and biophysical research communications. 2010;391:1785-91
26. Feng L, Xie Y, Zhang H, Wu Y. Down-regulation of NDRG2 gene expression in human colorectal cancer involves promoter methylation and microRNA-650. Biochemical and biophysical research communications. 2011;406:534-8
27. Chang X, Li Z, Ma J, Deng P, Zhang S, Zhi Y. et al. DNA methylation of NDRG2 in gastric cancer and its clinical significance. Digestive diseases and sciences. 2013;58:715-23
28. Zheng J, Li Y, Yang J, Liu Q, Shi M, Zhang R. et al. NDRG2 inhibits hepatocellular carcinoma adhesion, migration and invasion by regulating CD24 expression. BMC cancer. 2011;11:251 1-9
29. Lorentzen A, Lewinsky RH, Bornholdt J, Vogel LK, Mitchelmore C. Expression profile of the N-myc Downstream Regulated Gene 2 (NDRG2) in human cancers with focus on breast cancer. BMC cancer. 2011;11:14
30. Liu N, Wang L, Liu X, Yang Q, Zhang J, Zhang W. et al. Promoter methylation, mutation, and genomic deletion are involved in the decreased NDRG2 expression levels in several cancer cell lines. Biochemical and biophysical research communications. 2007;358:164-9
31. Hu J, Pang JC, Tong CY, Lau B, Yin XL, Poon WS. et al. High-resolution genome-wide allelotype analysis identifies loss of chromosome 14q as a recurrent genetic alteration in astrocytic tumours. British journal of cancer. 2002;87:218-24
32. Yamamura A, Miura K, Karasawa H, Morishita K, Abe K, Mizuguchi Y. et al. Suppressed expression of NDRG2 correlates with poor prognosis in pancreatic cancer. Biochemical and biophysical research communications. 2013;441:102-7
33. Herskowitz JH, Seyfried NT, Duong DM, Xia Q, Rees HD, Gearing M. et al. Phosphoproteomic analysis reveals site-specific changes in GFAP and NDRG2 phosphorylation in frontotemporal lobar degeneration. Journal of proteome research. 2010;9:6368-79
Author contact
![]() Corresponding author: Dr. Arunas Kazlauskas, Laboratory of Neurooncology and Genetics, Neuroscience Institute, Medical Academy, Lithuanian University of Health Sciences, Eiveniu str.4, Kaunas, LT-50009, Lithuania. Phone: +370 637 51423; E-mail: arunas.kazlauskaslt
Corresponding author: Dr. Arunas Kazlauskas, Laboratory of Neurooncology and Genetics, Neuroscience Institute, Medical Academy, Lithuanian University of Health Sciences, Eiveniu str.4, Kaunas, LT-50009, Lithuania. Phone: +370 637 51423; E-mail: arunas.kazlauskaslt