Impact Factor ISSN: 1837-9664

 Global reach, higher impact
J Cancer 2014; 5(7):548-558. doi:10.7150/jca.9315 This issue Cite
Research Paper
Metastatic Hepatocarcinoma He/De Tumor Model in Rat
Gyorgy Trencsenyi1, Terez Marian1, Fruzsina Bako1, Miklos Emri1, Gabor Nagy2, Pal Kertai3, Gaspar Banfalvi2 ![]()
1. Department of Nuclear Medicine, University of Debrecen;
2. Department of Microbial Biotechnology and Cell Biology, University of Debrecen;
3. Department of Preventive Medicine, University of Debrecen.
Received 2014-4-7; Accepted 2014-5-6; Published 2014-6-21
Abstract
The aim of this study is to select among potential tumor models that could be suitable to follow the metastatic spead of tumor cells. 18FDG-PET tumor diagnostic test has been adapted to investigate tumor growth in vivo in local and metastatic rat models. Materials and Methods. The expression of glucose transporters was traced by immunohistological analysis, followed by the uptake of 18FDG and visualized by MiniPET scanner. After s.c. administration of hepatocarcinoma (He/De) cells intensive local tumor growth and 18FDG uptake were measured. Results: Whole body 18FDG-PET imaging supported by histological analysis have shown that subcutaneously growing tumors did not project metastases to other sites from the injected area. To avoid local tumor formation i.v. injection was chosen, but did not improve the safety of tumor cell administration. Tumor formation after i.v. injection took a longer time than after s.c. administration. Tumors upon i.v. generation were smaller and detectable in liver and lung, but not in other organs or tissues. iii) Subrenally implanted He/De cells spread from the retroperitoneal primary tumor of the kidney to thoracal paratymic lymph nodes (PTNs). The spread from primary site to metastatic tumors in PTNs was confirmed by post mortem surgery and histological examinations. Conclusion: Among the three methods applied: a) Local s.c. administration of tumor cells generated local tumors unsuitable to study metastasis. b) Intravenous administration causing unpredicatable location of tumor formation is not regarded a reliable metastatic tumor model. c) Subreanal implantation model proved to be a suitable model to follow the metastatic process in rats.
Keywords: transplantation, metastatic models, tumor diagnostics, subrenal capsule model, miniPET, immunohistochemistry.
Introduction
There are different ways to introduce tumor cells in experimental animals. One of the major groups of transplantations is represented by those methods that place tumor cells in tissues of rodents. Among these methods are local subcutaneous (s.c.), intradermal (i.d.) and intramuscular (i.m.) injections. Local implantations may or may not generate metastasis. Based on the seed and soil hypothesis the orthotopic implantation of tumors to the same tissue of host mice, it would be expected that they mimicked more closely human tumor development [1]. Orthotopic implantations were expected to be more useful to develop into metastasis than ectopic ones. Indeed limited efficiency of ectopic implants placed in non-identical tissues was demonstrated by injecting colorectal tumor cells into the lymphoid follicle of the cecum [2], carcinoma cells in the kidney or under the capsule of kidney [3], or osteosarcoma cell into bone [4]. In orthoptotic models tumor growth was often too fast and required the surgical removal of primary tumor to prevent the death of tumorous animals [5]. Spontaneous metastatic models have been divided in two groups: 1) primary tumor left in the animal till the end of the experiment, 2) primary tumor removed to detect the growth of the metastasis. The timing of primary tumor removal is greatly impacting the results as the size of the primary tumors is proportional to the probability of metastatic development [6].
An advantage of the progression of tumors generated by i.v. administration is that it can be used to study the theory of seed and soil. This theory is related to the clonal expansion of metastasized cells as a consequence of modified gene expression in these cells, whereas in primary tumors the microenvironment plays a decisive role in tumor progression [7]. The seed and soil theory was supported by tumor cell lines that consistently disseminated to the liver, adrenal gland, bone marrow, but not to the lungs upon tail vein injection [8]. Although, the introduction of tumor cell lines to the circulatory system might be adventageous in the development of metastatic variants of increasing metastatic potential [9, 10], a serious drawback of these models is that they are lacking the early steps of the metastatic cascade.
To provide experimental tools to study metastasis, in vivo animal models turned out to be indispensible, as the development of animal tumors follows the same common pathway as those of human tumors. Due to the natural multitude and complexity of animal tumors, it would be impossible to use a single model to describe the whole process and necessitates a careful selection and application among models. The chicken chorioallantois-membrane model is one of the oldest metastasis models to study metastasis [11]. The advantage of simplicity is contrasted by its suitability questioning whether the evolutionary gap between birds and mammalians can be bridged by comparing their tumors. To study in vivo metastasis, we have established mammalian tumor cell lines, among them the hepatocarcinoma (He/De), the nephroblastoma (Ne/De), the melanoma (Me/De), the myeloblastic nephroma (My1/De and My2/De) cell lines. These cell lines made it possible: a) to implant exact number of tumor cells under the renal capsule of rats by placing them on GelasponR gelatin sponge, b) to follow the kinetics and c) the temporal aspects of tumor growth. The He/De and Ne/De models led to the recognition that tumor growth was accompanied by the infiltration of tumor cells to the parathymic lymph nodes [12]. This observation raised the question as to how tumor cells move from primary tumors to distant organs and tissues.
In this paper we test different types of administrations of hepatocarcinoma (He/De) tumor cells to rats to decide which model would be the most suitable to mimic not only tumor development, but also the metastatic spread. Among the administrations local tumor formation was induced by subcutanous injection, tumor formation in distant locations by intravenous injection and syngenic implantation of He/De tumor cell line under the kidney capsule causing tumor metastasis in the thoracal parathymic lymph nodes (PTNs).
Materials and methods
Chemicals
N-nitroso-dimethylamine, collagenases type I, hyaluronidase type IV, DNase I, penicillin and streptomycin were purchased from Sigma-Aldrich Co. (St. Louis, MO). Growth media and gentamicin were obtained from GIBCO BRL., Life Technologies (Gaithersburg, MD). Collagenase Medium consisted of RPMI 1640 medium containing 0.1% collagenase type I, 0.01% hyaluronidase type IV, 0.01% DNase I, 100 U/ml penicillin and 100 µg/ml streptomicin. Bovine serum albumin (BSA) was the product of Fermentas International Inc. (Burlington, Canada). Polyclonal rabbit anti-rat-GLUT-1, anti-rat-GLUT-3 and anti-TGF ß-1 were bought from Abcam Inc. (Cambridge, MA, USA). Texas red-conjugated anti-rabbit secondary antibody and Vectashield Hard Set mounting medium containing DAPI were from Vector Laboratories, Ltd. (Peterborough, England).
Phospate buffered saline (PBS) contained: 140 mM NaCl, 5 mM KCl, 8 mM Na2HPO4 at pH 7.3. Phosphate buffered saline with Tween (PBST) consisted of 0.1% Tween 20, 20 mM Na2HPO4, 115 mM NaCl; pH 7.4. The collagenase Solution for perfusion contained 30 mg collagenase type IV in 100 ml PBS solution.
Experimental tumor growth in rats
Hepatocellular tumor formation was induced by N-nitrosodimethylamine causing liver, kidney, and occasionally lung cancers [13, 14]. Hepatocarcinoma (He/De) and nephroblastoma (Ne/De) cell lines were established from N-nitrosodimethylamine induced rat tumor [15]. Experimental surgery and subrenal implantation of He/De cells were performed as described [16, 17]. Autopsy was carried out 6, 12 or 18 days later after euthanization of rats with urethane overdose. To follow tumor growth and spread we have used 18FDG positron emission tomography that proved to be the standard in metabolic imaging of a) enhanced glycolysis, b) utilization of glucose greater than background tissue, c) and the detection of primary and metastatic tumors.
Ethics statement
Male and female inbread Fischer 344 rats were kept in a conventional laboratory environment and fed on a semi-synthetic diet (Charles-River, Mo, Kft, Godollo, Hungary) and tap water ad libitum. All animals were cared for following the criteria outlined in the UK ”Guide for the Care and Use of Laboratory Animals” [18], authorized by the Ethical Committee for Animal Research, University of Debrecen.
Establishment of He/De cell line
The establishment of He/De cell line was described earlier [15]. Briefly, freshly resected hepatocarcinoma (He/De) tissue was minced into small (2x2x2 mm) pieces, digested with collagenase medium, filtered through sterile gauze, washed and suspended in RPMI 1640 medium supplemented with 10% FBS and antibiotics. After overnight incubation at 37oC in a CO2 incubator, the nonadherent cells were discarded and the adherent cells subcultured. After 20 subcultures the new hepatocarcinoma He/De cell line was established.
Surgical implantation of He/De cells
The aim of the experimental surgery (Subrenal Capsule Assay - SRCA) was to place He/De cells under the capsule of the left kidney and to follow metastatic tumor spread. This was performed by placing 106 He/De cells in 10 μl saline on GelasponR disc. Animals were anesthesized by i.p. administration of 3mg/100g pentobarbital (Nembutal, Ceva-Phylaxia Rt. Budapest, Hungary). The tumor cell-containing disc or lymph node was placed under the renal capsule of the left kidney. The kidney was placed back in the retroperitoneum and the operative field was subjected to post-operative treatment. Subcutaneous tumor formation was initiated by the s.c. injection of 106 hepatocarcinoma (He/De) cells into rats. The third way of tumor induction was the injection of 106 He/De cell via the femoral vein. Animals were euthanized before dissection by an i.p. 300 mg/kg overdose of Nembutal.
Measurement of accumulation of glucose analog
Radiotracer synthesis. Chemically known as 2-deoxy-2-(18F)fluoro-D-glucose, 18FDG is a positron-emitting radioactive isotope glucose analogue, where fluorine-18 is substituted for the normal hydroxyl group at the 2' position in the glucose molecule. The glucose analog 18FDG was synthesized and labeled with the positron-decaying isotope 18F [19]. Radiotracer was synthesized in our Department of Nuclear Medicine.
MiniPET examinations. For the visualization of tumors their high metabolic rate and 18FDG uptake were utilized [20-22]. The MiniPET-II camera was developed in a joint project by the Department of Nuclear medicine, University of Debrecen, by the Nuclear Research Institute of the Hungarian Academy of Sciences and by the MEDISO Kft, Budapest, Hungary. The MiniPET-II camera consists of 12 detector moduls, 12x35x35 LYSO scintillation crystals of 1.1 mm resolution with a 5x5 cm field of view. Experimental animals were given i.v. 7.4±1.2 MBq 18FDG. After 1 h animals were narcotized with 3 mg/100 g pentobarbital. PET data were collected for 10 min from the area of the tumor and the thorax. Evaluation was made with the help of the BrainCad software. Single frame PET scans were performed for 20 min using the MiniPET-II small animal PET scanner [23].
In vivo uptake of 18FDG glucose analogue. Radiotracer uptake was expressed as Standardized Uptake Values (SUVs). The estimation of T/M mean comes from the ratio of tumor SUV mean versus background muscle SUV mean. Ellipsoidal 3-dimensional regions of interest (ROI) were manually drawn around the edge of the tumor activities by visual inspection using the BrainCad software (http:/www.minipetct.hu). Assuming a tissue density of 1g/cm3 the standardized uptake value (SUV) was calculated as:
SUV = [ROI activity (Bq/ml)] / [injected activity (Bq)/animal weight (g)]
Immunohistological staining
The increased uptake of glucose and its 18FDG analogue is accounted for by the elevated expression of glucose transporters (GLUT 1-12) found in the membranes of different tissues and responsible for the transport of glucose across the membrane of their cells [24]. In accordance with the increased glucose uptake in tumor bearing tissues the activities of GLUT transporters, especially those of GLUT-1 and GLUT-3 are significantly higher relative to normal tissues [25]. Transforming growth factor beta 1 (TGF-β1) is a secreted polypeptide member of cytokines performing many cellular functions, including the control of cell growth, cell proliferation, cell differentiation and apoptosis. The expression of GLUT-1, GLUT-3 and TGF-ß1 proteins was detected in control kidney and in tumorous kidney 14 days after implantation of He/De tumors and in He/De tumor cells.
Results
Local tumor formation after s.c. administration of He/De cells
Tumor formation was initiated by the s.c. injection of 106 hepatocarcinoma (He/De) cells into rats. After a lagging period intensive tumor formation was observed and 6 days after the injection the tumor became palpable (41±4.2 mm3), and by day 18 it was grown to nearly 3 cm3 (Fig. 1A). Further local tumor growth would have caused the death of animals. Thus, based on ethical considerations after 18 days rats were euthanized by over-narcotization.
Tumor formation and histological staining after s.c. administration of He/De cells. A. Growth kinetics of local tumor formation (n=3). B. 18FDG-SUV mean values of subcutaneously growing primary tumors. For the estimation of T/M mean the ratio of tumor SUV mean versus background muscle SUV mean were used (n=3). C. Visualization of tumor formation by 18FDG-MiniPET camera in Fischer 344 rat. a) 18FDG-PET image before administration of He/De cells. Black arrow is pointing to the site of injection of He/De cells. b, c, d). Red arrows show the growing tumor at the site of injection after 6, 12 and 18 days. The Standardized Uptake Value (SUV) of 18FDG was used in PET imaging as a simple semi-quantitative analysis [26]. SUV represents the ratio of the actual radioactivity concentration found in a selected part of the body at a certain time point, and the radioactivity concentration in the hypothetical case of an even distribution of the injected radioactivity across the whole body. D. Histological staining of subcutaneously growing hepatocellular He/De carcinoma. Panel a) Hematoxilin-eosin staining of subcutaneously growing hepatocellular He/De carcinoma 18 days after tumor cell implantation. Panel b) Immunofluorescent staining of subcutaneously growing hepatocellular He/De carcinoma tumor with GLUT-1 transporter and Texas red background staining. Bar: 50 μm, each.
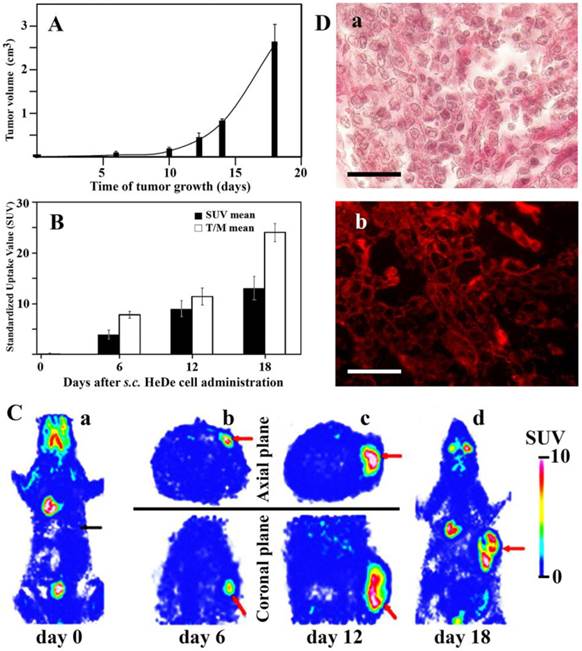
In the control experiment rats were given in the caudal vein 18FDG (7.4±1.2 MBq) before the s.c. administration of tumor cells and 1 h later whole body imaging was performed with the MiniPET camera. The intensive growth of subcellular hepatocarcinoma tumor was detected by glucose metabolism represented by the 18FDG uptake as SUV values. Six days after tumor cell administration the 18FDG SUV mean value was 3.8±0.9, and the tumor to mediastinal 18FDG uptake (T/M) ratio 7.8±0.7. These values increased by day 18 to SUV mean 12.9±2.4, and to a T/M mean 24±1.8 (Fig. 1B). Accumulation of the radiopharmacon was observed 18 days after tumor cell injection in metabolically active organs including the brain (SUV mean: 2.87±0.39), the Harderian gland (specialized lacrimal gland found within the eye's orbit) (SUV mean: 6.54±1.81), heart muscle (SUV mean: 6.72±1.44), in the bone marrow (SUV mean: 2.29±0.45) and excreted in the urine (SUV mean: 41.77±3.29) and guts (SUV mean: 1.15±0.21). Chronic accumulation that would have indicated infection or spontaneous tumor formation was not found.
Static 18FDG-PET exposures were taken at the site of tumor formation in the sagittal and coronal planes 0, 6, and 12 days following the s.c. injection of He/De cells (Fig. 1C/a,b,c). Whole body 18FDG-PET imaging was repeated 18 days after tumor cell injection to visualize potential metastasis formation (Fig. 1C/d). The analysis of these images has unanonimously shown that subcutaneously growing tumors did not project metastases to other sites from the injected area. With the exception of subcutaneous tumor, only physiological amounts of 18FDG were found in these animals. This finding was supported by post mortem examinations. The conclusion was drawn from these experiments that local injection of tumor cells generates local tumors, and this type of administration is unsuitable to study metastasis.
Histological analysis of subcutaneous tumors
Figure 1D/a shows the subcutaneously growing hepatocellular He/De carcinoma stained with hematoxilin-eosin. Post mortem analysis also included the histological expression of GLUT-1 protein that is one of the major glucose carriers responsible for transporting 18FDG into cells. High expression of GLUT-1 transporter in He/De tumor tissue is shown in Fig. 1D/b.
Tumor formation after i.v. tumor cell administration
After i.v. administration of tumor cells local tumor formation was seen at the site of the injection. To improve the safety of i.v. tumor cell administration and to avoid local tumor formation the femoral vein was chosen rather than the caudal one. Even in this case local tumor formation was observed in four out of ten rats at the site of injection caused by the damage of the femoral vein where the HeDe cells were injected (Fig. 2A).
Tumor formation in rat upon injecting He/De cells in the femoral vein. A. Local tumor formation. a) Tumor formation seen at the site of femoral vein injection. b) Surgical visualization of local tumor formation at the site of i.v. injection. Black arrows indicate the He/De primary tumor at the left hind leg. The tip of the blue needle shows the site of injection. B. 18FDG-PET photographs taken after i.v. injection in Fischer 344 rats and post mortem examinations. a) Control: 18FDG-PET image before the injection of He/De cells. b) 18FDG-PET image 18 days and c) 20 days after intravenal application of He/De tumor cells. d) Tumorous lesions in the lung (black arrows), tumor formation in the liver (yellow arrows) 24 days after tumor cell administration. C. He/De tumor cells infiltrated in the liver 24 days after He/De i.v. administration. a) Hematoxilin-eosin staining. Yellow arrow points to the healthy liver tissue, black arrows are directed towards the invasion of tumor cells with large disruptions outside and inside the tumor. b) Visualization GLUT-1 transporters in liver tumor stained with Texas red. Bars: 50 μm, each.
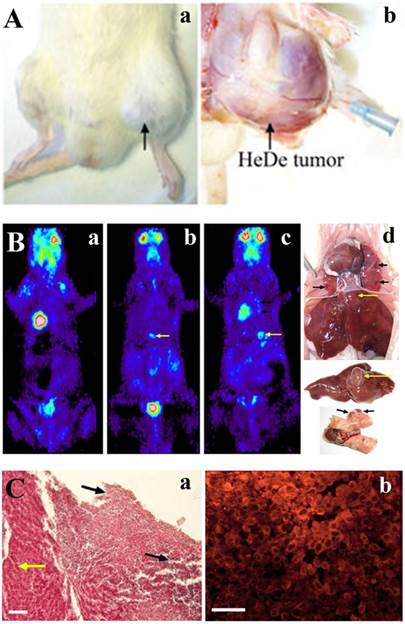
Fischer 344 rats were given through the caudal vein 106 He/De cells. At different periods of time after injection, 18FDG-PET pictures were taken to follow tumor growth. Of the ten rats used in these experiments tumor formation was detected only in six animals localized in the liver and in the lung. Fig. 2B/a shows the distribution of the radiotracer glucose analogue before tumor cell administration. The first identifiable tumor appeared in the liver 18±2 days after the injection of tumor cells (Fig. 2B/b). The SUV mean value for liver tumors was 4.04±0.44, and the mean T/M value 8.8±2.08. The tumor formation took longer time than after s.c. administration of tumor cells. Liver tumor became detectable after 20±3 days (Fig. 2B/c). Tumorous lesions were seen in the lung (black arrows) and tumor formation in the liver (yellow arrows) 22±3 days after tumor cell administration (Fig. 2B/d). The SUV mean value for malignant lung tumors was 2.4±0.4 and T/M mean 6.7±1.07. The tumors formed after i.v injections were significantly smaller relative to those caused by the s.c. application of tumor cells. The average volume of the lung tumors was 13.5±3.4 mm3 and those of liver tumors 48.0±5.4 mm3. Tumor formation was not found in other organs or tissues. After 24 days of tumor cell administration liver injury was confirmed histologically by the tumorous infiltration of He/De cells (Fig. 2C/a). Immunofluorescent staining confirmed the overexpression of GLUT-1 protein in the infiltrated tumor (Fig. 2C/b).
Subrenal Capsule Assay (SRCA)
Experimental surgery was performed to place gelatin disc (GelasponR) containing He/De tumor cells (106) under the capsule of the left kidney of rats (Fig. 3A). The implantation of tumor cells under the subrenal capsule (Fig. 3A/a-c) induced an intensive growth of He/De cells observed as primary tumor at the site of insertion (Fig. 3A/d).
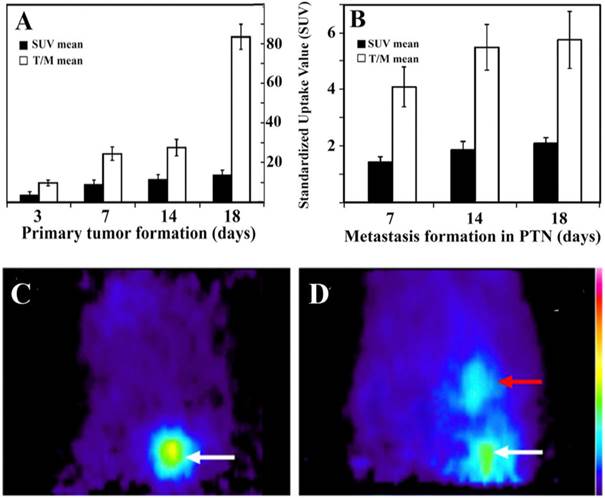
Tumor growth after subrenal implantatation of He/De cells. A. During the experimental surgery technique known as Subrenal Capsule Assay (SRCA): a) the left kidney of the rat was exposed, b) GelaspongeR disc containing 106 He/De cells was placed under the capsule of kidney, c) kidney containing the implanted tumor cells was placed back in the retroperitoneum and the operative field was subjected to post-operative treatment, d) primary tumor formation 7 days after He/De cell implantation. B. Sagittal images of 18FDG-PET before and after implantation of He/De cells under the capsule of left kidney of rats. a) miniPET image before He/De cell implantation. PET images 3 days (b), 7days (c), 14 days (d) and 18 days (e) after implantation. White arrows indicate the heart, black arrows the primary tumor in kidney, red arrows metastases in parathymic lymph nodes (PTNs).
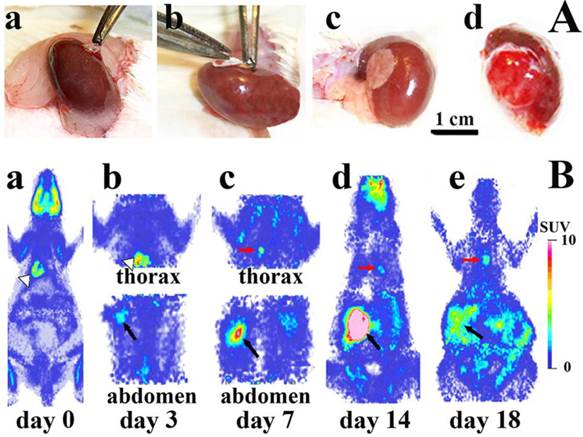
Intensive primary tumor growth was seen after the implantation of 106 He/De cells under the subrenal capsule of rats (abdominal parts in Fig. 3B/a-e). Accumulation of 18FDG in the primary tumor under the left kidney was measurable with the MiniPETII camera 3 days after tumor cell implantation (1.7±0.5 SUV mean, 4.9±0.7 T/M mean). Glucose metabolism of the primary tumor increased on day 14 to a SUV mean of 5.7±1.3 and T/M mean 13.8±2.1. After day 14 only the primary tumor and the thoracal lymph nodes showed further 18FDG accumulation. The primary tumor became palpable 7 days after He/De cell transplantation (38±3.4 mm3), and its abdominal distribution exceeded 2000 mm3 after 18 days.
18FDG-MiniPET examinations also provided information with respect to the spread of the He/De tumor cells from the site of the retroperitoneal primary tumor of the kidney to the thoracal site of the first metastasis (thoracal parts in Fig. 3B/a-e). The first detectable metastasis was seen in the thorax (Fig. 3B/a, b, c). The metastatic infiltration of He/De cells to the thoracal cavity became detectable 7±1 days after tumor cell implantation (Fig. 3B/c).
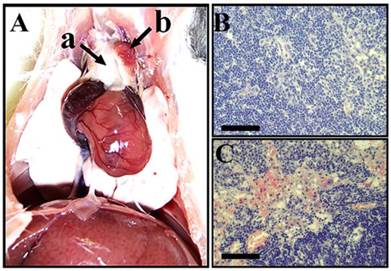
The site of metastasis was identified after post mortem surgery as the parathymic lymph node (Fig. 4). The weight of the thymus did not change suggesting that it was not involved in the metastatic spread of He/De cells (Fig. 4A/a). The weight of parathymic lymph nodes increased enormously from the control 23.5±2.5 mg to 1.5-2.0 g of the tumor bearing PTNs (Fig. 4A/b). The histological pictures of control and tumorous PTNs differed significantly. Contrary to the relatively homogeneous distribution of cells in control PTN (Fig. 4B), the tumorous PTN contained disruptions with infiltrations of red blood cell (Fig. 4C).
Metastasis in parathymic lymph nodes upon subrenal implantation of He/De cells. A) Metastatic infiltration in the thoracal parathymic lymph nodes (PTN) two weeks after implantation. a) Lack of tumor formation in the thymus. b) Enlarged tumorous PTN. B. Hematoxilin staining of control PTN. C) Hematoxilin staining of tumor bearing PTN. Bars, 500 µm each.
Metastatic spread from primary tumor to PTN
The control experiment by taking whole body 18FDG-PET images before the implantation of He/De cells served the exclusion of chronic inflammation and spontaneous tumor formation that could have led to the accumulation of the radiopharmakon. Physiological accumulation of 18FDG was observed in the brain (SUV mean: 2.37±0.25), Harderian gland (SUV mean: 5.98±1.54), heart muscle (SUV mean: 6.82±1.34), unine (SUV mean: 39.76±4.25), guts (SUV mean: 1.28±0.31), and in the bone marrow (SUV mean: 1.99±0.33).
Figure 5. summarizes the SUV mean and T/M mean values of the primary tumor at different time points after implantation (Fig. 5A) and the metastatic tumor in PTNs (Fig. 5B). These values indicate that the rate of glucose metabolism is proportional to tumor growth. Highest SUV mean and T/M mean values were registered 18±1 days after He/De cell implantation both in the primary and in the metastatic PTN tumors. Due to the enormous size of the primary tumors and the metastatic impact on abdominal organs, further suffering of animals was terminated by euthanization.
Tumor formation at the primary site of implantation and metastasis in PTNs. A) 18FDG-SUV and T/M values of the primary tumor growth under the capsule of the kidney. B) Metastasis in thoracal parathymic lymph nodes (PTNs). T/M mean is the ratio of tumor SUV mean versus background muscle SUV mean. Values are averages of three independent experiments. C) Sagittal 18FDG-MiniPET II image picture of control rat after i.v. administration of 18FDG and its appearance in the heart as the major blood containing organ. D) Sagittal 18FDG-MiniPET II image of rat two weeks after subrenal implantation of He/De cells. White arrow indicates the location of the primary kidney tumor, red arrow points to PTNs.
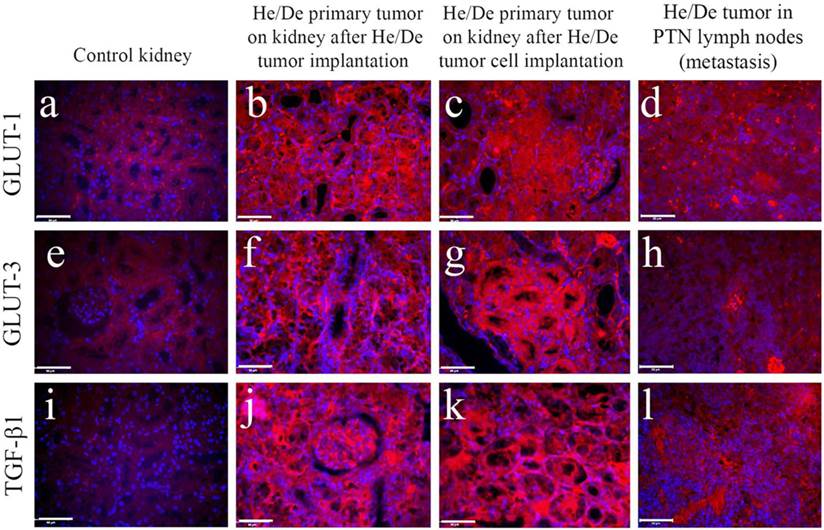
The formation of primary and metastatic tumors was supported by histological examinations in kidney and in PTNs (Fig. 6). Immunofluorescent images of tumor infiltrated areas relative to control tissues revealed high GLUT-1 (Fig. 6 a-d), GLUT-3 (Fig. 6 e-h) and TGF-ß1 protein (Fig. 6 i-l) expressions. Immunohistochemical staining helped to distinguish not only between normal and cancerous cell growth, but also between primary and metastatic tumors.
Immunohistochemical staining of control kidney and hepatocellular carcinoma developed two weeks after subrenal implantation of He/De cells. Primary and metastatic tumors were induced by the subrenal implantation of either He/De tumor slices, or He/De tumor cells. Tumor formation after implantation was also detected in parathymic lymph nodes. Texas red staining of GLUT-1 (a-d), and GLUT-3 (e-h) transporters and TGF-ß1 protein (i-l) were performed in control kidney, in He/De tumor, He/De cell infiltrated kidney and in metastatic PTN tissues. Bars: 50µm, each.
Discussion
The significantly higher metabolic activity of tumor cells relative to normal cells served as a basis to investigate the distribution of the radiotracer glucose analogue. 18FDG has been initially used to measure the glucose metabolism in mice by gas chromatography and radioassay [28]. The use of 18FDG has been extended to mimic the elevated glucose uptake in tumor bearing animals. Results related to human malignant transformations described elevated 18FDG uptake in brain and liver tumors [27]. Conforming to these observations we have found that in tumor cells the 18FDG uptake was significantly higher than in control cells, and corresponded to the overexpression of cell surface glucose transporters. The relationship between 18FDG uptake and facilitative glucose transporters was proven [28], and clarified that of the 12 known GLUT transporters GLUT-1 and GLUT-3 are preferentially used in 18FDG uptake [29]. That GLUT-1 transporter secures the ubiquitous basic glucose level and storage has been confirmed in erythrocytes, cells of endometrium and fetal tissues [30-32]. In tumor cells the expression of GLUT-1 transporter was significantly higher than the levels of other GLUT transporters [28]. Irrespective of the applied tumor models our immunohistological examinations confirmed higher GLUT-1 protein expression in various tumor cells.
Our earlier experiments have shown that tumor cells of epithelial (He/De) or mesodermic nephroblastoma (Ne/De) origin implanted under the capsule of the kidney of rats generated metastasis in the parathymic lymph nodes [33]. Similarly, myeloid My2/De leukemia tumor cells implanted subrenally followed the same metastatic route and accumulated in parathymic lymph nodes [34]. To clarify how tumor progression can lead to metastatic spread, three animal models have been tested in our experiments:
1. During the subcutaneous introduction of tumor cells rats have been subjected to s.c. administration of hepatocarcinoma (He/De) cells. Contrary to the fast growth of the primary tumor at the site of injection, none of the animals has shown transmissibility of tumor cells from the local tumor to other organs of the animals. Contrary to other s.c. tumor models that have been applied successfully to generate metastasis [35], in our experiments subcutaneously induced local tumors did not project metastases to distant places. Consequently, we did not find s.c. models suitable to study metastasis.
2. Intravenous application of tumor cells. This is the most frequently applied method to introduce tumor cells into experimental animals. Other forms of administration to the circulatory system are intra-arterial or intracardial injections. The generation of liver metastasis is a relatively reliable method, when the tumor cell suspension is injected directly into the spleen or in the portal vein. During this procedure tumor cells are injected immediately into the cardiovascular system. This application faces the dilemma of important early steps in the metastatic process could be missing. A further danger of injecting aggregated tumor cells in the middle caudal vein of rodents carrying blood from the lower part of the body is that tumor cells are deposited in the neighboring capillaries. The tail vein leads directly to the inferior vena cava and the right atrium. From the right ventricle of the heart the pulmonary circulation carries tumor cells to the capillaries of lung where these aggregated cells can cause microemboli and initiate metastases. Even more unpredictable is the injection of tumor cells directly into the heart, as metastases can spread to different locations including the bones.
Based on our observations i.v. injections often result in local tumor formation at the site of injection or if this can be evoided, it is unpredicatable where tumor cells will adhere if there will be tumor formation at all. Only three of the five rats that have been given He/De tumor cells i.v. developed metastasis in the lung and liver. Another notable difference relative to the s.c. induced primary tumors was the low speed of tumor growth and smaller tumor size. The accumulation and growth of tumor cells in the liver can be explained by the extraction of intravenously injected colloidal particles, including tumor cells. In conformity with tumor growth in the liver we have found earlier that i.v. added 118mIn colloidal particles were extracted by the Kuffer cells of the MALT, formerly referred to as reticuloendothelial system [36]. The distribution of colloidal particles in liver (98%), spleen (1.5%) and lung (0.2%) of rats proved that the primary sites of colloide extraction were not the primary lymphoid (bone marrow, thymus), but the secondary lymphoid organs, primarily the liver and the spleen. The extraction of colloidal particles was independent of the size within the colloidal range [36]. The appearance of tumors in the lung upon i.v. administration of tumor cells can be explained by the formation of particles larger than the colloidal size (>10 μm). Macroaggregate formation, such as trombi causes microembolization in microvessels between arterioles and venules [37]. 113mIn-Fe(OH)3 macroaggregates generated microembolization in the lung of rats [41]. The heterogeneity of 113mIn-Fe(OH)3 macroaggregates containing larger than 10 μm particles made these preparations unsuitable for lung scintigraphy when injected i.v. to rats, causing temporary occlusions in vessels of vital organs such as the heart and lung. To avoid microembolization and tumor metastasis in the lung, intravenously administered tumor cells should not exceed the colloidal size range. There was another disturbing factor during the i.v. adminstration of tumor cells, namely local tumor formation at the site of injection caused by the damage of the caudal vein. Due to these uncertaintenties i.v. administration of tumor cells does not provide a reliable metastatic tumor model.
3. Tumor cells implanted under the subrenal capsule of rats induced rapid local tumor growth detactable three days later and projected metastasis to distant lymph nodes in all animals tested. The first metastasis appeared in each case around day 7 in the paratymical lymph nodes, in conformity with our earlier observations [12, 15, 39]. The uptake of 18FDG correlated to the rate of tumor growth. The accumulation of 18FDG could be reliably followed by a MiniPET camera. 18FDG-PET preclinical examinations combined with other tests could improve diagnostic means to follow, understand and prevent metastasis.
There is one more question that needs explanation, namely how tumor cells released from the primary tumor to the peritoneal space enter the thoracal, primarily parathymic lymph nodes. Other authors have found that beside parathymic lymph nodes the i.p. administered India ink appeared in mediastinal lymph nodes [40]. We have mimicked the release of tumor cells from the primary tumor either by implanting ink particles under the capsule of the kidney or injecting the ink directly into the peritoneum. Irrespective of the subrenal implantation or direct injection of ink, these particles deposited not only in abdominal organs, but also in the thoracal, preferentially in the parathymic lymph nodes. When rat leukemia (My1/De) cells were injected i.p. they passed across the diaphragm and similarly to colloidal carbon particles deposited preferentially in the parathymic lymphatics [41] confirming the notion of lymphatic rather than hematogen dissemination of abdominal tumors.
Based on the”soil and seed” hypothesis it was reasoned that cancers are not randomly distributed, tumors grow only in those organs that are predisposed to secondary cancers [7, 42]. The theory of hematogen spread of metastasis suggests that tumor cells cross the barrier of the tumor capsule, enter the circulation and exit through the endothelial cells of the blood vessels [43]. After adaptation to the microenvironment cancer cells start to divide [44]. Recently the lymphoid-hematogen aspect of metastasis formation prevails, but the spread of broken away tumor cells from the peritoneal cavity to the thoracic lymph nodes is more in the favor of a lymphatic drainage [45, 46].
To summarize our observations, by the administration of exact number of tumor cells we could follow the temporal aspects of the tumor development in rats. The rat kidney capsule-PTN complex traces tumor progression from the place of implantation to the site of metastasis. This model is expected to provide further explanations regarding the peritoneal, retroperitoneal and thoracal metastatic tumor development. The fact that other small colloidal particles (India ink) also move from the abdominal to the thoracal cavity is a clear indication of a general pathway that foreign particles follow including tumor cells. The advantage and utilization of our metastatic model can be summarized as:
1. Exact number of tumor cells obtained from established tumor cell lines can be implanted under the kidney or liver of rats. Rat rather than murine model was used as in mice, the parathymic lymph nodes are inside the thymic capsule and can be removed only with the thymus, whereas in rats these nodes, regularly three or four on each side lie on the capsule and can be isolated as separate glands [47].
2. The temporal development of primary tumor growth and the secondary tumor formation (metastasis) can be planned and followed more reliably than by implanting tumor slices.
2. Our metastatic rat tumor model clarified that due to delayed angiogenesis, the inner part of primary tumor necrotized. The arterial blood pressure and the lack of venous backflow channeled blood and tumor cells to the interstitial fluid [39, 45, 46].
3. Elevated interstitial pressure at the outer part of the primary tumor caused disruptions and released blood and tumor cells into the neighboring tissues [15].
4. The broken away blood cells along with the released tumor cells drained from the kidney tumor to the retroperitoneal space and from the liver to the peritoneal space and further through the diaphragm to the thoracal lymphatic vessels [48, 49], with parathymic lymph nodes being the sentinel lymph nodes [12, 15, 39].
5. This model supports the notion that similar to bacteria, cancer cells cooperatively develop complex communities (primary tumors) with cell differentiation and distribution of tasks [48, 49].
Our experiments are in conformity with the idea that the disruption of the tumor capsule and its associated physical barriers are pre-requisites for tumor cell invasion or metastasis from the primary tumor [50]. The degradation or disruption of the tumor capsule and the invasion from in situ primary tumors to metastatic cancer is likely to be supported by proteolytic enzymes produced by tumor cells [51-53] and by tumor-infiltrating immune cells [53]. Delayed angiogenesis and vascular movement probably also contribute to the disruption of the capsule of the primary tumor. Released tumor cells enter neighboring tissues and body fluids and initiate the formation of micrometastases of lymphatic origin rather than by the hematogeneous dissemination of metastases.
Acknowledgements
This work was supported by the National Science Research Foundation of the Hungarian Academy of Sciences OTKA grant T42762 to GB.
Competing interest
The authors have no conflict of interest to declare.
References
1. Khanna C, Prehn J, Yeung C. et al. An orthotopic model of murine osteosarcoma with clonally related variants differing in pulmonary metastatic potential. Clin Exp Metastasis. 2000;18:261-271
2. Schackert HK, Fidler IJ. Development of an animal model to study the biology of recurrent colorectal cancer originating from mesenteric lymph system metastases. Int J Cancer. 1989;44:177-181
3. Naito S, von Eschenback AC, Fidler IJ. Different growth pattern and biologic behavior of human renal cell carcinoma implanted into different organs of nude mice. J Natl Cancer Inst. 1987;78:377-385
4. Berlin O, Samid D, Donthineni-Rao R. et al. Development of a novel spontaneous metastasis model of human osteosarcoma transplanted orthotopically into bone of athymic mice. Cancer Res. 1993;53:4890-4895
5. Sharkey FE, Fogh J. Considerations in the use of nude mice for cancer research. Cancer Metastasis Rev. 1984;3:341-360
6. Price JE, Polyzos A, Zhang RD. et al. Tumorigenicity and metastasis of human breast carcinoma cell lines in nude mice. Cancer Res. 1990;50:717-721
7. Fidler IJ The pathogenesis of cancer metastasis. the ' seed and soil' hypothesis revisited. Nat Rev Cancer. 2003;3:453-458
8. Bogenmann E. A metastatic neuroblastoma model in SCID mice. Int J Cancer. 1996;67:379-385
9. Fidler IJ, Kripke ML. Metastasis results from preexisting variant cells within a malignant tumor. Science. 1997;197:893-895
10. Fidler IJ, Nicolson GL. Fate of recirculating B16 melanoma metastatic variant cells in parabiotic syngeneic recipients. J Natl Cancer Inst. 1977;58:1867-1872
11. Gordon JR, Quigley JP. Early spontaneous metastasis in the human epidermoid carcinoma HEp3/chick embryo model: contribution of incidental colonization. Int J Cancer. 1986;38:437-444
12. Trencsenyi G, Kertai P, Bako F. et al. Renal capsule-parathymic lymph node complex: a new in vivo metastatic model in rats. Anticancer Res. 2009;29:2121-2126
13. Magee PN, Barnes JM. Induction of kidney tumours in the rat with dimethylnitrosamine (N-nitrosodimethylamine. J Pathol Bact. 1962;84:19-31
14. Díaz Gómez MI, Tamayo D, Castro JA. Administration of N-nitrosodimethylamine, N nitrosopyrrolidine, or N'-nitrosonornicotine to nursing rats: their interactions with liver and kidney nucleic acids from sucklings. J Natl Cancer Inst. 1986;76:1133-1136
15. Trencsenyi G, Juhasz T, Bako F. et al. Comparison of the tumorigenic potential of liver and kidney tumors induced by N-nitrosodimethylamine. Histol Histopathol. 2010;25:309-320
16. Slagel DE, Desimone P, Dillon M. et al. Subrenal capsule assay: feasibility of transporting tissues to a central facility for testing. Cancer Treat Rep. 1985;69:717-718
17. Uzvolgyi E, Katona A, Kertai P. Tumor cell implantation with use of Gelaspon gelatin sponge disc. Cancer Lett. 1990;51:1-5
18. Workman P, Twentyman P, Balkwill F. et al. United Kingdom Coordinating Committee on Cancer Research (UKCCCR) Guidelines for the welfare of animals in experimental neoplasia. Br J Cancer. 1988;77:1-10
19. Hamacher K, Coenen HH, Stöcklin G. Efficient stereospecific synthesis of no-carrier-added 2-(18F)-fluoro-2-deoxy-D-glucose using aminopolyether supported nucleophilic substitution. J Nucl Med. 1986;27:235-238
20. Wahl LR. Targeting glucose transporters for tumor imaging. "Sweet" idea, "Sour" result. J Nucl Med. 1996;37:1038-1041
21. Gu J, Yamamoto H, Fukunaga H. et al. Correlation of GLUT-1 Overexpression, Tumor Size, and Depth of Invasion with 18F-2-fluoro-2-deoxy-d-glucose Uptake by Positron Emission Tomography in Colorectal Cancer. Dig Dis Sci. 2006;51:2198-2205
22. Zhao L, Ashek A, Wang L. et al. Heterogeneity in lung (18)FDG uptake in pulmonary arterial hypertension potential of dynamic (18)FDG Positron Emission Tomography with kinetic analysis as a bridging biomarker for pulmonary vascular remodeling targeted treatments. Circulation. 2013;128:1214-1224
23. Lajtos I, Emri M, Kis SA. et al. Performance Evaluation and Optimization of the MiniPET-II Scanner. Nucl Instrum Methods Phys Res A. 2013;36:26-34
24. Macheda ML, Rogers S, Best JD. Molecular and cellular regulation of glucose transporter (GLUT) proteins in cancer. J Cell Physiol. 2005;202:654-662
25. Murakami T, Nishiyama T, Shirotani T. Type 1 glucose transporter from the mouse which are responsive to serum, growth factor, and oncogenes. J Biol Chem. 1992;267:9300-9306
26. Lucignani G, Paganelli G, Bombardieri E The use of standardized uptake values for assessing FDG uptake with PET in oncology. A clinical perspective. Nucl Med Commun. 2004;25:651-656
27. Patronas NJ, Di Chiro G, Brooks RA. et al. Work in progress: [18F] fluorodeoxyglucose and positron emission tomography in the evaluation of radiation necrosis of the brain. Radiology. 1982;144:885-889
28. Rastogi S, Banerjee S, Chellappan S. et al. Glut-1 antibodies induce growth arrest and apoptosis in human cancer cell lines. Cancer Lett. 2007;257:244-251
29. Waki A, Kato H, Yano R. et al. The importance of glucose transport activity as the rate-limiting step of 2-deoxyglucose uptake in tumor cells in vitro. Nucl Med Biol. 1998;25:593-597
30. Mueckler M. Family of glucose-transporter genes. Implications for glucose homeostasis and diabetes. Diabetes. 1990;39:6-11
31. Wolf HJ, Desoye G. Immunohistochemical localization of glucose transporters and insulin receptors in human fetal membranes at term. Histochemistry. 1993;100:379-385
32. Hahn T, Desoye G. Ontogeny of glucose transport systems in the placenta and its progenitor tissues. Early Pregnancy. 1996;2:168-182
33. Trencsenyi G, Kertai P, Bako F. et al. Renal capsule-Parathymic lymph node complex: A new in vivo metastatic model in rats. Anticancer Res. 2009;29:2121-2126
34. Trencsenyi G, Nagy G, Kahlik B. et al. Lymphoid metastasis of rat My2/De leukemia. Leuk Res. 2014;38:586-593
35. Bobek V, Kolostova K, Pinterova D. et al. Development of new spontaneous metastatic heterotopic model of lewis lung carcinoma imaged by GFP expression. Cancer Invest. 2011;29:692-695
36. Banfalvi G, Pal I, Csernay L. Preparation of 113mIn colloide for liver scintigraphy. Acta Pharm Hung. 1972;42:25-31
37. James TN. Thrombi in antrum atrii dextri of human heart as clinically important source for microembolisation to lungs. Br Heart J. 1983;49:122-132
38. Banfalvi G, Csernay L. Factors influencing the formation of 113mIn-Fe(OH)3 macroaggregates. Acta Pharm Hung. 1975;45:215-221
39. Rozsa D, Trencsenyi G, Kertai P. et al. Lymphatic spread of mesenchymal renal tumor to metastatic parathymic lymph nodes in rat. Histol Histopathol. 2009;24:1367-1379
40. Marco AJ, Domingo M, Ruberte J. et al. Lymphatic drainage of Listeria inonocytogenes and Indian ink inoculated in the peritoneal cavity of the mouse. Laboratory Animals. 1992;26:200-205
41. Trencsenyi G, Nagy G, Kahlik B. et al. Lymphoid metastasis of rat My2/De leukemia. Leuk Res. 2014; http://dx.doi.org/10.1016/j.leukres. 2014 02.006
42. Paget S. The distribution of secondary growths in cancer of the breast. Lancet. 1889;1:571-573
43. Muraoka RS, Dumont N, Ritter CA. et al. Blockade of TGF-beta inhibits mammary tumor cell viability, migration, and metastases. J Clin Invest. 2002;109:1551-1559
44. Khanna C, Wan X, Bose S. et al. The membrane-cytoskeleton linker ezrin is necessary for osteosarcoma metastasis. Nat Med. 2004;10:182-186
45. Banfalvi G. Metastatic view of breast cancer. Cancer Metastasis Rev. 2012;31(a):815-822
46. Banfalvi G. Role of parathymic lymph nodes in metastatic tumor development. Cancer Metastasis Rev. 2012;31(b):89-97
47. Blau JN, Gaugas JM. Parathymic lymph nodes in rats and mice. Immunology. 1968;14:763-765
48. Heppner GH. Cancer cell societies and tumor progression. Stem Cells. 1993;11:199-203
49. Deisboeck TS, Couzin ID. Collective behavior in cancer cell populations. Bioessays. 2009;31:190-197
50. Man YG, Stojadinovic A, Mason J. et al. Tumor-infiltrating immune cells promoting tumor invasion and metastasis: existing theories. J Cancer. 2013;4:84-95
51. Goldfarb RH, Liotta LA. Proteolytic enzymes in cancer invasion and metastasis. Semin Thromb Hemost. 1986;12:294-307
52. Kugler A. Matrix metalloproteinases and their inhibitors. Anticancer Res. 1999;19:1589-1592
53. Duffy MJ, Maguire TM, Hill A. et al. Metalloproteinases: role in breast carcinogenesis, invasion and metastasis. Breast Cancer Res. 2000;2:252-257
Author contact
![]() Corresponding author: Prof. Gaspar Banfalvi, Department of Microbial Biotechnology and Cell Biology, 1 Egyetem Square, Debrecen 4010, Hungary. Tel: (36) 52-512-900 Fax: (36) 52 512 925 Email: bgasparhu.
Corresponding author: Prof. Gaspar Banfalvi, Department of Microbial Biotechnology and Cell Biology, 1 Egyetem Square, Debrecen 4010, Hungary. Tel: (36) 52-512-900 Fax: (36) 52 512 925 Email: bgasparhu.