Impact Factor ISSN: 1837-9664

 Global reach, higher impact
J Cancer 2014; 5(7):609-624. doi:10.7150/jca.9002 This issue Cite
Research Paper
Pyrroloquinoline Quinone Induces Cancer Cell Apoptosis via Mitochondrial-Dependent Pathway and Down-Regulating Cellular Bcl-2 Protein Expression
Zhihui Min1,2,3*, Lingyan Wang1*, Jianjun Jin1,2, Xiangdong Wang1,2,3, Bijun Zhu1, Hao Chen4, ![]() , Yunfeng Cheng1,3,5,6
, Yunfeng Cheng1,3,5,6 ![]()
1. Biomedical Research Center, Zhongshan Hospital, Fudan University, Shanghai 200032, China;
2. Biomedical Research Center, Zhongshan Hospital Qingpu Branch, Shanghai, 201700 China;
3. Shanghai key laboratory of organ transplantation, Shanghai, 200032, China;
4. Department of Cardiothoracic Surgery, Tongji Hospital, Tongji University, Shanghai 200065, China;
5. Department of Hematology, Zhongshan Hospital, Fudan University, Shanghai 200032, China;
6. Department of Hematology, Zhongshan Hospital Qingpu Branch, Shanghai, 201700 China.
* These authors contributed equally to this work.
Received 2014-3-3; Accepted 2014-6-16; Published 2014-7-29
Abstract
Pyrroloquinoline quinone (PQQ) has been reported as a promising agent that might contribute to tumor cell apoptosis and death, yet little is known on its mechanisms. In current study, the effect of PQQ on cell proliferation and mitochondrial-dependent apoptosis were examined in 3 solid tumor cell lines (A549, Neuro-2A and HCC-LM3). PQQ treatment at low to medium dosage exhibited potent anti-tumor activity on A549 and Neuro-2A cells, while had comparably minimal impact on the viabilities of 2 human normal cell lines (HRPTEpiC and HUVEC). The apoptosis of the 3 tumor cell lines induced by PQQ were increased in a concentration-dependent manner, which might be attributed to the accumulation of intracellular reactive oxygen species (ROS), decline in ATP levels and dissipation of mitochondrial membrane potential (MMP), in conjunction with down-regulation of Bcl-2 protein expression, up-regulation of activated caspase-3, and disturbed phosphorylated MAPK protein levels. PQQ induced tumor cells apoptosis was significantly alleviated by pan-caspase inhibitor Z-VAD-FMK. The present work highlights the potential capability of PQQ as an anti-tumor agent with low toxicity towards normal cells through activating mitochondrial-dependent apoptosis pathways, and warrants its development for cancer therapy.
Keywords: pyrroloquinoline quinone (PQQ), apoptosis, MAPK, mitochondrial membrane potential, bcl-2.
Introduction
Pyrroloquinoline quinone (PQQ) was primarily identified in methylotrophic bacteria as a novel bacterial enzymatic cofactor [1] and was considered to be a new B group of vitamins [2]. As an essential nutrient, PQQ is a water-soluble and thermal stable small molecular organic matter, exists in various plant and animal cells, at pM to nM levels [3, 4]. Researches of PQQ have been focused on its activities as an antioxidant and redox modulator[5], cardio- and neuro-protectant [6, 7], and its radioprotective effects on hemopoietic system [8].
Recently, studies showed that PQQ could induce apoptosis in human promonocytic leukemia U937 and lymphoma EL-4 cells, as well as Jurkat cell programmed death [5]. The underlying mechanism might be relevant to the increase of intracellular reactive oxygen species (ROS) and depletion of glutathione [9]. Another study in vivo indicated that at nano- to micro-mole levels of PQQ intake in animal diets could affect the cell signaling, especially activation of MAPK-related families and JAK/STAT3 signaling in the livers of rat [10]. In addition, PI3K/Akt, ras-related ERK1/2 [7] and phosphorylation of JNK signaling pathways were proved to be associated with the neuro-protective effect of PQQ in hippocampal neurons [11].
These findings suggested that PQQ not only regulates redox status of the cells, but also poses impact on the cellular signaling pathways. However, to date, there is no study that has investigated the effect of PQQ on directly inducing solid tumor cell apoptosis except for the hematological tumors [5, 9]. The underlying molecular mechanism of PQQ's anticancer effect remains to be elucidated. Inasmuch, this work aimed to determine whether PQQ has apoptosis-inducing effect in solid tumor cells, and to explore the potential mechanisms.
Materials and methods
Chemicals and cell lines
Pyrroloquinoline quinine (PQQ) was obtained from Changmao Biochemical Engineering Co., LTD (Changzhou, China). PQQ stock solution (10mM) was prepared in DMEM medium, stored in -20˚C. Benzyloxycarbonyl-Val-Ala-Asp (OMe) fluoromethylketone (Z-VAD-FMK) was acquired from Enzo Life Sciences, Inc (Lausen, Switzerland). A549 (human non-small cell lung adenocarcinoma) and Neuro-2A (mouse neuroblastoma) cell lines were purchased from the cell bank of Chinese Academy of Sciences (Shanghai, China). HRPTEpiC (human renal proximal tubular epithelial cells) was purchased from ScienCell research laboratories (Carlsbad, California, USA). HUVEC (human umbilical vein endothelial cells) and HCC-LM3 (human hepatocellular carcinoma) cell lines were kindly provided by the Liver Cancer Research Institute of Zhongshan Hospital, Fudan University (Shanghai, China), and maintained on the basis of ATCC guidelines at our center. All cells were cultured in Dulbecco's modified Eagle's medium (DMEM/High Glucose, Thermo Scientific HyClone, Logan, Utah, USA) containing 10% fetal bovine serum (FBS), 1% (v/v) penicillin-streptomycin (Gibco Invitrogen, Grand Island, NY, USA) at 37˚C in a humidified atmosphere with 5% CO2. Cells were treated for up to 48h with PQQ at designated concentrations, another cell culture without PQQ treatment was served as control.
Cell bio-behaviors assay with a continuous cell culturing platform (CELL-IQ)
The cell bio-behaviors including total cell number, cell differentiation and cell movement were measured by a real-time cell monitoring system, Cell-IQ cell culturing platform (Chip-Man Technologies, Tampere, Finland), equipped with a phase-contrast microscope (Nikon CFI Achromat phase contrast objective with 10× magnification). The equipment was controlled by Cell-IQ image software (Chip-Man Technologies). Analysis was carried out with a freely distributed Image software (McMaster Biophotonics Facility, Hamilton, ON, Canada), using the Manual Tracking plugin created by Fabrice Cordeliéres (Institut Curie, Orsay, France). Cell-IQ system uses machine vision technology for monitoring and recording time-lapse data, and it can also analyze and quantify cell functions and morphological parameters [12]. This system was used to discriminate cell stage (dividing/stable stage) and calculate cell numbers of each stage during proliferation. Besides, Cell-IQ was programmed to quantify the movement of each individual cell in the image field. The distance of total cell movement indicates the high migratory intention of cancer cells.
In the current study, cells treated with PQQ at different concentrations were cultured in Cell-IQ system with 24-well plates (8 × 10³ cells /well) for up to 48h. Images were captured at 5 min intervals for up to 48h. Cell stages, total cell number, cell differentiation and cell movement were then automatically analyzed.
Cell viability assay
The cell viability of PQQ was evaluated using Cell Counting Kit-8 (CCK-8) assay (Dojindo Laboratories, Kumamoto, Japan), per instruction of the manufacturer. In brief, cells were seeded in 96-well plates at 1 × 10⁴ cells/well and allowed an overnight period for attachment. After treatment for 48h with PQQ at serial concentrations, CCK-8 solution (10 µl) was added to each well, followed by 3h of incubation at 37°C. The absorbance wavelength at 450 nm was recorded for each well in a FlexStation 3 microplate reader (Molecular Devices, Sunnyvale, California, USA), and cell viability was then accessed according to the manufacturer instruction.
Detection of apoptosis with Annexin V-FITC/PI staining
Cell apoptosis was determined by the Annexin V-fluorescein isothiocyanate (FITC)/Propidium Iodide (PI) Apoptosis Detection Kit (EMD Biosciences, La Jolla, USA). Cells were cultured in 24-well plate at a density of 5 × 10⁴ cells/ml and treated with PQQ for 24h. Cells were harvested and resuspended in binding buffer, and then stained with 2.5 µl Annexin V-FITC and 5 µl propidium iodide (PI), and incubated for 15 min at room temperature in the dark. The stained cells were detected within 30 minutes with BD FACS Aria II flow cytometer (BD biosciences, San Jose, California, USA).
Reactive oxygen species (ROS) measurement
The intracellular ROS levels of 3 tumor cells were measured by reactive oxygen species assay kit (Beyotime Institute of Biotechnology, Shanghai, China). Briefly, cells were seeded in 6-well plates (1 × 10⁵ cells/well) followed by overnight incubation and treatment with indicated concentration of PQQ for additional 4h, 12h and 24h. Cells were then trypsinized and washed with PBS buffer before loading with 5 µM fluorescent probe 2', 7'-dichloro-dihydrofluorescein diacetate (H2DCFDA) at 37˚C for 30 minutes in dark. The fluorescent intensity was analyzed with flow cytometer (FACS Aria II, BD biosciences).
Cellular ATP release assay
Cells were cultured in the 96-well plates with 100 μl medium per well. After treatment with different concentrations of PQQ for 4h, 12h, and 24h, CellTiter-Glo Reagent (Promega, Madison, Wisconsin, USA) was added to each well for the plate. The reagent and culture medium were mixed for 2 minutes on an orbital shaker and the optical density (O.D.) was measured using a microplate reader (Flexstation3, Molecular Devices). All experiments were done in triplicate and repeated three times independently.
Detection of active caspase-3
Cells were treated with PQQ for 24h on the indicated concentrations, and collected, followed by cells were fixating, permeabilizating and intracellular staining with anti-active Caspase-3 V450 antibody (BD biosciences), according to the manufacturer's instructions. The activity of caspase-3 was presented as mean fluorescent intensity of cells and performed by flow cytometer (BD FACS Aria II).
Cell cycle analysis
After PQQ treatment, cells were harvested for cell cycle phase distributions detected by BD LSR Fortessa flow cytometry (BD biosciences). Stained cells were tested on flow cytometer according to the instructions of Cycle TestTM Plus DNA Reagent Kit (BD biosciences), and then analyzed using Flowjo software version 7.6.2. (Tritar Inc., San Carlos, California, USA).
Measurement of Mitochondrial Membrane Potential
Mitochondrial membrane potential was assessed using the fluorescent probe JC-1 (MitoProbeTM, Invitrogen, Grand Island, NewYork, USA), which was a cationic dye that displayed potential-dependent accumulation and normal formation of red fluorescent J-aggregates in mitochondria, indicated by a fluorescence emission shift from green (~529 nm) to red (~590 nm). A green fluorescent (JC-1 as a monomer at low membrane potentials) and a red fluorescent (JC-1 as “J-aggregates” at higher membrane potentials) were monitored under flow cytometer (BD FACS Aria II). Samples treated with Carbonyl cyanide m-chlorophenylhydrazone (CCCP), a mitochondrial uncoupling agent, were used as positive-control to perform standard compensation. Consequently, depolarization of mitochondrial membrane potential is indicated by a decrease in the red/green fluorescence intensity ratio. Cells were suspended in 1ml PBS at approximately 1 × 10⁶ cells/ml for each sample. For the positive-control tube, added 1µl of 50mM CCCP and incubated the cells at 37°C for 5 min. The sample cells were incubated at 37°C for 20 min with 2 µM JC-1, then washed once with 2ml PBS and placed in 500 µl PBS until analyzed by flow cytometer.
Measurement of Bcl-2, ERK2, MEK2, pERK1/2 and p38MAPK proteins
To investigate the underlying mechanisms of apoptosis induced by PQQ, we tested the effect of PQQ on key signaling pathway proteins in A549 and neuro-2A cells. These 2 cell lines were treated with 15-360 μM of PQQ for 24h. The expression levels of Bcl-2, ERK2, MEK2, pERK1/2 and p38 MAPK were analyzed by flow cytometer and presented as mean fluorescent intensity (MFI). In brief, cells were seeded in 24-well plates and treated with designated concentrations of PQQ for 24h. After 24h culture, cells were fixed and permeabilized (BD CytofixTM Fixation Buffer Cat. No. 554655, and Phosflow Perm Buffer III, Cat. No. 558050, BD biosciences), and intracellularly stained with anti-Human Bcl-2 FITC (BD biosciences), anti-ERK2 Alexa Fluor 488, anti-MEK2 PE, anti-pERK1/2 pT202/pY204 PerCP-Cy5.5, anti-p38 MAPK pT180/pY182 PE-Cy7 (Phosflow, BD biosciences) according to the manufacturer's instructions. The expression levels were tested on BD FACS Aria II flow cytometer and then analyzed using Flowjo software version 7.6.2.
Statistical analysis
All analyses were performed with SPSS software version 13.0 (SPSS Inc., Chicago, USA). Data were expressed as mean ± SEM. Normality was assessed by Shapiro-Wilk W test. Student t test and Wilcoxon rank-sum (Mann-Whitney) test were used for data fulfilled normal distribution and for those did not, respectively. When multiple groups were compared, One Way ANOVA and Kruskal Wallis test were used for data fulfilled normal distribution and for those did not, respectively. Two-sided p values less than 0.05 were considered statistically significant.
Results
The proliferation of cancer cell lines suppressed by PQQ
The cells were seeded in 24-well plates (3 × 10⁴ cells per well) overnight and then treated with PQQ at different concentrations respectively or without PQQ treatment (control group). As shown in Figure 1A and 1B, the cell growth curve generated by Cell-IQ monitoring system displayed notably inhibitory effects of PQQ in a dose- and time-dependent manner on treated A549 and Neuro-2A cells, with IC50 at 24h of 50.16 µM and 56.21 µM, respectively. Compared with the control group, the proliferation inhibitory effects of PQQ were significant at 24h and 48h in both cell lines. The inhibitory effects were significant from 30 µM to 600 µM in A549 cells, and from 30 µM to 360 µM in Neuro-2A cells overtime. Therefore, we chose the time-point of 24h at low (15-30 µM), medium (IC50) (60-75 µM) and high (120-300 µM) concentrations for further studies. There were no significant inhibitory effects observed on HCC-LM3 cells proliferation at 15-150 µM comparing with the control group, the IC50 at 24h was more than 300 µM. However, higher dose PQQ treatments (300-1200 µM) inhibited the proliferation of HCC-LM3 cells (Figure 1C).
The cells proliferation and viability. PQQ inhibited proliferations of 3 cancer cell lines for up to 48h were measured by Cell-IQ assay. Cell number of each microscopic field at different time points was imaged and counted. Data obtained from nine different microscopic fields in each group were showed with mean ± SEM and error bar for A549 cells (panel A), Neuro-2A cells (panel B) and HCC-LM3 cells (panel C). Panel D illustrates the viability of the 3 cancer cells and 2 normal cells (HRPTEpiC, HUVEC) assessed by CCK-8 assay after PQQ treatment for 48h.
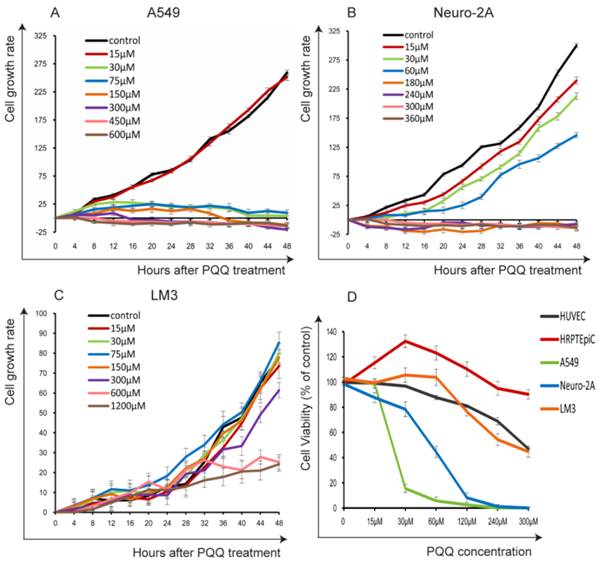
In order to evaluate the possible cytotoxicity of PQQ to normal cells, we also examined 2 normal cell lines (HRPTEpiC and HUVEC). Cell viability was determined by the CCK-8 assay. Under the same conditions, these 2 cell lines were exposed to various concentrations of PQQ (0-300 µM) for 48h. As shown in Figure 1D, HRPTEpiC cells maintained excellent viability after incubation with 0-300 µM of PQQ for 48h. HUVEC cells maintained good viability (100%-80% comparing to the control) until PQQ concentration reached 240-300 µM. In contrast, the viabilities of A549 and Neuro-2A cells were remarkably compromised in a dose-dependent manner, began at 30 µM and became significant from 60µM of PQQ. In consistent with the Cell-IQ results, the reduced viabilities of HCC-LM3 cells were only observed at higher concentrations (240-300 µM).
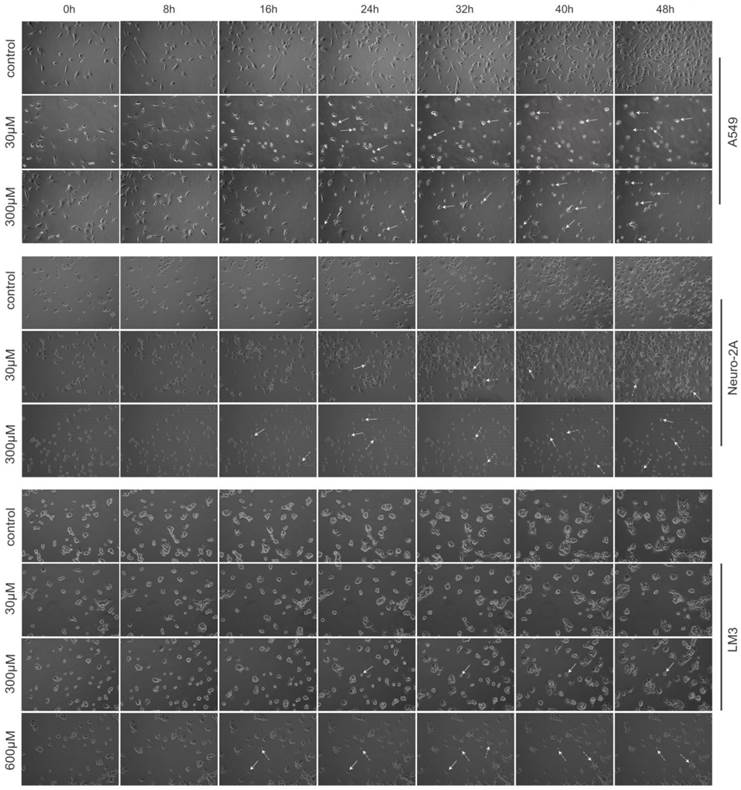
Images of each microscopic field were captured every 20-minute for 48 hours. Cell-IQ system automatically calculated total cell number of each image by specialized software. As shown in Figure 2, treatment with PQQ at 30-300 µM displayed typical poor growth and apoptosis morphological changes such as membrane blebbing, cellular shrinkage and chromatin condensation in A549 and Neuro-2A cells in a dose- and time-dependent pattern, whereas the cells of the control group proliferated rapidly and reached sufficient confluence. Apoptosis changes were also observed in HCC-LM3 cells at higher doses (300-600 µM) of PQQ overtime. These data indicated that A549 and Neuro-2A cells are sensitive to PQQ treatment, while HCC-LM3 cells response to higher concentrations of PQQ. Therefore, some of the subsequent studies were selectively focused on A549 and Neuro-2A cells.
Morphological changes induced by PQQ. PQQ inhibited the growth of A549, Neuro-2A and HCC-LM3 cells measured by real time Cell-IQ cell culture platform. The 3 cell lines were seeded in 24-well plates (8 × 10³ cells per well) overnight and then treated with PQQ at different concentrations respectively or without PQQ (control). Cell proliferation in the given microscopic field was continuously photographed at 20-minute intervals for 48h (magnification 100×). White arrows represent chromatin condensation and dotted arrows indicate membrane blebbing.
Apoptosis of cancer cell lines induced by PQQ
Apoptosis of A549, Neuro-2A and HCC-LM3 cells was measured by flow cytometry analysis after treatment with PQQ at different concentrations for 24h. Increase in cellular surface staining with Annexin V-FITC serves as a marker for early apoptosis while staining with PI indicates loss of cell membrane integrity. A cell-permeable, irreversible pan-caspase inhibitor, Z-VAD-FMK, was used to block caspase activation of apoptotic cells. After 24h treatment with PQQ, the percentage of apoptosis in A549 cells were significantly increased when compared to the control (7.45 ± 0.45% at 30 µM, 12.80 ± 0.38% at 75 µM, 17.88 ± 0.68% at 150 µM, 37.65 ± 0.68% at 300 µM, and 80.87 ± 0.95% at 600 µM, vs 3.12 ± 0.20% of control, p < 0.01 respectively) (Figures 3A and 3C). The percentage of apoptosis in Neuro-2A cells were also significantly increased in dose-dependent pattern (11.69 ± 0.47% at 30 µM, 12.62 ± 0.56% at 60 µM, 47.75 ± 1.16% at 120 µM, 65.13 ± 1.05% at 180 µM, 83.15 ± 0.80% at 300 µM, and 86.92 ± 1.42% at 360 µM, vs 4.15 ± 0.44% of the control, p < 0.01, respectively) (Figures 3D and 3F). As shown in Figures 3B and 3C, been pretreated for 3h with 10µM of Z-VAD-FMK prior to the indicated PQQ treatment, the percentages of apoptosis of A549 cells were significantly reduced (2-fold change) when compared with the corresponding cells that were not pretreated (3.28 ± 0.52% vs 7.45 ± 0.45% at 30 µM, and 17.38 ± 3.46% vs 37.65 ± 0.68% at 300 µM, p < 0.05, respectively). Comparing to the corresponding untreated cells, the percentages of apoptosis of Z-VAD-FMK pretreated Neuro-2A cells were similarly decreased (8.33 ± 0.61% vs 11.69 ± 0.47% at 30 µM, 40.79 ± 4.03% vs 83.15 ± 0.80% at 300 µM, p < 0.05, respectively, Figures 3E and 3F).
Apoptosis induced by PQQ. Treatment with PQQ caused dose-dependent apoptosis in 3 tumor cell lines for 24h. Early and late apoptosis were detected using Annexin V-FITC/PI-double staining analyzed by flow cytometry. Involvement of the caspase apoptosis pathway was confirmed using pan-caspase inhibitor Z-VAD-FMK pretreatment for 3h prior to the indicated PQQ treatment. The percentage of cells was described in each quadrant. The values represent the mean ±SEM of at least 3 independent experiments. PQQ induced apoptosis in A549 cells in dose-dependent manner, and Z-VAD-FMK markedly reduced the apoptosis (panels A, B and C). PQQ induced apoptosis in Neuro-2A cells in dose-dependent manner, and Z-VAD-FMK noticeably reduced the apoptosis (panels D, E and F). HCC-LM3 cells manifested the similar trend as well (panels G, H and I). ** p < 0.01 as compared with control group; *p < 0.05 as compared with PQQ treatment group.
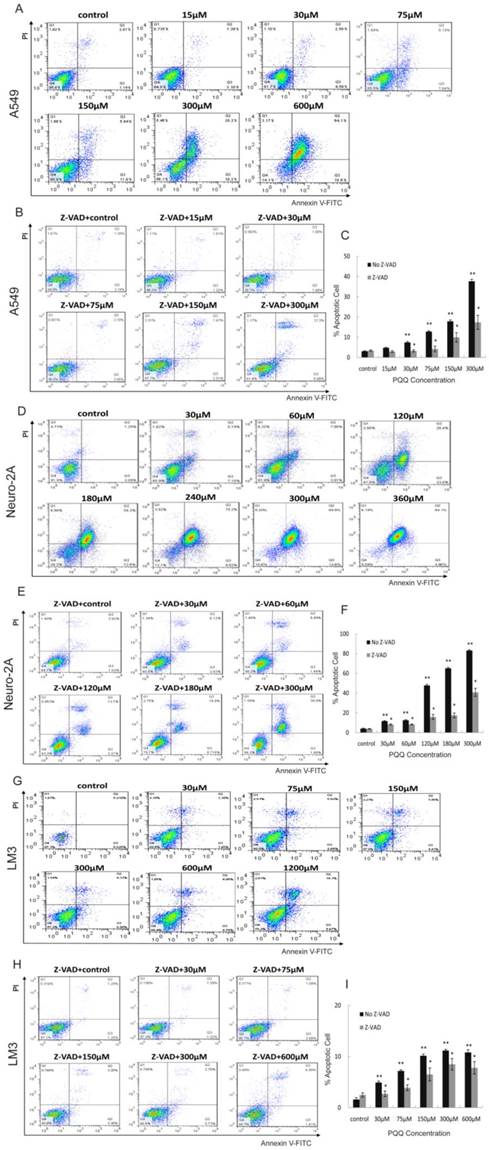
After PQQ treatment at different concentrations for 24h, the percentages of apoptosis HCC-LM3 cells were gradually increased from 4.92 ± 0.28% (30 µM) to 11.18 ± 0.21% (300 µM) and 21.05 ± 0.92% (1200 µM) in a dose-dependent manner, compared to the negative control (1.60 ± 0.35%, p < 0.01, respectively). (Figures 3G and 3I). When compared with the corresponding untreated cells, the percentages of apoptosis of Z-VAD-FMK pretreated HCC-LM3 cells were decreased (2.71 ± 0.55% vs 4.92 ± 0.28% at 30 µM, and 7.80 ± 1.21% vs 10.81 ± 0.53% at 600 µM, p < 0.05, respectively, Figures 3H and 3I).
Increased reactive oxygen species after PQQ treatment
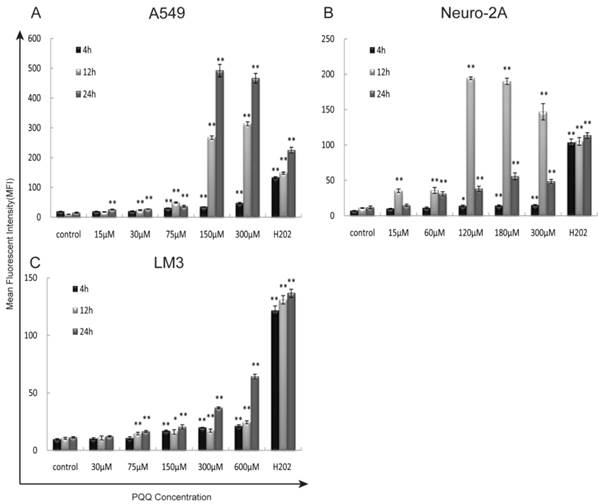
The generation of intracellular ROS was quantitatively analyzed by flow cytometer using H2DCFDA dye after 4h, 12h, and 24h of PQQ treatment. In addition, separate cell cultures were treated with 500µM of H2O2 (hydrogen peroxide) 15 minutes prior to the assessment (positive controls). PQQ treatment resulted in a time‑ and concentration‑dependent ROS accumulation in A549 and HCC-LM3 cells compared with the negative controls. Significantly increased ROS generation were observed at 4h and maintained at a high level through 24h in most of the concentration groups (p < 0.01 compared to the corresponding controls, Figures 4A and 4C). While A549 cells exhibited a rapid and sustained generation of ROS, the accumulation of ROS in HCC-LM3 cells was a relatively mild process. In contrast, although the production of ROS in Neuro-2A cells was also significantly enhanced in most of the concentration groups (p < 0.01 compared to the corresponding controls, Figure 4B), this effect reached peak at 12h.
Exposure to PQQ triggers intracellular ROS accumulation. Three cancer cell lines, A549 cells (panel A), Neuro-2A cells (panel B) and HCC-LM3 cells (panel C) were exposed to different doses of PQQ at 4h, 12h and 24h. The generation of ROS was quantitatively measured by the flow cytometer using H2DCFDA dye. Separate cell cultures treated with 500 µM of H2O2 15 minutes prior to the assessment were used as positive controls. All values are showed as means ± SEM from three-independent experiments.*p < 0.05 as compared with control group; **p < 0.01 as compared with control group.
PQQ treatment reduced cellular ATP release
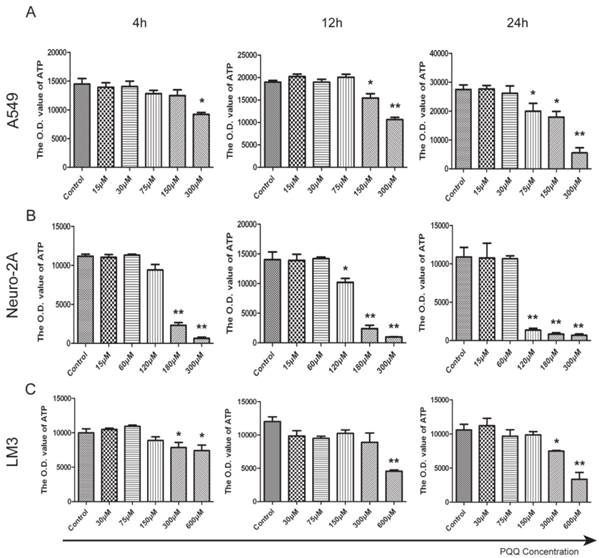
ATP release levels of all the 3 tumor cell lines decreased in the presence of PQQ in a dose and time dependent manner. In particular, a perfect dose dependent trend was presented in A549 cells with PQQ treatment at 24h (Figure 5A). Compared with the control, the reduction of ATP was 27% at 75 μM, and 80% at 300 μM (19967.7±2724.2 vs 27463.7±1588.4 at 75 μM, p < 0.05; 17914.7±1982.0 vs 27463.7±1588.4 at 150 μM, p < 0.05; and 5542.4±2407.7 vs 27463.7±1588.4 at 300 μM, p < 0.01). Compared with the control, in Neuro-2A cells with 24h PQQ treatment, the reduction of ATP was significant when PQQ dose was 120 μM and above (1359.3±237.3 vs 10559.2±1522.8 at 120 μM, p < 0.01; 836.3±184.7 vs 10559.2±1522.8 at 180 μM, p < 0.01; 695.8±52.3 vs 10559.2±1522.8 at 300 μM, p < 0.01) (Figure 5B). Again, HCC-LM3 cells responded to higher concentrations of PQQ at 24h (7490.2±103.5 vs 10585.4±817.2 at 300 μM, p < 0.05; PQQ vs control, 3367.8±587.1 vs 10585.4±817.2 at 600μM, p < 0.01) (Figure 5C).
Reduced cell ATP levels by PQQ treatment. The intracellular ATP level in A549 cells (panel A), Neuro-2A cells (panel B) and HCC-LM3 cells (panel C) in the presence of different doses of PQQ at 4h, 12h and 24h. Quantitative analysis recorded the optical density (O.D.) values of cellular ATP that were reduced when exposed to PQQ. All values are showed as means ± SEM from three-independent experiments. *p < 0.05 as compared with control group; **p < 0.01 as compared with control group.
Increased activity of intracellular caspase-3 after PQQ treatment
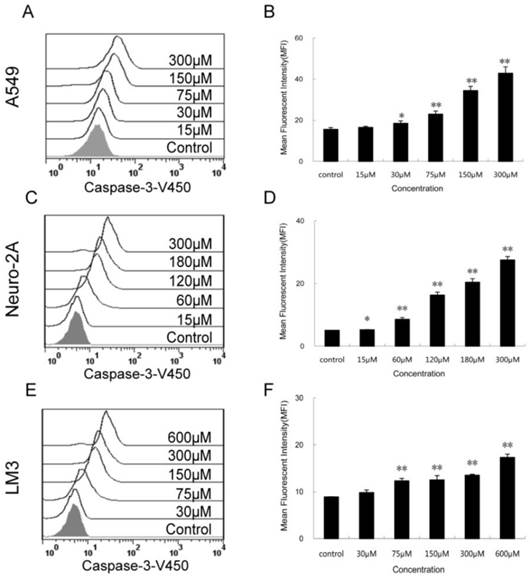
The expression levels of activated caspase-3 after 24h PQQ treatment increased in dose-dependent manner in the 3 tumor cell lines (Figure 6). Compared to the negative control, the fluorescent intensity of activated caspase-3 in A549 cells showed a trend of enhancing (15.50 ± 0.89 vs 15.50 ± 0.89 at 15 µM, p > 0.05; 18.43 ± 1.19 vs 15.50 ± 0.89 at 30 µM, p < 0.05; 22.90 ± 1.54 vs 15.50 ± 0.89 at 75 µM, p < 0.01; 42.83 ± 3.15 vs 15.50 ± 0.89 at 300 µM, p < 0.01) (Figures 6A and 6B). A similar trend was observed in Neuro-2A cells (Figures 6C and 6D). The fluorescent intensity of activated caspase-3 cells was significant increased in all PQQ treatment groups compared to the control (5.23 ± 0.08 vs 5.02 ± 0.05 at 15 µM, p < 0.05; 8.54 ± 0.59 vs 5.02 ± 0.05 at 60 µM, p < 0.01; 27.47 ± 1.12 vs 5.02 ± 0.05 at 300 µM, p < 0.01). PQQ treatment increased the expression levels of caspase-3 in HCC-LM3 cells too. As shown in Figures 6E and 6F, a gradually rise of the fluorescent intensity of caspase-3 was seen in a dose-dependent manner (9.80 ± 1.66 vs 8.86 ± 0.07 at 30 µM, p > 0.05; 12.30 ± 0.53 vs 8.86 ± 0.07 at 75 µM, p < 0.01; 17.30 ± 0.70 vs 8.86 ± 0.07 at 600 µM, p < 0.01).
Activity of caspase-3 in the 3 cancer cell lines treated with PQQ. Effects of PQQ on caspase-3 expression in the 3 cancer cells for 24h. Levels of the activated caspase-3-V450 were quantitatively measured by flow cytometer and presented as mean fluorescent intensity (MFI). The overlay histograms (panels A, C and E) and histograms (panels B, D and F) respectively indicated caspase-3 expression at protein level after treatment with various concentrations of PQQ for 24h in the 3 cancer cells. The data are represented as means ± SEM from three-independent experiments. *p < 0.05 as compared with control group; **p < 0.01 as compared with control group.
Effects of PQQ on cell cycle regulation in A549 and Neuro-2A cells
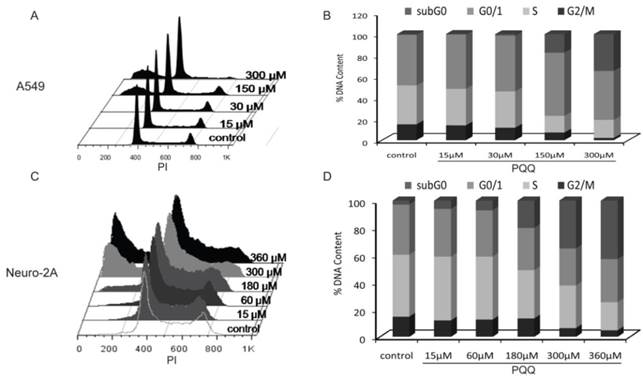
The cell cycle status of the A549 and Neuro-2A cancer cells were measured after PQQ treatment of 15-360 µM at 24h respectively. Cell cycle distribution analysis revealed an increasing rate of both tumor cells in sub-G0/G1 phase, with reduced counts of cells in S and G2M phases (Figure 7). After PQQ treatment for 24h, the sub-G0/G1 population significantly increased from 0.47 ± 0.07% (control) to 17.55 ± 1.73% (150 µM, p < 0.05, Figures 7A and 7B) in A549 cells; and from 2.89 ± 0.66% (control) to 42.93 ± 0.94% (360 µM, p < 0.05, Figures 7C and 7D) in Neuro-2A cells. The percentage of A549 cells in G0/G1 phase increased from 47.81 ± 1.23% (control) to 59.64 ± 0.68% (150 µM, p < 0.05). Correspondingly, the percentage of cells in S and G2M phase decreased from 36.66 ± 1.13% (control) to 15.63 ± 1.07% (150 µM, p < 0.05) in A549 cells; and from 14.90 ±0.57% (control) to 7.19 ± 0.34% (150 µM, p < 0.05) in A549 G2M phase cells. However, no obvious rise in the percentage of G0/G1, S and G2M phase was found in Neuro-2A cells.
Effects of PQQ on cell cycle regulation in A549 and Neuro-2A cells. Flow cytometry analysis of cell cycle distribution of A549 and Neuro-2A cells. The 2 cell lines were treated with PQQ at the indicated concentrations for 24h. Effects of PQQ on cell cycle were investigated using PI (Propidium Iodide) staining subjected to flow cytometry (panels A and C). The peaks from left to right represent sub-G0/G1 phase, G0/G1 phase, S phase and G2M phase respectively. Represent cells in different phases from three independent experiments (panels B and D).
Decreased mitochondrial membrane potential after PQQ treatment
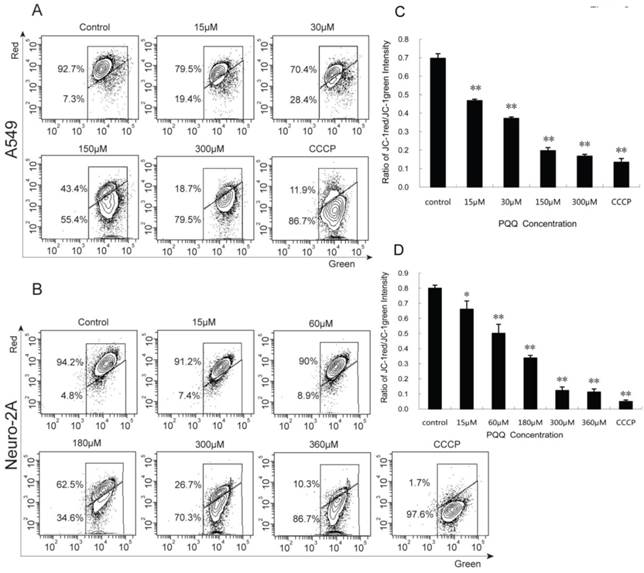
A549 and Neuro-2A cancer cells stained with JC-1 emitted mitochondrial red fluorescence with a little green fluorescence, indicative of normal polarization state. JC-1 is a cationic dye that manifests mitochondrial polarization by shifting its fluorescence emission from green (~525 nm) to red (~590 nm). When cell apoptosis occurs, the mitochondrial membrane potential depolarization is produced. JC-1 probe was released from mitochondria and red fluorescence intensity decreased, while the monomer of green fluorescence mainly existed in the cytoplasm. The JC-1 aggregates were dispersed to the monomeric form (green fluorescence) in both the cancer cells subjected to PQQ for 24 h in a concentration-dependent manner. As shown in figures 8A and 8C, red fluorescent percentages of JC-1 of A549 cells significantly decreased from 79.5% (15 µM PQQ) to 18.7% (300 µM PQQ), compared with the negative control group (92.7%), p < 0.01 respectively; the ratio of JC-1 red/green MFI was indicated to a significant reduction starting from the dose of 15µM PQQ (0.47 ± 0.01), compared to the negative control (0.70 ± 0.03), p < 0.01. Similarly, in Neuro-2A cells, the percentage of JC-1 aggregates significantly decreased from 94.2% of the control group to 91.2% of 15µM PQQ and 10.3% of 360µM PQQ group. The ratios of JC-1 red/green MFI were decreased with the increasing of PQQ concentrations from 0.80 ±0.02 (negative control) to 0.66 ± 0.05 (15 µM, p < 0.05), and 0.11 ± 0.02 (360 µM, p < 0.01) (Figures 8B and 8D).
Decreased mitochondrial membrane potential after PQQ treatment. PQQ decreased mitochondrial membrane potential in A549 and Neuro-2A cells. Density diagram of flow cytometry analysis showed the distribution of JC-1 aggregates (red) and JC-1 monomer (green) in the mitochondrial membrane with A549 and Neuro-2A cell lines, respectively (panels A and B). A549 and Neuro-2A cells without PQQ treatment served as controls and CCCP used as positive-control. Both the cell lines were treated with different concentrations of PQQ (from 15 µM to 360 µM) for 24h and then stained with JC-1 before flow cytometry analysis. Quantitative analysis of the shift of mitochondrial red fluorescence to green fluorescence among groups was calculated as red/green fluorescence intensity value (panels C and D). All values are showed as means ± SEM from three-independent experiments. *p < 0.05 as compared with control group; **p < 0.01 as compared with control group.
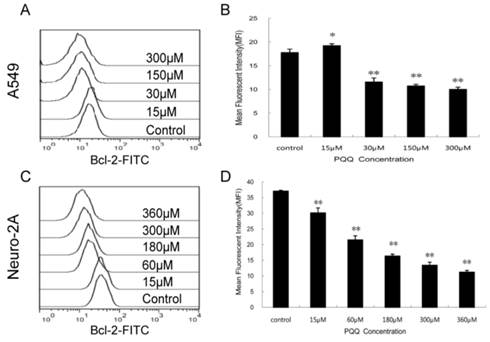
Decreased expression of Bcl-2 by PQQ treatment
In order to delineate the possible mechanisms by which PQQ induced apoptosis we quantitatively examined the cytoplasmic levels of the Bcl-2 protein by flow cytometer. As shown in Figure 9, compared to the controls, the Bcl-2 levels in both tumor cells were decreased after treatment with different doses of PQQ for 24h. In A549 cells, except for the 15 μM PQQ group that the MFI of Bcl-2 protein was higher than that of the control group (19.23 ± 0.40 vs 17.77 ± 0.72, p < 0.05), with the PQQ concentrations increased from 30 μM to 300 μM, the mean fluorescent intensity (MFI) of Bcl-2 protein decreased (11.57 ± 0.86 vs 17.77 ± 0.72 at 30 μM, p < 0.01; 10.01 ± 0.45 vs 17.77 ± 0.72 at 300 μM, p < 0.01) (Figures 9A and 9B). Similar pattern was found in neuro-2A cells, the expression levels of Bcl-2 significantly decreased with the increasing of PQQ concentrations, beginning at 15 μM (Figures 9C and 9D).
Decreased expression of Bcl-2 by PQQ treatment. Effects of PQQ on Bcl-2 expression in A549 and Neuro-2A cells for 24h. Levels of the cytoplasmic Bcl-2 protein were quantitatively measured by flow cytometer and presented as mean fluorescent intensity (MFI). The overlay histograms (panels A and C) respectively indicated Bcl-2 expression at protein level of the 2 cell lines after treatment with various concentrations of PQQ for 24h. Bar diagram (panels B and D) represent MFI values from three-independent experiments as means ± SEM. *p < 0.05 as compared with control group; **p < 0.01 as compared with control group.
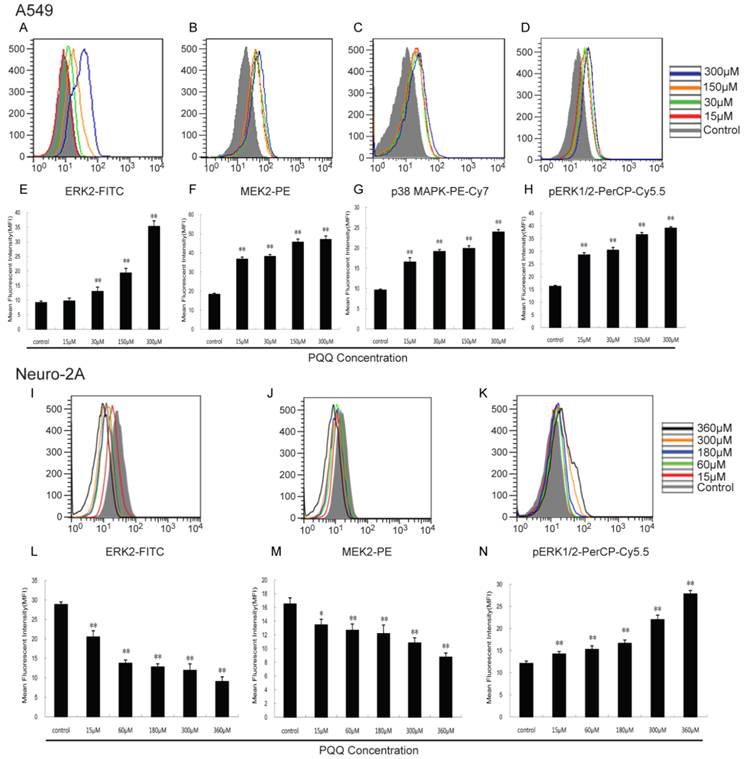
Effects of PQQ on ERK2, MEK2, pERK1/2 and p38 MAPK pathway
As shown in Figure 10, with the increasing of PQQ concentrations, increased expression levels of ERK2 (13.00 ± 1.45 vs 9.16 ± 0.57 at 30 μM, p < 0.01; 35.30 ± 1.86 vs 9.16 ± 0.57 at 300 μM, p < 0.01), MEK2 (36.70 ± 1.08 vs 18.30 ± 0.55 at 15 μM, p < 0.01; 47.00 ± 1.74 vs 18.30 ± 0.55 at 300 μM, p < 0.01), pERK1/2 (28.57 ± 0.87 vs 16.23 ± 0.35 at 15 μM, p < 0.01; 39.11 ± 0.56 vs 16.23 ± 0.35 at 300 μM, p < 0.01) and p38 MAPK (16.53 ± 1.07 vs 9.60 ± 0.24 at 15 μM, p < 0.01; 23.93 ± 0.59 vs 9.60 ± 0.24 at 300 μM, p < 0.01) in A549 cells were detected after 24h PQQ treatment, compared with the control group. The MFIs of ERK2 and MEK2 in neuro-2A cells were significantly decreased and the MFI of pERK1/2 were significantly increased, when compared to the control group.
Effects of PQQ on ERK2, MEK2, pERK1/2 and p38 MAPK pathway. Effects of PQQ on biomarkers of apoptotic signal pathway in A549 and Neuro-2A cells at 24h. Phosphorylated ERK1/2 and p38 MAPK, ERK2 and MEK2 levels were represented as mean fluorescent intensity (MFI) measured by flow cytometer (panels A to D, and panels I to K). The overlay graphs respectively indicated the levels of proteins related to the signal transduction pathways in the 2 cell lines after treatment with various concentrations of PQQ for 24h (panels E to H, and panels L to N). The bar diagram represented the corresponding mean fluorescent intensity of protein level. All values are showed as means ± SEM from three-independent experiments. *p < 0.05 as compared with control group; **p < 0.01 as compared with control group.
Discussion
PQQ, as an antioxidant nutrient, has the effects of radioprotection and neuroprotection. Previous study focused on the scavenging of the production of intracellular ROS [13], which was due to comparatively higher reactive electron density and the structure of indole and pyrrole derivatives. Thus PQQ exhibits strong antioxidant feature [5]. Recently, study showed that higher concentrations of PQQ (50-100 μM) could result in 2-5 fold increase in apoptosis-inducing of U937 human promonocytic lymphoma cells through the depletion of cellular glutathione and the increasing of intracellular ROS [9]. Other studies also demonstrated that PQQ could regulate cell function of different cells and induce cell apoptosis, directly or indirectly [5, 10, 11]. However, there is no study that has investigated the effect of PQQ on directly inducing solid tumor cell apoptosis and the associated mechanisms.
In this study, the apoptosis of three tumor cell lines (Neuro-2A, A549 and HCC-LM3) induced by PQQ were measured and the potential mechanisms were investigated. The result showed that the proliferations of three cell lines were suppressed by PQQ in a dose- and time-dependent manner. PQQ exhibited potent anti-cancer activity while imposed comparably minimal cytotoxicity to 2 normal cell lines (HRPTEpiC and HUVEC), a finding concordant with previous reports that PQQ would stimulate the normal cell lines (A431 and NIH3T3) proliferation [14, 15]. Typical apoptotic cellular morphological changes such as poor growth, membrane blebbing, cellular shrinkage and chromatin condensation were observed with real-time cell monitoring system. Moreover, flow cytometry and Annexin V-FITC/PI staining showed that the percentages of apoptosis caused by PQQ in A549 and Neuro-2A cells were increased in a dose-dependent manner. PQQ-induced apoptosis of the 3 tumor cell lines were all alleviated by the treatment of Z-VAD-FMK, a pan-caspase inhibitor (Figure 3), which confirmed the participation of caspase in PQQ-induced apoptosis. The fact that Z-VAD-FMK could not completely block PQQ-induced apoptosis, suggesting other pathways involvement in the PQQ-induced cell apoptotic process. However, the caspase-dependent pathway might play a leading role, considering the significantly 2-fold decrease of apoptosis in A549 cells after Z-VAD-FMK treatment.
PQQ triggered apoptotic process at lower concentrations (30-75 μM), and the apoptotic effects became significant at higher concentrations (120-300 μM). This finding is concordant with a previous study that PQQ induced programmed Jurkat cell death by increasing the caspase-3 activity [5]. The proliferation inhibition and apoptosis-inducing effects of PQQ were less remarkable in HCC-LM3 cells at lower concentrations than that in A549 and Neuro-2A cells. It suggested that different tumor cells have different sensitivities to PQQ. Nonetheless, the results indicated that the apoptosis of HCC-LM3 cell induced by PQQ was also probably via the caspase-dependent pathway. Taken together, the growth inhibitory effects of PQQ on solid tumor cells of A549, Neuro-2A and HCC-LM3 were demonstrated to be largely resulted from apoptosis.
The current study measured intracellular ROS production, ATP release, mitochondrial membrane potential, cell cycle distribution and related protein signaling pathways to explore the anti-tumor and apoptosis-inducing mechanisms of PQQ. ROS plays a vital role in apoptosis induction under both physiological and pathological conditions. The major source of intracellular ROS is mitochondria [16]. Numerous evidences suggest that impaired mitochondria could stimulate ROS generation, continuous accumulation of ROS triggers apoptosis via the intrinsic pathway by opening of mitochondrial permeability transition pore (PTP) and collapsing of mitochondrial membrane potential, ultimately caused caspase-3 activation and cell death [17, 18]. Our data indicated that PQQ treatment resulted in an enhanced generation of ROS in time‑ and dose‑dependent manner in all 3 tumor cells. In Neuro-2A cells the accumulation of ROS preceded the other 2 cell lines. It might suggest that Neuro-2A cells are more sensitive to PQQ treatment on ROS production. Collectively, these data suggested that the PQQ-induced apoptosis is associated with ROS generation, which is in agreement with previous report [9].
Cellular ATP content is associated with the number of metabolically viable cells. Our data showed that PQQ treatment decreased the cellular content of ATP in a time- and dose-dependent manner in all the 3 tumor cells. Decreased ATP contents of HCC-LM3 cells were only apparent when exposed to higher concentrations of PQQ, suggesting that the liver cancer cells might have a higher tolerance to PQQ. Our results also indicated that PQQ could dissipate mitochondrial membrane potential of A549 and Neuro-2A cells in a concentration-dependent manner, which might be related with decreased cellular ATP content and enhanced generation of ROS after PQQ treatment. Previous study [19] reported that in apoptotic cells, the loss of mitochondrial ATP synthesis and the increase of inter-membrane creatine phosphate concentrations might be consequences of the loss of mitochondrial membrane potential caused by the translocation of proapoptotic BH3 proteins to the mitochondria. The mitochondria play a crucial role in cell intrinsic apoptosis pathway. The mitochondrial membrane permeability transition is a critical step in the induction of intrinsic apoptosis and often represents the earliest apoptotic signal [20]. During apoptosis, mitochondria suffer specific damages that result in loss of function, and release of cytochrome c that can potentially halt the electron transfer, leading to failure in maintaining the mitochondrial membrane potential and ATP synthesis [21].
The sub-G0/G1 phase, appearing left to the G0/G1 peak in DNA distribution, represents the cell population undergoing apoptosis. The current results showed that with the increasing concentration of PQQ, significant apoptotic peak appeared in A549 and Neuro-2A cells. The cell cycle data suggested that the number of A549 and Neuro-2A cells entering the cell cycle decreased with the increasing of PQQ concentration (Figure 7A-7D). This pointed to G0/G1 arrest as one of the mechanisms for PQQ inhibition of A549 cell growth. Studies reported that Usnic Acid and Tanshinone treated A549 cells also resulted in G0/G1 arrest, which possibly could be associated with decreased expression of cyclin-dependent kinase (CDK)4, CDK6, and Cyclin D1, and inhibition of Cyclin A and Cyclin B [22, 23]. In Neuro-2A cells, no significant cell cycle arrest was observed. However, combined with the results of ROS and ATP experiments, of which the production of ROS reached the peak at 12h and fall at 24h, and the ATP production significantly declined from 12h to 24h, implying that the occurrence of ROS accumulation and ATP declining might happen prior to the cell cycle changes. This supports a major role of the ROS-mediated mitochondrial pathway in the PQQ-induced Neuro-2A cell apoptosis, concordant with previous studies [24, 25].
Bcl-2 is an anti-apoptotic protein known as a mitochondrial membrane protein which can block programmed cell death and tumorigenesis upon activation [26]. The Bcl-2 protein family controls the integrity of the outer-mitochondrial membrane. During apoptosis, the change of anti- and pro-apoptotic proteins of Bcl-2 family causes the mitochondrial membrane potential across the membrane to collapse, leading to the release of cytochrome c into the cytoplasm, the formation of the apoptosome and an increase in effector caspase activities, thereby resulting in apoptosis [27-29]. Caspase activation is generally considered a key hallmark of apoptosis in these pathways [30]. Our results demonstrated that the expression levels of activated caspase-3 were increased in a dose-dependent manner in 3 cell lines, which implied the participation of caspase-3 in the PQQ-induced apoptosis. Given the fact that caspases play a central role in the apoptotic cascade, these results strongly supported the hypothesis that PQQ treatment causes the collapses of the mitochondrial membrane potential and the reductions of Bcl-2 protein, and initiates the corresponding elevation of activated caspase-3. This finding was backup by recent studies reporting that grape seed proanthocyanidins induces apoptosis of A549 by loss of mitochondrial membrane potential, G1 phase arresting, down-regulation of the anti-apoptotic proteins Bcl-2 and activation of caspases 9 and 3 [31]. The activation of A549 cellular apoptosis signal is conducted via Bcl-2 suppression and p53 and Bax activation [32]. The butein-induced Neuro-2A cells apoptosis is characterized by increased intracellular reactive oxygen species (ROS) levels and reduced Bcl-2/Bax ratio [25]. Taken together, we propose that the apoptosis-inducing effect of PQQ on A549 and Neuro-2A cells is partly through the loss of mitochondrial membrane potential and reduction of Bcl-2 protein.
Aberrant activation of the signaling pathway was frequently observed in human tumor cells, however, little is known about the effect of PQQ on tumor cell signaling pathway. There are 4 mitogen-activated protein kinase (MAPK) families categorized by sequence homology and functions: ERK1/2 (extracellular signal-regulated kinase), p38, JNK (c-Jun N-terminal kinase), and ERK5 [33]. Activation of p38MAPK is predominantly implicated in inducing cancer cell apoptosis and displaying pro-apoptosis by several chemotherapeutic drugs in experimental settings [34-36]. PQQ seemed to modulate cell apoptosis and mitochondrial assembly signaling pathways [37, 38]. In the current study, the expressions of p38MAPK, pERK1/2, ERK2 and MEK2 in A549 cells were markedly up-regulated by PQQ at 15-300 µM. The results were also supported by the study reporting that activation of JNK and p38MAPK caused phosphorylation and translocation of Bax into mitochondria to cause apoptosis via intrinsic pathway [39]. ERK is well known as one of the MAPKs and for its prominent role in controlling proliferation, differentiation and cell survival [40]. The ERK1/2 are activated by external and internal stimuli in numerous cell types and played a central role in many signal transduction pathways, which can directly phosphorylate many target proteins including transcription factors (c-Jun, c-Myc, P53), leading to the induction of many cell cycle proteins (p21, Cyclin D1, cdk1) and then the activation of transcription factor and apoptotic factors (caspase 9, bad, Bim), and finally cause cell death [41, 42].
Our data demonstrated that the expression levels of intracellular ERK2 were notably increased 3-fold compared to that of the control group in A549 cells, which would suggest that ERK2, probably activated by PQQ treatment, induces p53 up-expression and Bcl-2 suppression [31, 32], Cyclin D1 and CDK4,6 inhibition [22], while blocking cell cycle progression, eventually promotes the caspase cascade reaction, resulting in cell apoptosis. This inference is in concordance with a previous report [43]. However, using probes to quantify the levels of these MAPKs in Neuro-2A cells exhibited that PQQ treatment caused significant decrease in levels of ERK2 and MEK2, but increase of pERK1/2 levels, and have no effect on p38MAPK levels (data not shown), suggesting that this effect may be cell type specific. Previous study reported that the anti-epileptic drug valproic acid increased the degree of ERK1/2 phosphorylation in Neuro-2A and BT4Cn cells as well [44]. These results are in agreement with other recent works [45, 46]. These observations permit us to propose that PQQ concentration greater than 15-30 μM may exert its apoptosis-inducing effect on A549 and Neuro-2A cells via the aforementioned mechanisms. However, other molecular mechanism for the pro-apoptosis effects of PQQ remains to be determined.
The authors acknowledge that these findings need to be further investigated in in vivo settings, and in the current study no positive controls were included which might jeopardize the power of the results. It might be argued that currently there is no compound with similar molecular structures in clinical application that could be used as a reference. Thus, the current study focused primarily on the anti-tumor effects of PQQ and highlighted the associated potential mechanisms. In summary, despite the limitations, this work does for the first time report the effects of PQQ on solid tumor cells of A549, Neuro-2A and HCC-LM3 in vitro, that PQQ could outstandingly suppress the A549 and Neuro-2A cell proliferation through the mitochondrial-dependent apoptosis pathway while have comparably minimal toxicity towards normal cells. The underlying mechanisms might include, but not limited to, cell cycle arrest at G0/G1 phase, accumulation of intracellular ROS, decline in ATP levels, disruption of mitochondrial membrane potential in conjunction with down-regulation of Bcl-2 protein expression and enhancement of the activated caspase-3 expression, and the enrichment of signal pathway proteins of p38MAPK, pERK1/2, ERK2 and MEK2 in A549 cells; reduction of ERK2 and MEK2 in Neuro-2A cells. The significance of our findings is the possibility of developing new venues to target cancers. However, as the anti-tumor activity of PQQ is cell type specific, why some tumor cells are sensitive to it and others are not needs to be further investigated. Future studies on the mechanistics and the potential role of PQQ in cancer prevention and treatment are warranted.
Acknowledgements
We thank Mr Qunye Tang for providing the ATP reagent.
This study is supported by National Science Foundation of China (Grant No. 30972737 and 81170473), Young Scholars of Fudan University (Grant No. 431), and Pujiang talent research grant (Grant No. 10PJ1403600) from the Shanghai Committee of Science and Technology.
Competing Interests
The authors have declared that no competing interest exists.
References
1. Salisbury SA, Forrest HS, Cruse WB, Kennard O. A novel coenzyme from bacterial primary alcohol dehydrogenases. Nature. 1979;280:843-4
2. Kasahara T, Kato T. Nutritional biochemistry: A new redox-cofactor vitamin for mammals. Nature. 2003;422:832. doi:10.1038/422832a
3. Kumazawa T, Sato K, Seno H, Ishii A, Suzuki O. Levels of pyrroloquinoline quinone in various foods. The Biochemical journal. 1995;307( Pt 2):331-3
4. Noji N, Nakamura T, Kitahata N, Taguchi K, Kudo T, Yoshida S. et al. Simple and sensitive method for pyrroloquinoline quinone (PQQ) analysis in various foods using liquid chromatography/electrospray-ionization tandem mass spectrometry. Journal of agricultural and food chemistry. 2007;55:7258-63 doi:10.1021/jf070483r
5. He K, Nukada H, Urakami T, Murphy MP. Antioxidant and pro-oxidant properties of pyrroloquinoline quinone (PQQ): implications for its function in biological systems. Biochemical pharmacology. 2003;65:67-74
6. Tao R, Karliner JS, Simonis U, Zheng J, Zhang J, Honbo N. et al. Pyrroloquinoline quinone preserves mitochondrial function and prevents oxidative injury in adult rat cardiac myocytes. Biochemical and biophysical research communications. 2007;363:257-62 doi:10.1016/j.bbrc.2007.08.041
7. Hara H, Hiramatsu H, Adachi T. Pyrroloquinoline quinone is a potent neuroprotective nutrient against 6-hydroxydopamine-induced neurotoxicity. Neurochemical research. 2007;32:489-95 doi:10.1007/s11064-006-9257-x
8. Xiong XH, Zhao Y, Ge X, Yuan SJ, Wang JH, Zhi JJ. et al. Production and radioprotective effects of pyrroloquinoline quinone. International journal of molecular sciences. 2011;12:8913-23 doi:10.3390/ijms12128913
9. Shankar BS, Pandey R, Amin P, Misra HS, Sainis KB. Role of glutathione in augmenting the anticancer activity of pyrroloquinoline quinone (PQQ). Redox report: communications in free radical research. 2010;15:146-54 doi:10.1179/174329210X12650506623762
10. Tchaparian E, Marshal L, Cutler G, Bauerly K, Chowanadisai W, Satre M. et al. Identification of transcriptional networks responding to pyrroloquinoline quinone dietary supplementation and their influence on thioredoxin expression, and the JAK/STAT and MAPK pathways. The Biochemical journal. 2010;429:515-26 doi:10.1042/BJ20091649
11. Zhang Q, Shen M, Ding M, Shen D, Ding F. The neuroprotective action of pyrroloquinoline quinone against glutamate-induced apoptosis in hippocampal neurons is mediated through the activation of PI3K/Akt pathway. Toxicology and applied pharmacology. 2011;252:62-72 doi:10.1016/j.taap.2011.02.006
12. Toimela T, Tahti H, Ylikomi T. Comparison of an automated pattern analysis machine vision time-lapse system with traditional endpoint measurements in the analysis of cell growth and cytotoxicity. Alternatives to laboratory animals: ATLA. 2008;36:313-25
13. Zhang P, Xu Y, Sun J, Li X, Wang L, Jin L. Protection of pyrroloquinoline quinone against methylmercury-induced neurotoxicity via reducing oxidative stress. Free radical research. 2009;43:224-33 doi:10.1080/10715760802677348
14. Kumazawa T, Hiwasa T, Takiguchi M, Suzuki O, Sato K. Activation of Ras signaling pathways by pyrroloquinoline quinone in NIH3T3 mouse fibroblasts. International journal of molecular medicine. 2007;19:765-70
15. Kimura K, Takada M, Ishii T, Tsuji-Naito K, Akagawa M. Pyrroloquinoline quinone stimulates epithelial cell proliferation by activating epidermal growth factor receptor through redox cycling. Free radical biology & medicine. 2012;53:1239-51 doi:10.1016/j.freeradbiomed.2012.07.015
16. Simon HU, Haj-Yehia A, Levi-Schaffer F. Role of reactive oxygen species (ROS) in apoptosis induction. Apoptosis: an international journal on programmed cell death. 2000;5:415-8
17. Pelicano H, Feng L, Zhou Y, Carew JS, Hileman EO, Plunkett W. et al. Inhibition of mitochondrial respiration: a novel strategy to enhance drug-induced apoptosis in human leukemia cells by a reactive oxygen species-mediated mechanism. The Journal of biological chemistry. 2003;278:37832-9 doi:10.1074/jbc.M301546200
18. Bras M, Queenan B, Susin SA. Programmed cell death via mitochondria: different modes of dying. Biochemistry Biokhimiia. 2005;70:231-9
19. Vander Heiden MG, Chandel NS, Schumacker PT, Thompson CB. Bcl-xL prevents cell death following growth factor withdrawal by facilitating mitochondrial ATP/ADP exchange. Molecular cell. 1999;3:159-67
20. Lowe SW, Cepero E, Evan G. Intrinsic tumour suppression. Nature. 2004;432:307-15 doi:10.1038/nature03098
21. Marchetti P, Castedo M, Susin SA, Zamzami N, Hirsch T, Macho A. et al. Mitochondrial permeability transition is a central coordinating event of apoptosis. The Journal of experimental medicine. 1996;184:1155-60
22. Singh N, Nambiar D, Kale RK, Singh RP. Usnic Acid inhibits growth and induces cell cycle arrest and apoptosis in human lung carcinoma a549 cells. Nutrition and cancer. 2013;65(Suppl 1):36-43 doi:10.1080/01635581.2013.785007
23. Tung YT, Chen HL, Lee CY, Chou YC, Lee PY, Tsai HC. et al. Active Component of Danshen (Salvia miltiorrhiza Bunge), Tanshinone I, Attenuates Lung Tumorigenesis via Inhibitions of VEGF, Cyclin A, and Cyclin B Expressions. Evidence-based complementary and alternative medicine: eCAM. 2013;2013:319247. doi:10.1155/2013/319247
24. Antonoff MB, Chugh R, Borja-Cacho D, Dudeja V, Clawson KA, Skube SJ. et al. Triptolide therapy for neuroblastoma decreases cell viability in vitro and inhibits tumor growth in vivo. Surgery. 2009;146:282-90 doi:10.1016/j.surg.2009.04.023
25. Chen YH, Yeh CW, Lo HC, Su SL, Hseu YC, Hsu LS. Generation of reactive oxygen species mediates butein-induced apoptosis in neuroblastoma cells. Oncology reports. 2012;27:1233-7 doi:10.3892/or.2012.1632
26. Korsmeyer SJ. BCL-2 gene family and the regulation of programmed cell death. Cancer research. 1999;59:1693s-700s
27. Luo X, Budihardjo I, Zou H, Slaughter C, Wang X. Bid, a Bcl2 interacting protein, mediates cytochrome c release from mitochondria in response to activation of cell surface death receptors. Cell. 1998;94:481-90
28. Chipuk JE, Moldoveanu T, Llambi F, Parsons MJ, Green DR. The BCL-2 family reunion. Molecular cell. 2010;37:299-310 doi:10.1016/j.molcel.2010.01.025
29. Rolland SG, Conradt B. New role of the BCL2 family of proteins in the regulation of mitochondrial dynamics. Current opinion in cell biology. 2010;22:852-8 doi:10.1016/j.ceb.2010.07.014
30. Janicke RU, Sprengart ML, Wati MR, Porter AG. Caspase-3 is required for DNA fragmentation and morphological changes associated with apoptosis. The Journal of biological chemistry. 1998;273:9357-60
31. Singh T, Sharma SD, Katiyar SK. Grape proanthocyanidins induce apoptosis by loss of mitochondrial membrane potential of human non-small cell lung cancer cells in vitro and in vivo. PloS one. 2011;6:e27444. doi:10.1371/journal.pone.0027444
32. Jung KH, Noh JH, Kim JK, Eun JW, Bae HJ, Xie HJ. et al. HDAC2 overexpression confers oncogenic potential to human lung cancer cells by deregulating expression of apoptosis and cell cycle proteins. Journal of cellular biochemistry. 2012;113:2167-77 doi:10.1002/jcb.24090
33. Dhanasekaran DN, Johnson GL. MAPKs: function, regulation, role in cancer and therapeutic targeting. Oncogene. 2007;26:3097-9 doi:10.1038/sj.onc.1210395
34. Hu M, Du Q, Vancurova I, Lin X, Miller EJ, Simms HH. et al. Proapoptotic effect of curcumin on human neutrophils: activation of the p38 mitogen-activated protein kinase pathway. Critical care medicine. 2005;33:2571-8
35. Zarubin T, Han J. Activation and signaling of the p38 MAP kinase pathway. Cell research. 2005;15:11-8 doi:10.1038/sj.cr.7290257
36. Owens TW, Valentijn AJ, Upton JP, Keeble J, Zhang L, Lindsay J. et al. Apoptosis commitment and activation of mitochondrial Bax during anoikis is regulated by p38MAPK. Cell death and differentiation. 2009;16:1551-62 doi:10.1038/cdd.2009.102
37. Van Laethem A, Van Kelst S, Lippens S, Declercq W, Vandenabeele P, Janssens S. et al. Activation of p38 MAPK is required for Bax translocation to mitochondria, cytochrome c release and apoptosis induced by UVB irradiation in human keratinocytes. FASEB journal: official publication of the Federation of American Societies for Experimental Biology. 2004;18:1946-8 doi:10.1096/fj.04-2285fje
38. Vermeulen L, Vanden Berghe W, Beck IM, De Bosscher K, Haegeman G. The versatile role of MSKs in transcriptional regulation. Trends in biochemical sciences. 2009;34:311-8 doi:10.1016/j.tibs.2009.02.007
39. Kim BJ, Ryu SW, Song BJ. JNK- and p38 kinase-mediated phosphorylation of Bax leads to its activation and mitochondrial translocation and to apoptosis of human hepatoma HepG2 cells. The Journal of biological chemistry. 2006;281:21256-65 doi:10.1074/jbc.M510644200
40. Johnson GL, Lapadat R. Mitogen-activated protein kinase pathways mediated by ERK, JNK, and p38 protein kinases. Science. 2002;298:1911-2 doi:10.1126/science.1072682
41. McCubrey JA, Steelman LS, Chappell WH, Abrams SL, Wong EW, Chang F. et al. Roles of the Raf/MEK/ERK pathway in cell growth, malignant transformation and drug resistance. Biochimica et biophysica acta. 2007;1773:1263-84 doi:10.1016/j.bbamcr.2006.10.001
42. Meloche S, Pouyssegur J. The ERK1/2 mitogen-activated protein kinase pathway as a master regulator of the G1- to S-phase transition. Oncogene. 2007;26:3227-39 doi:10.1038/sj.onc.1210414
43. He B, Liu SQ, Li HH. [The extracellular signal-regulated kinase was promoted by pyrroloquinoline quinine in cultured Schwann cells]. Zhonghua zheng xing wai ke za zhi = Zhonghua zhengxing waike zazhi = Chinese journal of plastic surgery. 2010;26:444-7
44. Gotfryd K, Skladchikova G, Lepekhin EA, Berezin V, Bock E, Walmod PS. Cell type-specific anti-cancer properties of valproic acid: independent effects on HDAC activity and Erk1/2 phosphorylation. BMC cancer. 2010;10:383. doi:10.1186/1471-2407-10-383
45. Kim JK, Choi JW, Lim S, Kwon O, Seo JK, Ryu SH. et al. Phospholipase C-eta1 is activated by intracellular Ca(2+) mobilization and enhances GPCRs/PLC/Ca(2+) signaling. Cellular signalling. 2011;23:1022-9 doi:10.1016/j.cellsig.2011.01.017
46. Sidiropoulou E, Sachana M, Flaskos J, Harris W, Hargreaves AJ, Woldehiwet Z. Fipronil interferes with the differentiation of mouse N2a neuroblastoma cells. Toxicology letters. 2011;201:86-91 doi:10.1016/j.toxlet.2010.12.009
Author contact
![]() Corresponding author: Yunfeng Cheng, MD, PhD. Department of Hematology, Biomedical Research Center, Zhongshan Hospital, Fudan University, 180 Fenglin Rd, Shanghai 200032, China. Email: yfchengedu.cn Hao Chen, MD, PhD. Department of Cardiothoracic Surgery, Tongji Hospital, Tongji University, 389 Xincun Rd, Shanghai 200065, China. Email: h.chenedu.cn Tel: +86-21- 64041990 ext. 2295 Fax: +86-21-64041990 ext. 2295.
Corresponding author: Yunfeng Cheng, MD, PhD. Department of Hematology, Biomedical Research Center, Zhongshan Hospital, Fudan University, 180 Fenglin Rd, Shanghai 200032, China. Email: yfchengedu.cn Hao Chen, MD, PhD. Department of Cardiothoracic Surgery, Tongji Hospital, Tongji University, 389 Xincun Rd, Shanghai 200065, China. Email: h.chenedu.cn Tel: +86-21- 64041990 ext. 2295 Fax: +86-21-64041990 ext. 2295.