3.2
Impact Factor
ISSN: 1837-9664
J Cancer 2015; 6(1):90-97. doi:10.7150/jca.10739 This issue Cite
Research Paper
Discovery of Invasion Routes for Nasopharyngeal Adenoid Cystic Carcinoma
Department of Medical Imaging & Image Guided Therapy, Sun Yat-Sen University Cancer Center; State Key Laboratory of Oncology in South China; Collaborative Innovation Center for Cancer Medicine; East Dong Feng Road 651, Guangzhou, Guangdong, 510060.P.R.China.
*These authors contributed to this work equally.
Received 2014-10-6; Accepted 2014-11-20; Published 2015-1-1
Abstract
The aim of this study is to discover regional invasion routes for nasopharyngeal adenoid cystic carcinoma (NACC) through analyses of the magnetic resonance (MR) images and comparison with keratinizing squamous cell carcinoma (KSCC). Both MR results and clinical records were retrospectively reviewed for 18 patients with NACC and 182 patients with KSCC. The metastasis routes of NACC were identified by analysis of MR images of patients who underwent magnetic resonance imaging (MRI). There were significant differences in skull base invasion and cavernous sinus invasion (p = 0.020 and 0.028, respectively) while parapharyngeal space invasion rate was not. The laryngopharynx invasion rate and external pterygoid muscle invasion rate were higher in NACC patients than that in KSCC patients (16.7% vs. 0.5 %, p = 0.002; 27.8% vs. 11.0%, p = 0.040, respectively). Paralysis of the cranial nerves had a significant higher incidence in the NACC group compared to the KSCC group (66.7% vs. 8.2%, p < 0.001). There was significant difference in invasion to the neural foramen between the NACC and KSCC groups (66.7% vs. 36.3%, p = 0.020). Foramen ovale was a common invasion site, significantly higher in NACC patients than in KSCC patients (50.0% vs. 24.1%, p = 0.018). Based on the MRI findings, a regional invasion model of NACC with two possible routes has been built, including aggressive local infiltration along submucosa to laryngopharynx or external pterygoid muscle, and extension from pharyngonasal cavity, through cranial nerve canal to cavernous sinus. The significant difference in overall survival (OS) time between the two different invasion routs and the recurrent rates in different regions also supported the validity of the invasion model.
Keywords: nasopharyngeal adenoid cystic carcinoma, keratinizing squamous cell carcinoma, invasion routes, MRI, paralyzed cranial nerve.
Introduction
Primary nasopharyngeal adenoid cystic carcinoma (NACC), classified as a pathological type of adenocarcinoma, is a rare epithelioid malignancy that represents only 0.13% of all nasopharyngeal malignancies [1], but occurs most frequently in the salivary glands [2]. Even in southern China, where there is the highest incidence rate of nasopharyngeal carcinoma (NPC), the most common malignancy of the nasopharynx, primary NACC is rarely reported [3]. To date, only five studies on NACC with a total number of 90 cases have been reported worldwide [4, 5]. NACC is characterized by slow growth, frequent local recurrence, and metastatic spread [6], as Liu et al. has summarized the clinical characters, management approaches, and prognostic factors from 26 patients in a single institution [7]. These studies focus more on the invasion patterns, treatment approaches and prognostic factors. However, regional invasion routes for NACC, especially with regard to its proliferation and malignancy, are not investigated and reported yet.
Magnetic resonance imaging (MRI) is widely used for diagnosing carcinomas of the head and neck, because this method provides satisfactory morphological information about the structures. Therefore, in this study we tried to discover the regional invasion routes using MR images of NACC in comparison with MR findings for keratinizing squamous cell carcinoma (KSCC), which is the main histological malignancy of primary NPC. Based on the analyses of MR images, we have proposed two possible routes for NACC regional invasion, including aggressive local infiltration and extension along the cranial nerve canal.
Materials and Methods
Patients selected
A database search for patients who underwent MRI examination at our hospital was performed to identify NACC patients with a confirmed pathological diagnosis between December 2002 and December 2012, and KSCC patients with a confirmed pathological diagnosis between January 2005 and May 2005. In total, 18 patients with NACC and 182 patients with KSCC were identified. This study was approved by institutional review board, and written consent was issued.
MRI analysis
MRI scan was performed with a 1.5 T MRI unit (Gyroscan Intera, Philips Medical Systems, Best, The Netherlands) fixed with a head coil (Philips Medical Systems, Best, The Netherlands). The head and neck MRI protocol included pre-enhanced axial, sagittal, and coronal T1-weighted sequences; axial T2-weighted sequences; and dynamic contrast-enhanced axial, sagittal, and coronal T1-weighted sequences and diffusion-weighted imaging (DWI). The parameters for these sequences were as follows: (1) T1-weighted fast-field echo (FFE) sequence (Repetition Time (TR): 500-600; Echo Time (TE): 10-20 ms; axial slice thickness: 5.0 mm; axial slice interval: 1.0 mm; coronal and sagittal slice thickness: 6.0 mm; slice interval: 1.0 mm; matrix scan: 512 × 512); (2) T2-weighted turbo-spin echo sequence (TR: 4000-6000; TE: 95-110 ms; axial slice thickness: 5.0 mm; axial slice interval: 1.0 mm; coronal and sagittal slice thickness: 6.0 mm; slice interval: 1.0 mm; and matrix scan: 512 × 512). The contrast medium was intravenously administered at a dose of 0.2 mmol/kg (Gadolinium-DTPA, Magnevist, Schering) after pre-enhanced T1-weighted and T2-weighted sequences for dynamic contrast-enhanced images.
All the images were recorded and transferred to the Centricity RIS/PACS workstation (General Electric Healthcare Centricity RIS CE Systems) for post-review. The MR images were analyzed by an experienced radiologist to examine the characteristics of each lesion, including the location, shape, size, number, edge, and attenuation or intensity of the pre-enhanced and contrast-enhanced lesions. Professional MRI experts reviewed the images for KSCC and NACC patients, and the diagnoses were made by consensus. On the pre-enhanced MR images, signal intensity was classified as hypointense, isointense, or hyperintense. Conversely, on the dynamic contrast-enhanced MR images, the enhancement intensity was classified as no, mild, moderate, or significant enhancement [8]. Tumors were staged according to the TNM classification of NACC and KSCC adapted in 2010, in the seventh edition of the American Joint Committee on Cancer TNM classification [9].
The evaluation criteria for MRI-based diagnosis were as follows [10]:
a. Parapharyngeal space invasion: the lesion extended beyond the pharyngobasilar fascia on the axial images;
b. Retropharyngeal lymph node metastases: diameter ≥ 5 mm, obvious necrosis, or the presence of a hyperintense ring on the axial and coronal images;
c. Nasal cavity invasion: the lesion extended beyond the line between both sides of the pterygopalatine fossa on axial images;
d. Oropharynx invasion: the lesion extended beyond the line along the inferior edge of the anterior arch or through the atlanto-axial articulation on the sagittal images;
e. Laryngopharynx invasion: the lesion extended beyond the upper edge of the epiglottis on the sagittal images;
f. Skull base invasion: Any part of the pterygoid process (e.g., medial plate, lateral plate, and pterygoid base), petrous apex, clivus, foramen lacerum, foramen ovale, basisphenoid, or foramen magnum was involved. The hyperintense marrow was replaced by a hypointense region representative of the tumor on the sagittal and coronal T1-weighted images. The enhancement of masses in the marrow, observed on the contrast-enhanced images, corresponded to the tumor entity observed on the sagittal and coronal contrast-enhanced T1-weighted images [11].
g. Cranial nerve invasion was assumed if at least one of the following criteria was met [12]. (1) Perineural infiltration: a soft tissue mass appeared within the neural canal on contrast-enhanced T1-weighted images; (2) Tumor spreading along the neural canal was observed, and MR images showed gross nerves with branches showing enhancement and/or enlargement of the neural foramens. Fat tissue was replaced by soft tissue, which showed enhanced signal intensity, and a primary tumor mass appeared in the neural foramens, including the foramen rotundum, the foramen ovale, the hypoglossal canal, the jugular foramen, the pterygopalatine fossa, and the pterygoid canal on the axial and coronal images; (3) Cranial nerve paralysis was observed.
Histopathological analysis
Biopsy was performed with a conchoscope to confirm the MRI diagnosis. The histological techniques included routine hematoxylin and eosin staining, and immunohistochemical evaluation. All pathological samples were retrospectively reviewed by two pathologists and the diagnoses were made by consensus. The macroscopic features of tumor tissues were recorded in terms of shape, size, number, edge, and capsule wall. Pathological types were evaluated according to World Health Organization (WHO) pathological criteria [13].
Statistical analysis
The MR images of NACC and KSCC patients were compared and the differences were evaluated. Differences between the two groups were analyzed by the χ2 test. p < 0.05 was considered to indicate statistical significance. The OS time with a 95% confidence interval (CI) was calculated by the Kaplan-Meier method with log-rank testing. All statistical tests were 2-sided, and a P < 0.05 was defined as statistically significant. The analyses were performed with the Statistical Package for the Social Science (SPSS) software (version 16.0, SPSS Inc., Chicago, IL, USA).
Results
Clinical data
In total, we gathered all information of 18 patients with NACC and 182 patients with KSCC. The NACC group comprised eight males (44.4%) and 10 females (55.6%), with the mean age of 47.1 years (range, 33-65 years). The KSCC group comprised 136 males (74.7%) and 46 females (25.3%), with the mean age of 46.8 years (range, 11-78 years). The demographic and clinical characteristics are shown in Table 1.
Significant differences were found in the incidence of stage T4 tumor (38.9% vs. 14.3%, p = 0.007) and N0 tumor (88.9% vs. 34.6%, p < 0.001) of NACC and KSCC patients, respectively.
General information of patients in two groups.
| Characteristics | NACC patient(n) | KSCC patient(n) |
|---|---|---|
| No. of patients | 18 | 182 |
| Mean age(y) | 47.1 | 46.8 |
| Gender | ||
| M | 8 | 136 |
| F | 10 | 46 |
| Serum EBV(%) | 3(16.7%) | 164(90.1%) |
| T Stage | ||
| T1 | 4 (22.2%) | 31 (31.9%) |
| T2 | 2 (11.1%) | 54 (29.7%) |
| T3 | 5 (27.7%) | 71(39.0%) |
| T4 | 7 (38.9%) | 26 (14.3%) |
| N Status | ||
| N0 | 16 (88.9%) | 63(34.6%) |
| N1 | 1(5.3%) | 65(35.5%) |
| N2 | 1 (5.3%) | 37(20.6%) |
| N3 | 0 (0%) | 26 (14.3%) |
| Staging | ||
| I | 4 (22.2%) | 25(13.7%) |
| II | 2 (11.1%) | 49(26.9%) |
| III | 4 (22.2%) | 78 (42.8%) |
| IVa-b | 8 (44.4%) | 30 (16.5%) |
NACC, nasopharyngeal adenoid cystic carcinoma; KSCC, keratinizing squamous cell carcinoma; n, number; No., numbers; M, male; F, female; EBV, Epstein-Barr virus; T: Primary Tumor, N: Regional Lymph Nodes.
Imaging findings
All the NACC lesions were located in the submucosal space of the pharyngonasal cavity without a well-defined boundary. The nasopharyngeal mucosal space was intact in six patients, but not intact in the other 12 patients. Seven NACC patients showed masses with several obviously lobulated shapes, spreading along the interspaces around the cavity, whereas the other NACC patients showed an incrassate mucosa with the thickness of 5-9 mm. The size of these masses was from 13 mm × 15 mm to 47 mm × 53 mm.
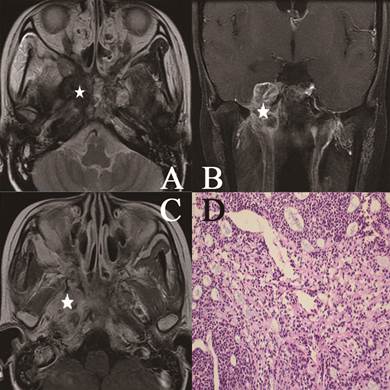
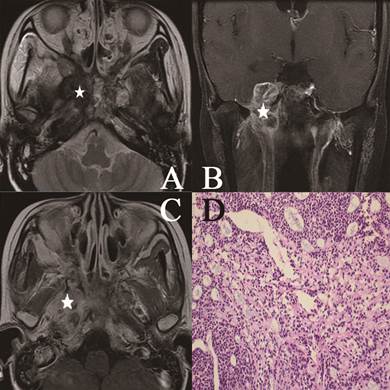
In the NACC group, lesions appeared isointense on T1-weighted images, hyperintense, isointense or slightly hyperintense on T2-weighted images, and significantly enhanced on contrast-enhanced T1-weighted images. Heterogeneous signal intensity was observed in 11 lesions, while homogeneous signal intensity was observed in seven lesions. Lesions that appeared as masses mostly showed heterogeneous signal intensity (high signal intensity in four patients, slightly high signal intensity in one patient, and isointense signal in two patients) on T2-weighted images (Fig 1). The grid-like changes representing hypointense areas in masses on contrast-enhanced T1-weighted images were different from the changes observed on T2-weighted images (Fig 2). Only four lesions presented as incrassate masses in the submucosal space and showed heterogeneous signals on T2-weighted images.
Head and neck MR images from a 25-year-old female with NACC. (A) Axial plane, T2-weighted image; (B) coronal plane, T1-weighted image after contrast medium administration; (C) Axial plane, T1-weighted image after contrast medium administration; (D) The characteristic eosinophilic basement membrane material in pseudocysts. True glands lined by cuboidal epithelium were visible (hematoxylin-eosin, original magnification ×200). The lesion invaded to the pterygopalatine fossa, the parapharyngeal space, the pterygoid process and the skull base representing isosignal intensity on the T2-weighted image (white star), high signal intensity on the contrast-enhanced T1-weighted image (white star). There were mixed hypointense, isointense, and hyperintense in the lesion (white star).
Head and neck MR images from a 51-year-old female with NACC. (A) Axial plane, T1-weighted image after contrast medium administration; (B) coronal plane, T1-weighted image after contrast medium administration; (C) Axial plane, T1-weighted image; (D) Cribriform growth pattern displaying several prominent pseudocysts surrounded by basaloid cells (hematoxylin-eosin, original magnification ×200). The lesion invaded the parapharyngeal space, the sphenoid sinus, the petrous apex and the muscles on the contrast-enhanced T1-weighted image without enhancement on the image (white star). On the T1-weighted image, the lesion represented low signal intensity invading the nasal cavity, the parapharyngeal space (white star).
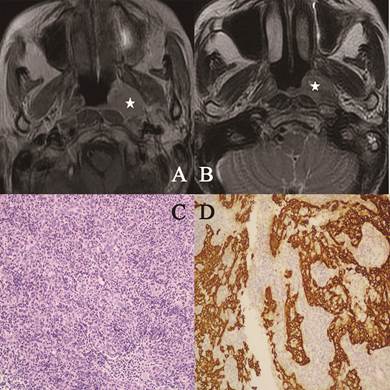
In contrast, most lesions in the KSCC group showed hypointensity on T1-weighted images, hyperintensity on T2-weighted images, and significant enhancement without a well-defined boundary on contrast-enhanced T1-weighted images (Fig 3).
Head and neck MR images from a 53-year-old female with KSCC. (A) Axial plane, T1-weighted image after contrast medium administration; (B) Axial plane, T1-weighted image after contrast medium administration. The lesion represented high signal intensity in part (white star); (C) Well-formed syncytial nests of cells are separated by lymphoid cells. The nuclei were large and vesicular with prominent nucleoli (hematoxylin-eosin, original magnification ×200); (D) The epithelial nature of the neoplasm was confirmed with keratin immunohistochemistry (CK 5/6, original magnification ×200).
Tumor metastasis findings
The common rate of metastasis to the parapharyngeal space, skull base and cavernous sinus was 77.8%, 66.7% and 33.3%, respectively, in the NACC patients, compared to 81.3%, 53.3% and 13.7%, respectively, in the KSCC patients. There were significant differences in skull base invasion and cavernous sinus invasion (p = 0.020 and 0.028, respectively) while parapharyngeal space invasion rate was not. The laryngopharynx invasion rate and external pterygoid muscle invasion rate were also higher in NACC patients than in KSCC patients (16.7% vs. 0.5 %, p = 0.002; 27.8% vs. 11.0%, p = 0.040, respectively). Conversely, the rate of lymph node metastasis was significantly higher in the KSCC group (64.8% vs. 11.1%, p < 0.001). The results are summarized in Table 2.
Classfication of cancer invasion site determined based on MRI data in the two groups.
| Local regions | NACC patients n (%) | KSCC patients n (%) | P |
|---|---|---|---|
| Parapharyngeal space | 14(77.8%) | 148(81.3%) | 0.715 |
| Skull base | 12(66.7%) | 66(36.3%) | 0.020 |
| Cavernous sinus | 6(33.3%) | 25(13.7 %) | 0.028 |
| External pterygoid muscle | 5(27.8%) | 20(11.0%) | 0.040 |
| Oropharynx | 4(22.2%) | 15(8.2%) | 0.075 |
| Orbit | 3(16.7%) | 13(7.1%) | 0.162 |
| Infratemporal fossa | 3(16.7%) | 9(4.9 %) | 0.081 |
| Laryngopharynx | 3(16.7%) | 1(0.5 %) | 0.002 |
| Nasal cavity | 3(16.7 %) | 53(29.1%) | 0.409 |
| Accessory nasal sinuses | 3(16.7 %) | 43(23.6 %) | 0.769 |
| Lymph node | 2(11.1 %) | 119(64.8%) | 0.000 |
| Cerebral parenchyma | 1(5.6%) | 2(1.1%) | 0.248 |
MRI, magnetic resonance imaging; NACC, nasopharyngeal adenoid cystic carcinoma; KSCC, keratinizing squamous cell carcinoma.
Ten patients in the NACC group showed skull neuropore invasion and 59 patients in the KSCC group showed neural foramen invasion, which indicates a higher invasion rate in the NACC group (55.6% vs. 32.4%, p = 0.049). Furthermore, the orbit and medial segments of the cranial nerves were possibly high-risk areas in NACC patients (44.4% vs. 15.4%, p = 0.002). The most common invasion was foramen ovale, which was significantly higher in NACC patients than in KSCC patients (50.0% vs. 24.1%, p = 0.018). There was also significant difference in the cavernous sinus invasion rate between the two groups (38.9% vs. 13.7%, p = 0.005). In the NACC group, seven patients had paralyzed cranial nerves (12 nerves, 66.7%): trigeminal nerves in eight patients (44.4%), abducens nerves in two patients (11.1%), hypoglossal nerve in one patient (5.6%), and facial nerve in one patient (5.6%). In comparison, the KSCC group had 11 patients showing paralyzed cranial nerves (15 nerves, 8.2%): trigeminal nerves in ten patients (5.5%), abducens nerves in three patients (1.6%), hypoglossal nerves in two patients (1.1%), and oculomotor nerve in one patient (0.5%). In addition, the cranial nerve paralysis rate was significantly higher in the NACC group (66.7% vs. 8.2%, p < 0.001). The results are displayed in Table 3.
Prognosis of two invasion routes
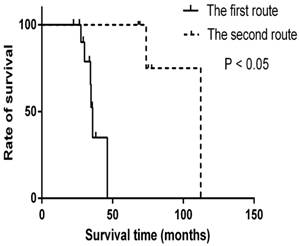
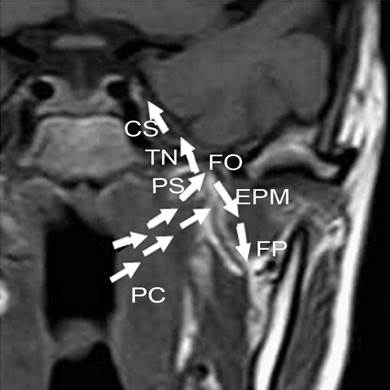
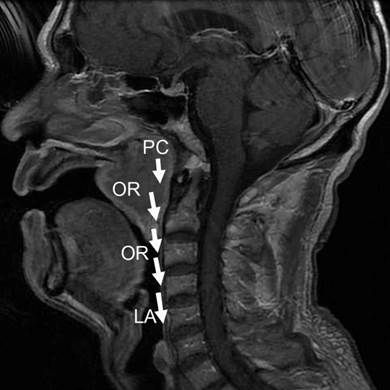
In the new regional invasion model, two preferential routes different from KSCC are proposed. The first route starts from pharyngonasal cavity, through parapharyngeal space, to trigeminal nerve, foramen ovale and finally to cavernous sinus, or through parapharyngeal space to fossa pterygopalatina and finally to external pterygoid muscle. The second route begins with pharyngonasal cavity, through oropharynx and then ends at laryngopharynx. The median survival time of patients with the first invasion route was 35.9 months while the median time for the second route was 112.3 months. There is significant difference between the two different invasion routs (p < 0.05) (Fig 4).
Recurrence rates
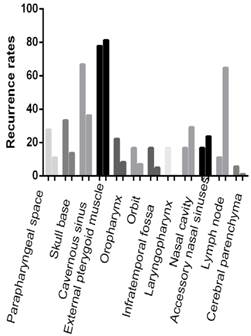
In the follow time, there were 13 patients (72.2%) suffered recurrence in NACC patients while 86 patients (47.3%) in KSCC patients (p < 0.05). The common recurrence occurred in the parapharyngeal space, skull base and cavernous sinus was 61.1%, 55.6% and 27.8%, respectively, in the NACC patients, compared to 78.6%, 39.0% and 17.0%, respectively, in the KSCC patients. There were significant differences in skull base invasion and cavernous sinus invasion (p < 0.05). The laryngopharynx invasion rate and external pterygoid muscle invasion rate were also higher in NACC patients than in KSCC patients (p < 0.05). These results were similar as invasion rates before treatments (Fig 5).
Survival time for the different invasion routes. The OS time of patients with different invasion routes was calculated by the Kaplan-Meier method with log-rank testing. There are significant differences in two invasion routes (p < 0.05).
The invasion rates of recurrence. The common recurrence occurred in the parapharyngeal space, skull base and cavernous sinus in the NACC patients. There were significant differences in skull base invasion, cavernous sinus invasion, laryngopharynx and external pterygoid muscle in NACC patients than in KSCC patients (p < 0.05). Others were not significant (p >0.05).
Relationship between appearance on MRI and cerebral nerveinvasion
| Cranial Nerve Lesions Location | NACC | KSCC | |||
|---|---|---|---|---|---|
| Patients n(%) | Paralytic cranial nerves (n) | Patients n(%) | Paralytic cranial nerves (n) | P | |
| Skull base or extracranial branch | |||||
| V3 extracranial Branch | 12 (66.7%) | V3 (8) | 53 (29.1%) | V3 (9) | 0.003 |
| Foramen Ovale | 9 (50.0%) | V3 (8) | 44 (24.1%) | V3 (9) | 0.018 |
| Fossa Pterygopalatina | 7 (38.9%) | V2 (5) | 35 (19.2%) | V2 (8) | 0.051 |
| Hypoglossal canal | 5 (27.7%) | XII (1) | 21 (11.5%) | XII (2) | 0.051 |
| Foramen lacerum | 3 (16.6%) | V2 (3) | 17 (9.3%) | V2 (7) | 0.323 |
| Jugular foramen | 2 (11.1%) | IX-Ⅺ (0) | 9 (4.9%) | IX-Ⅺ (0) | 0.274 |
| Internal acoustic meatus | 1 (5.6%) | VII (1) | 0 | 0 | - |
| Intracranial branch or orbit segment | |||||
| Cavernous sinus or Trigeminal ganglion | 7 (38.9%) | V (8) VI (2) | 25 (13.7%) | III (1) V (10) VI (3) | 0.005 |
| Inferior orbital fissure | 3 (16.6%) | V2 (1) | 12 (6.6%) | V2 (4) | 0.122 |
| Superior orbital fissure | 0 | 0 | 3 (1.6%) | III (1) V1 (3) | - |
V1, the first branch of the fifth nerve;V2, the second branch of the fifth nerve; V3, the third branch of the fifth nerve; V, III and VI, the fifth, third and sixth cranial nerve.-means no statistics. P value, comparison of numbers between NACC and KSCC.
Discussion
NACC is a rare malignancy with highly specific invasion patterns compared with other common NPCs [14]. Previous reports mostly focused on the treatment and the MRI features of this rare malignancy [15-18]. Few reports studied the extension patterns and just characterized NACC as slow growth, frequent local recurrence, and metastatic spread [19, 20]. However, the regional invasion routes were not clearly mapped. Therefore, we collected all possible MR data of patients diagnosed with NACC in ten years, re-examined and re-analyzed the MRI data in order to establish the invasion model for regional invasion routes of NACC.
Our collected data showed that female patients outnumbered males, with the female to male ratio being 5:4. The mean age was 47.1 years. The relationship of NACC to the EBV infection seemed to be weak (16.7% vs. 90.1%, p<0.001). These characteristics are similar to those reported in a previous study [3]. Our collected data also showed that the T4 stage was more frequently observed in NACC patients (38.9% vs. 14.3%, p = 0.007), which indicates that local infiltration is a more common invasion pattern in NACC patients. Moreover, distant metastasis (stage IV) occurred more frequently in NACC patients compared to that in KSCC patients (44.4% vs. 16.5%, p = 0.004), indicating that distant metastasis is another common invasion pattern in the NACC group. In sharp contrast, the higher N0 rate indicates that lymph node metastasis was less common in NACC (88.9% vs. 34.6%, p < 0.001). In summary, both aggressive local infiltration and distant metastasis are more likely than lymphatic metastasis in NACC patients, while lymph node metastasis is more common in KSCC patients. The latter observation is consistent with previous reports [17, 20, 21].
Compared with KSCC, NACC preferred two invasion patterns including regional invasion and distant metastasis, while the latter has been already reported. However, regional invasion routes have never been mapped. In this research, we tried to establish the regional invasion model based on the analyses of the MRI images and histological observations. In particular, we found that invasion of the parapharyngeal space (77.8% vs. 81.3%), skull base (66.7% vs. 36.3%), external pterygoid muscle (27.8% vs. 11.0%), laryngopharynx (16.7% vs. 0.5%) and cavernous sinus (33.3% vs. 13.7%) were more frequently detected in NACC cases than in KSCC cases. The higher invasion frequency to these structures is consistent with Liu et al.'s report that local invasion occurred on the roof or posterior wall of the nasopharynx (69.2%), the lateral nasopharyngeal wall (46.2%), the parapharyngeal space (15.4%), and the skull base (42.3%) in NACC patients [1]. From these findings, frequency of regional invasion has thus been clearly mapped.
This study has also indicated that neural infiltration was also frequently diagnosed in NACC patients and the rate of neural invasion in NACC patients was higher than that in KSCC patients. Trigeminal nerve invasion and neural foramen invasion were more frequently detected in NACC patients than in KSCC patients. The cranial nerve paralysis rate of NACC patients was significantly higher than that of KSCC patients, and paralysis of the trigeminal nerve was most frequently detected in NACC patients. Our findings seem not to be well agreed by Soprani et al.'s report that initial presentation of paresis of the cranial nerves and Horner's syndrome are infrequently observed in NACC patients [6]. The reason for the lower neural invasion rate reported by Sorprani et al. is probably because of the absence of typical neural symptoms in the early stage of neural invasion. Some kind of resistance to tumor invasion may retain in cranial nerves causing negative neurological examination [3].
These findings altogether have thus driven us to build a new regional invasion model. In this model, two preferential routes different from KSCC are proposed. One route starts from pharyngonasal cavity (100%), through parapharyngeal space (77.8%), to trigeminal nerve (66.7%), foramen ovale (50%) and finally to cavernous sinus (38.9%), or through parapharyngeal space (77.8%) to fossa pterygopalatina (38.9%) and finally to external pterygoid muscle (27.8%), as shown in Fig 6. The other route begins with pharyngonasal cavity (100%), through oropharynx (22.2%) and then ends at laryngopharynx (16.7%), as shown in Fig 7. These two routes would provide a clear map of regional invasion and new knowledge to treat NACC in a more efficient way. To strength our conclusion, we also analyzed the prognosis of patients with different invasion routes. We could find that there was significant difference in overall survival time in the two different invasion routes (p < 0.05), which provides important information for the invasion model. The recurrence rates of NACC and KSCC also supports the new regional invasion model.
The frist new model for regional invasion of NACC. One regional invasion route was pharyngonasal cavity (PC) → parapharyngeal space (PS) → trigeminal nerve (TN) → foramen ovale (FO) → cavernous sinus (CS), or from parapharyngeal space (PS) → fossa pterygopalatina (FP) → external pterygoid muscle (EPM), as shown with the white arrows.
The second new model for regional invasion of NACC. This route was pharyngonasal cavity (PC) → oropharynx (OR) → laryngopharynx (LA), as shown with white arrows.
Conclusion
The present study builds a new model for regional invasion of NACC, which is a rare malignancy of the nasopharynx. The invasion pattern includes local infiltration and distant metastasis, different from that observed in other common NPCs. In the new model, we have clearly mapped the regional invasion routes of NACC which has been supported by different survival time, which would provide important information for the treatment and bionomics of NACC.
Acknowledgements
We thank Zhijun Geng, Deling Wang from the Department of Radiology, for their assistance.
Competing Interests
The authors have declared that no competing interest exists.
References
1. Liu TR, Yang AK, Guo X. et al. Adenoid cystic carcinoma of the nasopharynx: 27-year experience. Laryngoscope. 2008;118:1981-1988
2. Acerbi F, Barani C, Martignoni M. First multi-color photometric study and preliminary elements for the low-mass ratio, possible progenitors of merging stars, W UMa systems TYC 3836-0854-1 and TYC 4157-0683-1. New Astronomy. 2014;31:1-7
3. Kokemueller H, Eckardt A, Brachvogel P, Hausamen JE. Adenoid cystic carcinoma of the head and neck--a 20 years experience. Int J Oral Maxillofac Surg. 2004;33:25-31
4. Schramm VL Jr, Imola MJ. Management of nasopharyngeal salivary gland malignancy. Laryngoscope. 2001;111:1533-1544
5. Wang CC, See LC, Hong JH, Tang SG. Nasopharyngeal adenoid cystic carcinoma: five new cases and a literature review. J Otolaryngol. 1996;25:399-403
6. Soprani F, Armaroli V, Venturini A, Emiliani E, Casolino D. A rare case of adenoid cystic carcinoma of the nasopharynx manifesting as Horner's syndrome: discussion and review of the literature. Acta Otorhinolaryngol Ital. 2007;27:216-219
7. Wen SX, Tang PZ, Xu ZG, Qi YF, Li ZJ, Liu WS. [Therapeutic modalities of nasopharyngeal adenoid cystic carcinoma]. Zhonghua Er Bi Yan Hou Tou Jing Wai Ke Za Zhi. 2006;41:359-361
8. Huang B, Wong CS, Whitcher B. et al. Dynamic contrast-enhanced magnetic resonance imaging for characterising nasopharyngeal carcinoma: comparison of semiquantitative and quantitative parameters and correlation with tumour stage. Eur Radiol. 2013;23:1495-1502
9. Kuno H, Fujii S. A case of adenoid cystic carcinoma arising from the nasopharynx. Jpn J Clin Oncol. 2013;43:942
10. Sharma M, Bartlett E, Yu E. Metastatic retropharyngeal lymph nodes in nasopharyngeal carcinoma: imaging criteria. Expert Rev Anticancer Ther. 2010;10:1703-1706
11. Dubrulle F, Souillard R, Hermans R. Extension patterns of nasopharyngeal carcinoma. Eur Radiol. 2007;17:2622-2630
12. Liu L, Liang S, Li L. et al. Prognostic impact of magnetic resonance imaging-detected cranial nerve involvement in nasopharyngeal carcinoma. Cancer. 2009;115:1995-2003
13. Luo S, Zhao L, Wang J. et al. Clinical outcomes for early-stage nasopharyngeal carcinoma with predominantly WHO II histology treated by intensity-modulated radiation therapy with or without chemotherapy in nonendemic region of China. Head Neck. 2013
14. Elkholti Y, Cosmidis A, Ardiet JM, Laffay L, De Bari B. Adenoid cystic carcinoma of the nasopharynx: a case report and a discussion about prognostic factors and the role of local treatments. Tumori. 2013;99:e55-60
15. Kokemueller H, Eckardt A, Brachvogel P, Hausamen J-E. Adenoid cystic carcinoma of the head and neck—a 20 years experience. Int J Oral Maxillofac Surg. 2004;33:25-31
16. Wen S, Tang P, Xu Z, Qi Y, Li Z, Liu W. [Therapeutic modalities of nasopharyngeal adenoid cystic carcinoma]. Zhonghua er bi yan hou tou jing wai ke za zhi= Chinese journal of otorhinolaryngology head and neck surgery. 2006;41:359-361
17. Yin J, Liu LZ, Gu MF. [Imaging and clinical features of nasopharyngeal adenoid cystic carcinoma]. Zhonghua Er Bi Yan Hou Tou Jing Wai Ke Za Zhi. 2013;48:930-933
18. Liu XW, Xie CM, Li H. et al. Nasopharyngeal adenoid cystic carcinoma: magnetic resonance imaging features in ten cases. Chin J Cancer. 2012;31:19-28
19. Soprani F, Armaroli V, Venturini A, Emiliani E, Casolino D. A rare case of adenoid cystic carcinoma of the nasopharynx manifesting as Horner's syndrome: discussion and review of the literature. Acta Otorhinolaryngologica Italica. 2007;27:216
20. Dubrulle F, Souillard R, Hermans R. Extension patterns of nasopharyngeal carcinoma. Eur Radiol. 2007;17:2622-2630
21. Liu TR, Yang AK, Guo X. et al. Adenoid Cystic Carcinoma of the Nasopharynx: 27-Year Experience. Laryngoscope. 2008;118:1981-1988
Author contact
![]() Corresponding author: Peihong Wu MD. Department of Medical Imaging & Image Guided Therapy, Sun Yat-Sen University Cancer Center; State Key Laboratory of Oncology in South China; Collaborative Innovation Center for Cancer Medicine; East Dong Feng Road 651, Guangzhou, Guangdong 510060, P. R. China. Email: 05010177com Tel: +86 2087343272. Fax: +86 2087343272.
Corresponding author: Peihong Wu MD. Department of Medical Imaging & Image Guided Therapy, Sun Yat-Sen University Cancer Center; State Key Laboratory of Oncology in South China; Collaborative Innovation Center for Cancer Medicine; East Dong Feng Road 651, Guangzhou, Guangdong 510060, P. R. China. Email: 05010177com Tel: +86 2087343272. Fax: +86 2087343272.

 Global reach, higher impact