Impact Factor ISSN: 1837-9664

 Global reach, higher impact
J Cancer 2015; 6(5):438-447. doi:10.7150/jca.10398 This issue Cite
Research Paper
Problems of Long Survival Following Surgery in Patients with NonBNonC-HCC: Comparison with HBV and HCV Related-HCC
Kiyokazu Hiwatashi1 ![]() , Shinichi Ueno2, Masahiko Sakoda1, Satoshi Iino1, Koji Minami1, Yoichi Yamasaki2, Keishi Okubo2, Masahiro Noda2, Hiroshi Kurahara1, Yuko Mataki1, Kosei Maemura1, Hiroyuki Shinchi3, Shoji Natsugoe1
, Shinichi Ueno2, Masahiko Sakoda1, Satoshi Iino1, Koji Minami1, Yoichi Yamasaki2, Keishi Okubo2, Masahiro Noda2, Hiroshi Kurahara1, Yuko Mataki1, Kosei Maemura1, Hiroyuki Shinchi3, Shoji Natsugoe1
1. Department of Digestive Surgery, Breast and Thyroid Surgery Graduate School of Medical and Dental Sciences Kagoshima University, Sakuragaoka 8-35-1 Kagoshima, 890-8520, Japan
2. Department of Clinical Oncology, Graduate School of Medical and Dental Sciences Kagoshima University
3. Faculty of Medical School of Health Sciences, Graduate School of Health Sciences Kagoshima University
Received 2014-8-24; Accepted 2015-2-5; Published 2015-3-7
Abstract
Background: The number of patients with hepatocellular carcinoma (HCC) in the absence of both hepatitis B virus surface antigen (HBsAg) and hepatitis C virus antibody (HCVAb) (NBNC-HCC) has been rapidly increasing in Japan. The objective of this study was to compare the clinical and pathological characteristics between patients with the NBNC-HCC, those with HBsAg positive HCC (B-related HCC) and HCVAb positive HCC (C-related HCC). A better understanding will facilitate the development of postoperative strategies to better manage patients with NBNC-HCC.
Methods: Consecutive 219 patients with primary HCC: (B-related, n=35; C-related, n = 104; NBNC, n = 80) were treated by hepatic resection or ablation. Clinicopathological characteristics including postoperative course were retrospectively compared between the three groups.
Results: When comparing within stage I and II, the NBNC-HCC group had improved recurrence free survival (RFS) compared to the C-related HCC (p = 0.013) but had not been good overall survival (OS). Moreover, the NBNC-HCC group showed higher rate of death due to other cancers and cardiovascular disease (p = 0.011) compared to the C-related HCC. Multivariate analysis revealed that the only prognostic factor for RFS in the NBNC-HCC group was high serum total bilirubin.
Conclusions: In the patients with the NBNC-HCC, elevated serum bilirubin could predict poor RFS after surgery. Furthermore, patients must be carefully followed-up not only for HCC but also for the occurrence of other critical diseases including multiple other cancers.
Keywords: hepatocellular carcinoma, NBNC-HCC, surgical resection, HBs antigen, HCV antibody
Introduction
Hepatocellular carcinoma (HCC) is the most common liver cancer. Currently, HCC is the third most deadly and fifth most common cancer worldwide [1, 2]. Chronic infection with hepatitis B virus (HBV), which affects approximately 5% of the global population, or hepatitis C virus (HCV), affecting approximately 2% of the global population, is a risk factor for the development of HCC [3]. There are many patients infected with hepatitis virus in Japan and HCC is the fourth most deadly and sixth most common cancer in Japan according to the vital statics conducted in 2008 [4].
Prior to the year 2000, many HCC occurrences in Japan were associated with HBV or HCV infection. However, the HBV vaccine was introduced into infant immunization schedule in 1986. HBV and HCV screening for blood transfusion was instituted in 1989, leading to a dramatic decrease in new HBV and HCV infections. Meanwhile, a worldwide increase in alcohol use, obesity, and diabetes mellitus have made alcohol-related liver disease (ALD) and nonalcoholic steatohepatitis (NASH) common causes of HCC [5,6]. In Japan, the number of patients with HBV surface antigen (HBsAg)-negative and HCV antibody (HCVAb)-negative HCC (NBNC-HCC) has been rapidly increasing. In Japan in 2000, the NBNC-HCC accounted for 8.7% of all HCC cases and the number increased by 14.9% in 2010 [7]. In our department, the number of patients with the NBNC-HCC undergoing surgery has been increasing and accounted for approximately 71% of HCC surgical cases in 2013. The objective of this study was retrospectively to compare the clinicopathological characteristics, including survival and recurrence following surgery, in patients with the NBNC-HCC, those with HBsAg-positive HCC (B-related HCC) and HCVAb-positive HCC (C-related HCC).
Material and Methods
Patients and study groups
From January 2004 to December 2013, a total of 254 patients consecutively underwent curative hepatic resection or open ablation therapy for HCC in our department. A total of 219 patients were enrolled in this study who had presented for the first time. HCC was diagnosed using abdominal ultrasound, dynamic computed tomography (CT) scans, and magnetic resonance imaging (MRI). Postoperative follow up also utilized imaging studies as well as monitoring of tumor markers, including α-fetoprotein (AFP) and des-γ-carboxy prothrombin (DCP, PIVKA-II) levels. Patients with NBNC-HCC were defined as being negative for both HBsAg and HCVAb, whereas patients with B or C-related HCC were seropositive for HBsAg or HCVAb.
The RFA indication was changing over these 10 years; therefore, the indication for treatment (resection or RFA) of HCC was decided upon through careful discussions with physicians. The indication of surgical RFA was defined by liver function [indocyanine green retention rate at 15 min (ICG-R15) of 30 or more (Makuuchi criteria), tumor location, and tumor factor (≤ 2-3 cm)].
Clinicopathological factors
Clinicopathological factors selected for evaluation in this study included age, body mass index, alcohol consumption, hypertension, diabetes mellitus, Child-Pugh score for liver function, and preoperative laboratory values [ICGR15, serum AFP, DCP (PIVKA-II), platelet count, prothrombin time, serum aspartate aminotransferase (AST), serum alanine aminotransferase (ALT), serum total bilirubin, serum total protein, and serum albumin]. A diagnosis of diabetes mellitus was based on the results of a 75 g oral glucose tolerance test or a random blood glucose measurement >200 mg/dL. Excessive alcohol consumption was defined as an average daily consumption of an amount equivalent to 80 g of pure ethanol over a period of >10 years. Hypertension was defined as systolic pressure >140 mmHg and diastolic pressure >90 mmHg. Hypertension and diabetes mellitus included the patients who were controlled by medication.
Histopathology
Histopathological diagnosis was based on an evaluation of tumor size, the number of tumor nodules, lymph node metastasis, and infiltration to blood vessels (portal vein, hepatic artery and/or vein). HCC staging was by TNM classification adapted from the Union for International Cancer Control (UICC) [8]. The grade of liver fibrosis was determined by the new Inuyama classification [9] and a classification of F4 was definitive of liver cirrhosis. Fatty liver was defined as an observation of more than 30% fat droplets in the harvested liver specimen. The ablation cases were excluded from the pathological findings.
Statistical Analysis
The Fischer exact probability test and chi-square test were used to evaluate categorical variables and the unpaired t-test was used to evaluate continuous variables. Overall survival (OS) was calculated from the date of resection to the date of death regardless of the cause of death. Recurrence free survival (RFS) was calculated from the date of resection to the date when tumor recurrence was diagnosed or from date of the resection to the last visit if recurrence was not diagnosed. The cumulative OS and RFS rates were calculated using the Kaplan-Meier method and tested using the log-rank test. The postoperative course of five patients in the NBNC-HCC and two patients in the B-related HCC and three patients in the C-related HCC groups was unknown and these patients were excluded from OS and RFS analyses. The univariate analysis contributing to OS and RFS was calculated using the Kaplan-Meier method and tested using the log-rank test. The Cox proportional hazards model was used for multivariate analyses of factors considered significant in univariate analyses or close to it (P<0.1). Data are presented as the means ± standard deviation. A p value <0.05 was considered significant. Statistical analyses were performed using the SPSS statistical software package (version 21; SPSS Inc., Chicago)
Results
Baseline characteristics
Baseline characteristics of the NBNC-HCC group, the B- and C-related HCC group are shown in Table 1. The mean age was 68.6 ± 9.0. The NBNC-HCC was diagnosed in 80 patients (36.5%) and 35 patients (16.0%) had the B-related HCC and 104 (47.5%) patients had the C-related HCC. Hepatic resections were performed for 167 patients and ablation therapies, including radiofrequency ablation and microwave coagulation therapy, were performed for 52 patients with poor liver function. Open laparotomy was undertaken in 128 patients (95 patients underwent anatomical resection and 33 patients underwent limited resection), and laparoscopic resection was conducted in 39 patients (10 patients underwent anatomical resection and 29 patients underwent limited resection). Open or laparoscopic ablation (surgical ablation) was performed in 52 patients.
Patients characteristics.
| Baseline Characteristics | |
|---|---|
| N | 219 |
| Age (years) | 68.6±9.0 |
| Gender, male : female | 163:56 |
| NBNC: HBV: HCV | 80:35:104 |
| Body mass index | 24.18±3.52 |
| Tumor diameter (cm) | 4.20±3.42 |
| No. of tumors | 1.61±1.35 |
| Resection : surgical ablation | 167 : 52 |
| Open laparotomy 128 | anatomical resection 95 |
| limited resection 33 | |
| Laparoscopic resection 39 | anatomical resection 10 |
| limited resection 29 |
Data are presented as number and median ± standard deviation
Clinicopathological characteristics between NBNC-, B-related and C-related HCC groups
The clinicopathological characteristics of the patients in the three groups are shown in Table 2. Compared with the B-related HCC group, patients in the NBNC-related HCC group were much older (p < 0.001), had a higher incidence of diabetes mellitus (p = 0.032), a higher body mass index (p = 0.011), and a higher incidence of hypertension (p = 0.035). The NBNC-related HCC group had a higher prothrombin time (p = 0.018). On the other hand, compared with the C-related HCC group, patients in the NBNC-related HCC group had higher body mass indices (p = 0.007), higher alcohol consumption (p = 0.007), and higher Child-Pugh score (p = 0.016). The NBNC-related HCC group had higher platelet counts (p < 0.001), higher total protein (p < 0.001), higher prothrombin time (p < 0.001), lower AST (p < 0.001), lower ALT (p < 0.001), lower albumin (p = 0.010), and a lower ICG-R15 (p = 0.008). These results are indicative of a better liver function in the NBNC-related HCC group compared with those in the C-related HCC group.
Clinico-pathological characteristics between three groups
| variable | NBNC-HCC | HBV-HCC | HCV-HCC | p (vs HBV) | p (vs HCV) |
|---|---|---|---|---|---|
| Age | 70.44±8.77 | 61.89±10.54 | 69.20±7.52 | < 0.001a | 0.234a |
| Sex Man / Woman | 62(77.5%) / 18(22.5%) | 29(82.8%) / 6(17.2%) | 72(69.2%) / 32(30.8%) | 0.510b | 0.209b |
| Diabetes mellitus Yes / No | 32(40%) / 48(60%) | 7(20.0%) / 28(80.0%) | 30(28.8%) / 74(71.2%) | 0.032b | 0.113b |
| Body mass index | 25.15±3.61 | 23.36±2.92 | 23.71±3.51 | 0.011b | 0.007a |
| Alcohol consumption Yes / No | 30(37.5%) / 50(62.5%) | 12(34.3%) / 23(65.7%) | 24(23.1%) / 80(76.9%) | 0.741b | 0.034b |
| Hypertension Yes / No | 26(32.5%) / 54(67.5%) | 5(14.3%) / 30(85.7%) | 27(26.0%) / 77(74.0%) | 0.035b | 0.333b |
| Child-Pugh A / B, C | 69(86.2%) / 11(13.8%) | 32 (91.4%)/ 3(8.6%) | 72 (69.2%)/ 32(30.8%) | 0.421b | 0.016b |
| ICGR15, % | 15.75±9.11 | 14.87±8.56 | 21.30±11.40 | 0.628a | < 0.001a |
| AFP, ng/ml | 3519±12623 | 1679±450 | 1930±10214 | 0.404a | 0.349a |
| PIVKA II, mAU/ml | 4779±12792 | 9928±18879 | 3197±9681 | 0.091a | 0.341a |
| platelet, 104/μl | 17.31±6.57 | 15.75±7.25 | 13.25±6.25 | 0.250a | < 0.001a |
| Prothrombin time, % | 93.96±10.89 | 88.74±10.23 | 86.13±16.33 | 0.018a | < 0.001a |
| AST, IU/l | 40.97±20.77 | 38.26±21.76 | 53.09±21.57 | 0.528a | < 0.001a |
| ALT, IU/l | 37.54±21.54 | 34.26±18.32 | 50.73±28.84 | 0.434a | < 0.001a |
| T-Bil, mg/dl | 0.855±0.371 | 0.829±0.327 | 0.855±0.371 | 0.717a | 0.236a |
| Total protein, g/dl | 7.073±0.599 | 7.103±0.613 | 7.400±0.694 | 0.809a | < 0.001a |
| albumin, g/dl | 3.938±0.425 | 3.994±0.365 | 3.748±0.538 | 0.494a | 0.010a |
| Tumor size, cm | 5.69±4.17 | 4.27±3.32 | 3.03±2.14 | 0.079a | < 0.001a |
| Tumor numbers | 1.50±0.99 | 1.83±1.65 | 1.63±1.47 | 0.190a | 0.514a |
| Tumor stage I, II / III, IV | 37(46.3%)/43(53.7%) | 21(60.0%) / 14(40.0%) | 75(72.1%)/ 29(27.9%) | 0.173b | < 0.001b |
| Metastasis Yes / No | 5(6.3%) / 75(93.7%) | 2(5.7%) / 33(94.3%) | 7(6.7%) / 97(93.3%) | 0.684b | 0.753b |
| Pathological parameter | |||||
| Infiltraion to blood vessel Yes / No | 35(51.5%) / 33(48.5%) | 10(35.7%) / 18(64.3%) | 22(31.0%) / 49(69.0%) | 0.157b | 0.014b |
| Fibrosis 1, 2 / 3, 4 | 59(86.8%) / 9(13.2%) | 16(57.1%) / 12(42.9%) | 40(56.3%) / 31(43.7%) | < 0.001b | < 0.001b |
| Fatty liver Yes / No | 12(17.7%) / 56(82.3%) | 4 (14.3%) / 24(85.7%) | 4 (5.6%) / 67(94.4%) | 0.684b | 0.024b |
| Differentiation High / moderately / low | 11(16.2%) / 47(69.1%) / 10(14.7%) | 5(17.9%) / 21(75%) / 2(7.1%) | 16(22.5%) / 50(70.4%) / 5(7.1%) | 0.540b | 0.624b |
Data are presented as number, percent and median ± standard deviation, a; unpaired t-test, b; Fisher exact probability test
Average tumor size in the NBNC-related HCC group was larger (p < 0.001) than that in the C-related HCC group; however, tumor numbers did not differ between the three groups. UICC stage was more advanced in the NBNC-related HCC group (p < 0.001) compared with that in the C-related HCC group. Average values of serum tumor markers (AFP and DCP) did not differ between the three groups.
The pathological findings indicated that the liver fibrous stage was more advanced in the B- and C-related HCC groups (p < 0.001) compared with that in the NBNC-related HCC group. However, fatty liver with more than 30% fat droplets, was observed more frequently in the NBNC-related HCC group (p = 0.024) compared with that in the C-related HCC group. In terms of HCC itself, venous invasion was frequently observed in the NBNC-related HCC group (p = 0.014) compared with that in the C-related HCC group. The tumor differentiation and the metastasis status among the groups did not exhibit significant differences.
OS and RFS in three groups
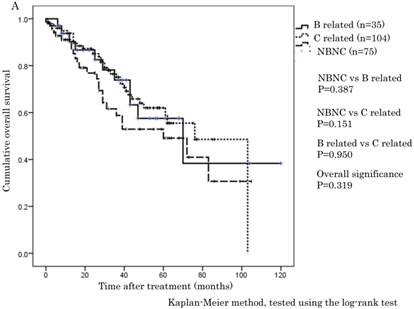
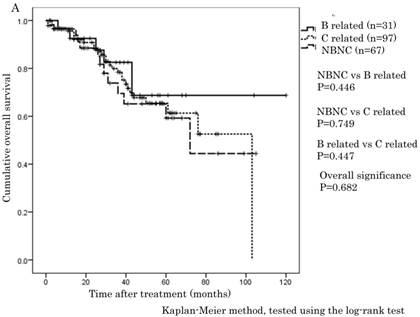
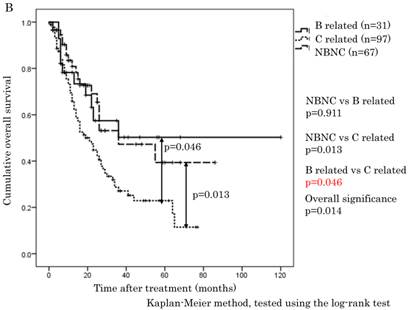
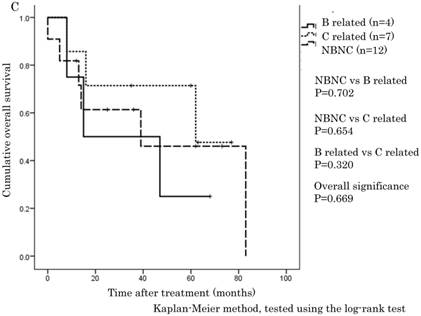
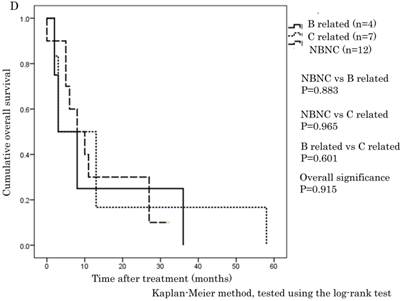
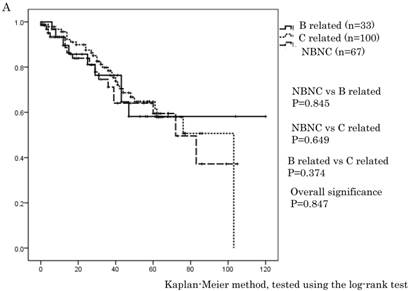
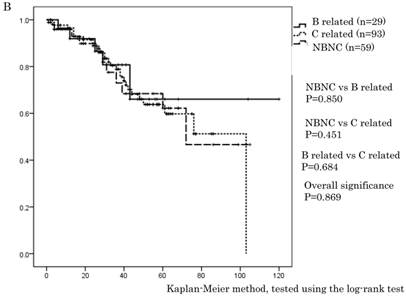
The cumulative 1-, 3-, and 5-year OS rates were 94.1%, 68.9%, and 57.6% in the NBNC-HCC group, 90.3%, 73.8%, and 57.5% in the B-related HCC group and 93.8%, 75.1%, and 62.0% in the C-related HCC group, respectively. RFS rates were 70.6%, 38.4%, and 32% in the NBNC-HCC group, 71.2%, 53.5%, and 41.6% in the B-related HCC group and 68.3%, 26.5%, and 19.5% in the C-related HCC group respectively. There were no differences in OS and RFS between the three groups (Figure 1A, B). Moreover, we evaluated the prognosis of patients within UICC classification stage I and II. The cumulative 1-, 3-, and 5-year OS rates were 96.5%, 69.5%, and 59.3% in the NBNC-HCC group, 92.5%, 82.5%, and 68.8% in the B-related HCC group and 95.6%, 78.4%, and 61.3% in the C-related HCC group respectively. RFS rates were 80.9%, 47.2%, and 39.4% in the NBNC-HCC group, 78.2%, 50.3%, and 50.3% in the B-related HCC group and 69.5%, 27.1%, and 22.9% in the C-related HCC group, respectively. The patients with the NBNC-HCC and the B-related HCC showed a better RFS compared with the patients with the C-related HCC (p=0.013, p = 0.046, Figure 2B); however, there was no difference in OS (Figure 2A). Furthermore, subgroup analysis of stage III and IV revealed no differences in either RFS or OS between three groups. (Figure 2C, D).
A. Overall survival in the NBNC-, B- and C-related HCC groups. There were no differences in overall survival between the three groups. B. Recurrent free survival in the NBNC-, B- and C-related HCC groups. There were no differences in recurrent free survival between the three groups.
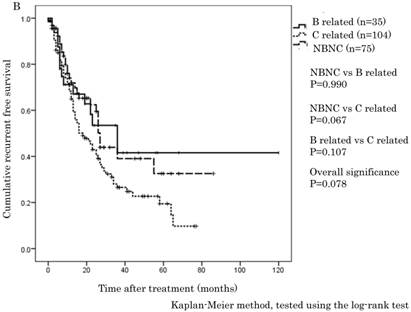
A. Overall survival in the NBNC-, B- and C-related HCC groups in UICC stage I and II. There were no differences in overall survival between the three groups. B. Recurrent free survival in the NBNC- and the BC-related HCC groups in UICC stage I and II. The patients with the NBNC-HCC and the B-related HCC showed a better recurrent free survival compared with the patients with the C-related HCC. C. Overall survival in the NBNC-, the B- and C-related HCC groups in UICC stage III and IV. They revealed no differences in overall survival between three groups. D. Recurrent free survival in the NBNC-, B- and C-related HCC groups in UICC stage III and IV. They revealed no differences in recurrent free survival between three groups.
Comparison of cause of death between three groups
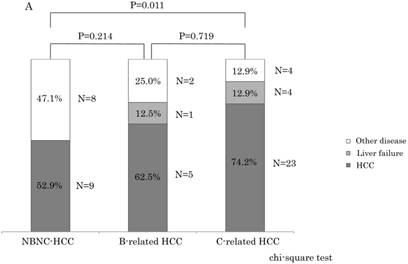
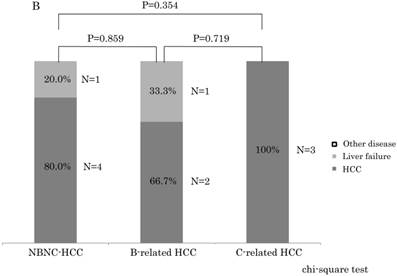
Within stage I and II, the NBNC-HCC group showed less mortality due to HCC (NBNC: 52.9%, B-related: 62.5%, C-related: 74.2%) and liver failure (NBNC: 0%, B-related: 12.5%, C-related: 12.9%) as shown in Figure 3A. On the contrary, the NBNC-HCC group showed clearly higher mortality caused by other diseases (NBNC; 47.1%, B-related; 25.0%, C-related; 12.9%, NBNC vs C-related, p = 0.011). The causes of death in the NBNC-HCC group included cerebral hemorrhage, gum cancer, two bile duct cancers, and an infection (Fournier gangrene) and so on. Within stage III and IV, there were no significant differences in the mortality between the three groups, and the cause of death was mostly related to HCC recurrence in all of the three groups because of advanced cancer.
A. The causes of death compared to the NBNC-, B- and C-related HCC groups in UICC stage I and II. The NBNC-HCC group had less mortality caused by HCC and/or liver failure. However, the patients with the NBNC-HCC showed high mortality caused by other diseases. B. The causes of death compared to NBNC-, B- and C-related HCC groups in UICC Stage III and IV. Many patients were dead of HCC recurrence because of advanced cancer.
Liver specific OS between three groups
Because the NBNC-related HCC group clearly showed a lower mortality due to liver-related disease, we analyzed liver-specific OS between the three groups in all stages and in stage I and II (Figure 4A and 4B). However, no significant differences were noted between three groups.
A. Liver specific overall survival between the NBNC-, B- and C-related HCC groups in all stages. There were no significant differences between the groups. B. Liver specific overall survival between NBNC-, B- and C-related HCC groups in UICC stage I and II. There were no significant differences between the groups.
Univariate and multivariate analysis of prognostic factors for OS and RFS between three groups
To clarify prognostic factors for OS and RFS after surgery, we performed univariate and multivariate analyses. In the NBNC-related HCC group, only tumor number (≥ 2) contributed to poor OS by univariate analysis (Table 3A), and no significant factor was identified by multivariate analysis (Table 4A). Only high serum total bilirubin was linked to poor RFS in both univariate and multivariate analysis (Table 3A, 4A).
Univariate analysis of overall survival and recurrent free survival in NBNC-HCC patients in all stage
| variable | number | OS p | RFS p |
|---|---|---|---|
| Age ≥ 70years Yes / No | 44 / 31 | 0.213 | 0.524 |
| Sex Man / Woman | 58 / 17 | 0.749 | 0.682 |
| Diabetes mellitus Yes / No | 31 / 44 | 0.866 | 0.742 |
| Body mass index ≥ 25kg/m2 Yes / No | 32 / 43 | 0.529 | 0.358 |
| Alcohol consumption Yes / No | 27 / 48 | 0.449 | 0.707 |
| Hypertension Yes / No | 24 / 51 | 0.107 | 0.607 |
| Child-Pugh A / B, C | 65 / 10 | 0.458 | 0.730 |
| ICGR15 ≥ 15% Yes / No | 34 / 41 | 0.330 | 0.482 |
| AFP ≥ 10 ng/ml Yes / No | 44 / 31 | 0.227 | 0.178 |
| PIVKA II ≥ 40 mAU/ml Yes / No | 49 / 25 | 0.243 | 0.610 |
| platelet ≥ 13 x 104/μl Yes / No | 59 / 16 | 0.411 | 0.203 |
| Prothrombin time ≥ 80% Yes / No | 59 / 16 | 0.810 | 0.317 |
| AST ≥ 32 IU/l Yes / No | 43 / 32 | 0.754 | 0.595 |
| ALT ≥ 37 IU/l Yes / No | 31 / 44 | 0.962 | 0.767 |
| T-Bil ≥ 1.2 mg/dl Yes / No | 12 / 63 | 0.716 | 0.006 |
| Total protein ≥ 6.0 g/dl Yes / No | 68 / 7 | 0.540 | 0.307 |
| Albmin ≥ 4.0 g/dl Yes / No | 54 / 21 | 0.836 | 0.169 |
| Tumor size ≥ 5.7cm Yes / No | 26 / 49 | 0.180 | 0.297 |
| Tumor numbers ≥ 2 Yes / No | 21 / 54 | 0.043 | 0.948 |
| Tumor stage I, II / III, IV | 39 / 36 | 0.443 | 0.088 |
| Infiltraion to blood vessel Yes / No | 32 / 31 | 0.605 | 0.141 |
| Fibrosis I, II / III, IV | 53 /10 | 0.389 | 0.908 |
| Fatty liver Yes / No | 11 / 52 | 0.682 | 0.195 |
The univariate analysis contributing to OS and RFS was calculated using the Kaplan-Meier method, and tested using the log-rank test. Cut off values of age and tumor diameter were set in each average values. Normal values in our hospital were set in each cut off values.
Multivariate analysis of overall survival and recurrent free survival in NBNC-HCC group in all stage
| variable | OS HR | 95% CI | P value | RFS HR | 95% CI | P value |
|---|---|---|---|---|---|---|
| Tumor number ≥ 2 Hypertension | 3.739 0.710 | 0.894-15.640 0.403-1.252 | 0.071 0.237 | |||
| T-Bil ≥ 1.2 mg/dl | 1.977 | 1.188-3.288 | 0.009 | |||
| Stage III / IV | 1.332 | 0.521-3.404 | 0.550 |
The multivariate analysis using the Cox proportional hazards model.
Normal values in our hospital were set in each cut off values.
Next, univariate and multivariate analysis were performed in the B-related and the C-related HCC to compare with the NBNC-related HCC group. In the B-related HCC, PIVKA II ( ≥ 40), serum total bilirubin ≥ 1.2 mg/dL, a tumor number ≥ 2, and a tumor stage of III and IV contributed to poor OS by univariate analysis (Table 3B); however, no significant factor was identified by multivariate analysis (Table 4B). AST ≥ 32 IU/l, ALT ≥ 37 IU/l, a tumor number ≥ 2, a tumor stage of III and IV, and infiltration into blood vessels contributed to poor RFS by univariate analysis (Table 3B). Only infiltration into blood vessels was identified as a significant factor by multivariate analysis (Table 4B). In the C-related HCC, PIVKA II ( ≥ 40) and tumor stage III and IV contributed to poor OS by univariate analysis (Table 3C) with only PIVKA II (≥ 40) being a significant factor by multivariate analysis (Table 4C). The male gender, PIVKA II (≥ 40), tumor stage III and IV, and infiltration into blood vessels contributed to poor RFS by univariate analysis (Table 3C), whereas no significant factor was identified by multivariate analysis (Table 4C).
Univariate analysis of overall survival and recurrent free survival in B related-HCC patients in all stage
| variable | number | OS p | RFS p |
|---|---|---|---|
| Age ≥ 62 years Yes / No | 16 / 17 | 0.584 | 0.658 |
| Sex Man / Woman | 28 / 5 | 0.733 | 0.869 |
| Diabetes mellitus Yes / No | 6 / 27 | 0.704 | 0.948 |
| Body mass index ≥ 25kg/m2 Yes / No | 11 / 22 | 0.641 | 0.794 |
| Alcohol consumption Yes / No | 11 / 22 | 0.686 | 0.523 |
| Hypertension Yes / No | 4 / 29 | 0.382 | 0.685 |
| Child-Pugh A / B, C | 3 / 30 | 0.785 | 0.730 |
| ICGR15 ≥ 15% Yes / No | 11 / 22 | 0.810 | 0.454 |
| AFP ≥ 10 ng/ml Yes / No | 16 / 17 | 0.540 | 0.674 |
| PIVKA II ≥ 40 mAU/ml Yes / No | 20 / 13 | 0.027 | 0.146 |
| platelet ≥ 13 x 104/μl Yes / No | 22 / 11 | 0.485 | 0.431 |
| Prothrombin time ≥ 80% Yes / No | 27 / 6 | 0.942 | 0.654 |
| AST ≥ 32 IU/l Yes / No | 17 / 16 | 0.369 | 0.003 |
| ALT ≥ 37 IU/l Yes / No | 13 / 20 | 0.958 | 0.011 |
| T-Bil ≥ 1.2 mg/dl Yes / No | 7 / 26 | 0.027 | 0.321 |
| Total protein ≥ 6.0 g/dl Yes / No | 32 / 1 | 0.798 | 0.561 |
| albmin ≥ 4.0 g/dl Yes / No | 18 / 15 | 0.408 | 0.792 |
| Tumor size ≥ 4.3cm Yes / No | 9 / 24 | 0.461 | 0.686 |
| Tumor numbers ≥ 2 Yes / No | 12 / 21 | <0.001 | 0.004 |
| Tumor stage I, II / III, IV | 12 / 21 | 0.001 | 0.015 |
| Infiltraion to blood vessel Yes / No | 10 / 17 | 0.455 | 0.006 |
| Fibrosis I, II / III, IV | 11 /15 | 0.292 | 0.146 |
| Fatty liver Yes / No | 5 / 21 | 0.429 | 0.765 |
The univariate analysis contributing to OS and RFS was calculated using the Kaplan-Meier method, and tested using the log-rank test. Cut off values of age and tumor diameter were set in each average values. Normal values in our hospital were set in each cut off values.
Multivariate analysis of overall survival and recurrent free survival in B-HCC group in all stage
| variable | OS HR | 95% CI | P value | RFS HR | 95% CI | P value |
|---|---|---|---|---|---|---|
| PIVKA II ≥ 40 mAU/ml T-Bil ≥ 1.2 mg/dl | 3.266 3.007 | 0.146-72.889 0.617-14.663 | 0.455 0.173 | |||
| Tumor numbers ≥ 2 | 0.288 | 0.028-3.005 | 0.298 | 0.302 | 0.040-2.261 | 0.243 |
| Stage III / IV | 0.671 | 0.150-3.006 | 0.602 | 1.112 | 0.415-2.983 | 0.833 |
| AST ≥ 32 IU/l | 1.649 | 0.239-11.377 | 0.612 | |||
| ALT ≥ 37 IU/l | 1.877 | 0.295-11.918 | 0.505 | |||
| Infiltraion to blood vessel | 4.613 | 1.137-18.721 | 0.032 |
The multivariate analysis using the Cox proportional hazards model.
Normal values in our hospital were set in each cut off values.
Univariate analysis of overall survival and recurrent free survival in C related-HCC patients in all stage
| variable | number | OS p | RFS p |
|---|---|---|---|
| Age ≥ 69 years Yes / No | 59 / 40 | 0.877 | 0.868 |
| Sex Man / Woman | 70 / 29 | 0.445 | 0.040 |
| Diabetes mellitus Yes / No | 28 / 71 | 0.912 | 0.840 |
| Body mass index ≥ 25kg/m2 Yes / No | 37 / 62 | 0.433 | 0.377 |
| Alcohol consumption Yes / No | 23 / 76 | 0.068 | 0.087 |
| Hypertension Yes / No | 26 / 73 | 0.274 | 0.756 |
| Child-Pugh A / B, C | 70 / 29 | 0.458 | 0.575 |
| ICGR15 ≥ 15% Yes / No | 66 / 33 | 0.482 | 0.809 |
| AFP ≥ 10 ng/ml Yes / No | 74 / 25 | 0.168 | 0.616 |
| PIVKA II ≥ 40 mAU/ml Yes / No | 57 / 42 | 0.003 | 0.012 |
| platelet ≥ 13 x 104/μl Yes / No | 41 / 58 | 0.889 | 0.207 |
| Prothrombin time ≥ 80% Yes / No | 74 / 25 | 0.605 | 0.139 |
| AST ≥ 32 IU/l Yes / No | 18 / 81 | 0.680 | 0.134 |
| ALT ≥ 37 IU/l Yes / No | 61 / 38 | 0.246 | 0.085 |
| T-Bil ≥1.2 mg/dl Yes / No | 19 / 80 | 0.485 | 0.171 |
| Total protein ≥ 6.0 g/dl Yes / No | 96 / 3 | 0.742 | 0.500 |
| albmin ≥ 4.0 g/dl Yes / No | 38 / 61 | 0.438 | 0.171 |
| Tumor size ≥ 3.0cm Yes / No | 38 / 61 | 0.406 | 0.056 |
| Tumor numbers ≥ 2 Yes / No | 31 / 68 | 0.305 | 0.080 |
| Tumor stage I, II / III, IV | 28 / 71 | 0.039 | 0.004 |
| Infiltraion to blood vessel Yes / No | 22 / 46 | 0.131 | <0.001 |
| Fibrosis I, II / III, IV | 31 /36 | 0.225 | 0.730 |
| Fatty liver Yes / No | 7 / 62 | 0.396 | 0.335 |
The univariate analysis contributing to OS and RFS was calculated using the Kaplan-Meier method, and tested using the log-rank test. Cut off values of age and tumor diameter were set in each average values. Normal values in our hospital were set in each cut off values.
Multivariate analysis of overall survival and recurrent free survival in C-HCC group in all stage
| variable | OS HR | 95% CI | P value | RFS HR | 95% CI | P value |
|---|---|---|---|---|---|---|
| PIVKA II ≥ 40 mAU/ml Alcohol consumption | 2.577 1.795 | 1.122-5.918 0.876-3.679 | 0.026 0.110 | 1.191 1.027 | 0.531-2.673 0.726-1.455 | 0.671 0.879 |
| Stage III / IV | 0.782 | 0.544-1.123 | 0.183 | 0.862 | 0.516-1.439 | 0.570 |
| Sex Man | 1.881 | 0.683-5.175 | 0.221 | |||
| ALT ≥ 37 IU/l | 0.724 | 0.365-1.438 | 0.357 | |||
| Tumor numbers ≥ 2 | 1.058 | 0.436-2.565 | 0.901 | |||
| Tumor size ≥ 3.0cm | 1.078 | 0.741-1.568 | 0.694 | |||
| Infiltraion to blood vessel | 2.525 | 0.968-6.581 | 0.058 |
The multivariate analysis using the Cox proportional hazards model.
Normal values in our hospital were set in each cut off values.
Discussion
Recently, patients with the NBNC-HCC have been increasing in Japan and the proportion of patients with the NBNC-HCC undergoing surgical treatment was 71% in our department in 2013. This elevation can be due to many reasons, increased obesity as well as, diabetes mellitus, and fatty liver. In the USA, 20%-50% of patients with HCC had idiopathic disease [10] and recent studies have suggested that diabetes and/or nonalcoholic fatty liver disease (NAFLD) could account for at least a portion of these cases. Regardless, there is a paucity of detailed clinical study after surgery.
In our study, 40.0% of patients with the NBNC-HCC, 20.0% of patients with the B-related HCC and 28.8% of patients with the C-related HCC were complicated by diabetes mellitus and there was a significant difference between the NBNC-HCC and the B-related HCC (p = 0.032). El-Serag et al. reported that diabetes doubled the risk of both chronic nonalcoholic liver disease and HCC in a cohort study [11]. The number of patients with the NBNC-HCC in Japan is expected to increase in the future coincidentally with the increase in the number of patients with diabetes mellitus.
Approximately 3%-5% of patients with NAFLD develop nonalcholic steatohepatitis (NASH), which may progress to end-stage liver disease or HCC [12, 13]. According to molecular studies, PNPLA3 was identified as an important genetic variant associated with a higher prevalence of NAFLD [14] and indicated a strong association with NASH [15]. In Western countries, NAFLD is estimated to have a prevalence of 20%-30%. [16] Our examination showed a prevalence of 17.7% in the NBNC-HCC by pathological analysis.
The World Health Organization (WHO) has defined obesity as a body mass index of >30 kg/m2 [17, 18]. In Japan, the proportion of people with a body mass index of >30 kg/m2 has been reported to be only 2%-3%, in contrast to the 20%-30% prevalence rate in western countries [19, 20]. In our study, 11% of the patients in the NBNC-HCC group, 2.9% of the patients in the B-related HCC group and 2.9% of the patients in the C-related HCC group had a body mass index of >30 kg/m2, and the ratio of high body mass index in the NBNC group was higher than the average in the Japanese population. Ascha et al. reported that the mean body mass index of adult patients referred to the liver transplant clinic with liver cirrhosis secondary to chronic HCV infection or NASH was 34.6 kg/m2 for patients with NASH and 28.3 kg/m2 for patient with HCV [20]. These numbers are much higher than we found, which were 25.15 ± 3.61 kg/m2 for the NBNC-HCC group, 23.36 ± 2.92 kg/m2 for the B-related HCC group and 23.71 ± 3.51 kg/m2 for the C-related HCC group. Although we could not evaluate burn-out NASH, the patients with the NBNC-HCC complicated with NASH represented fewer than 10% in our preliminary historical examination. Our findings indicate that the increase in patients with the NBNC-HCC in Japan may be attributed not only to NASH and NAFLD but also to other metabolic etiologies. In general, the hepatitis virus promotes liver fibrosis and cirrhosis contributing to worse liver function and carcinogenesis. The liver function and the grading of liver fibrosis were better in the NBNC-HCC group than in the B- and C-related HCC group in this series. These data may indicate the sequence of NASH---liver fibrosis---HCC does not necessarily apply in the NBNC-HCC.
Because of the regular follow-up for most patients with viral hepatitis in Japan, the B- and C-related HCC is supposed to be detected earlier and at an earlier stage compared with the NBNC-HCC. However, patients with the NBNC-HCC do not usually undergo imaging studies if there are no tumor symptoms. For this reason, patients with the NBNC-HCC seem to have considerably larger tumors and more advanced staging compared with patients with the B- and C-related HCC.
In this series, OS and RFS in whole HCC stage were not different between three groups, which are similar to previous reports [21, 22]. However, only for stage I and II (i.e., early stage of HCC), the NBNC-HCC group showed a clearly better RFS (p = 0.013) compared to C-related HCC. For stage III and IV (i.e., advanced tumor stage), there were no differences in OS and RFS. Radical cure after surgery is expected in stage I and II. Thus, it is believed that the degree of liver tissue disorder is rather associated with secondary new growth of HCC and with the elevation of HCC recurrences. It may be natural that there are few recurrences in the NBNC-HCC group because of the preserved liver function.
To elucidate why there was no difference in OS between three groups in stage I and II, despite better RFS in the NBNC-HCC group, we compared the cause of the death. The NBNC-HCC group had less mortality caused by HCC (NBNC: 52.9%, B-related: 62.5%, C-related: 74.2%) and/or liver failure (NBNC: 0%, B-related: 12.5%, C-related: 12.9%). However, the patients with the NBNC-HCC showed high mortality caused by other diseases (NBNC: 47.1%, B-related: 25.0%, C-related: 12.9%). Mortality due to other cancers and critical diseases, such as a cerebral hemorrhage and an infection, was high in the NBNC-HCC group. In a large cohort study regarding the cause of death in Japanese diabetics [23], the most common cause was cancer. Patients with diabetes mellitus had a higher mortality rate caused by cancers compared with the mortality rate in non-diabetic patients, and HCC was the leading cause of death from cancer in patients with diabetes mellitus. A high prevalence of diabetes in the NBNC-HCC group is a likely indication of an increased incidence of other cancers after HCC treatment. We also analyzed liver-specific OS in three groups, but there were no significant differences between the groups.
In the NBNC-HCC group, a tumor number ≥ 2 was predictive of poor OS, and high serum total bilirubin was predictive of poor RFS by univariate analysis. By multivariate analysis, only high serum total bilirubin contributed to poor RFS. Carr et al. reported that elevated serum bilirubin levels were associated with higher AFP levels, increased incidence of portal vein thrombosis, and lower survival despite similar tumor sizes [24]. Moreover, Kinoshita et al. reported on elevated Glasgow Prognostic Score being related to poor prognosis in patients with HCC and associated with increased serum total bilirubin and other clinicopathological variables [25]. High serum total bilirubin may reflect carcinogenesis following deteriorating liver function in these patients.
In this study, the selection bias may also be one of the reasons for the rise in the proportion of patients with the NBNC-related HCC because our database consisted of patients who underwent surgical treatment and maintained good liver function. Moreover, a limitation to our study was the fact that it was a retrospective study.
Our findings indicate that, in patients with the NBNC-HCC, elevated serum total bilirubin is a prognostic factor to detect poor RFS after surgery. Furthermore, these patients must be followed-up carefully not only for HCC recurrence but also for the occurrence of other critical illness including other cancers. Further molecular and pathological studies are needed to identify the cause of the NBNC-HCC and to improve prognosis.
Competing Interests
The authors have declared that no competing interest exists.
References
1. El-Serag HB, Mason AC. Rising incidence of hepatocellular carcinoma in the United States. N Engl J Med. 1999;340:745-50
2. Bosch FX, Ribes J, Borras J. Epidemiology of primary liver cancer. Semin Liver Dis. 1999;19:271-85
3. El-Serag HB. Epidemiology of viral hepatitis and hepatocellular carcinoma. Gastroenterology. 2012;142:1264-73
4. Japan Ministry of Health, Labor, Welfare. Japan Ministry of Health, Labor and Welfare carried out in 2008.2008.
5. Starley BQ, Calcagno CJ, Harrison SA. Nonalcoholic fatty liver disease and hepatocellular carcinoma: a weighty connection. Hepatology. 2010;51:1820-32
6. N'Kontchou G, Paries J, Htar MT. et al. Risk factors for hepatocellular carcinoma in patients with alcoholic or viral C cirrhosis. Clin Gastroenterol Hepatol. 2006;4:1062-8
7. Ikai I, Kudo M, Arii S. et al. Report of the 18th follow-up survey of primary liver cancer in Japan. Hepatol Res. 2010;40:1043-59
8. Leslie HS, Gospodarowicz MK, Wittekind C. TNM Classification of Malignant Tumours, 7th Edition Union for International Cancer Control. Wiley-Blackwell. 2009
9. Matsumoto K, Yoshimoto J, Sugo H. et al. Relationship between the histological degrees of hepatitis and the postoperative recurrence of hepatocellular carcinoma in patients with hepatitis C. Hepatol Res. 2002;23:196-201
10. Davila JA, Morgan RO, Shaib Y. et al. Diabetes increases the risk of hepatocellular carcinoma in the United States: a population based case control study. Gut. 2005;54:533-9
11. El-Serag HB, Tran T, Everhart JE. Diabetes increases the risk of chronic liver disease and hepatocellular carcinoma. Gastroenterology. 2004;126:460-8
12. Conlon BA, Beasley JM, Aebersold K. et al. Nutritional management of insulin resistance in nonalcoholic fatty liver disease (NAFLD). Nutrients. 2013;5:4093-114
13. Vernon G, Baranova A, Younossi ZM. Systematic review: the epidemiology and natural history of non-alcoholic fatty liver disease and non-alcoholic steatohepatitis in adults. Aliment Pharmacol Ther. 2011;34:274-85
14. Romeo S, Kozlitina J, Xing C. et al. Genetic variation in PNPLA3 confers susceptibility to nonalcoholic fatty liver disease. Nat Genet. 2008;40:1461-5
15. Sookoian S, Pirola CJ. Meta-analysis of the influence of I148M variant of patatin-like phospholipase domain containing 3 gene (PNPLA3) on the susceptibility and histological severity of nonalcoholic fatty liver disease. Hepatology. 2011;53:1883-94
16. Bellentani S, Scaglioni F, Marino F. et al. Epidemiology of non-alcoholic fatty liver disease. Dig Dis. 2010;28:155-61
17. Obesity. preventing and managing the global epidemic. Report of a WHO consultation. World Health Organ Tech Rep Ser. 2000;894:1-253
18. Nishikawa H, Osaki Y, Takeda H. et al. Effect of body mass index on survival after curative therapy for non-B non-C hepatocellular carcinoma. J Gastrointestin Liver Dis. 2013;22:173-81
19. McCurry J. Japan battles with obesity. Lancet. 2007;369:451-2
20. Ascha MS, Hanouneh IA, Lopez R. et al. The incidence and risk factors of hepatocellular carcinoma in patients with nonalcoholic steatohepatitis. Hepatology. 2010;51:1972-8
21. Nishikawa H, Arimoto A, Wakasa T. et al. Comparison of clinical characteristics and survival after surgery in patients with non-B and non-C hepatocellular carcinoma and hepatitis virus-related hepatocellular carcinoma. J Cancer. 2013;4:502-13
22. Li T, Qin LX, Gong X. et al. Hepatitis B virus surface antigen-negative and hepatitis C virus antibody-negative hepatocellular carcinoma: clinical characteristics, outcome, and risk factors for early and late intrahepatic recurrence after resection. Cancer. 2013;119:126-35
23. Hotta N, Nakamura J, Iwamoto Y. et al. Causes of death in Japanese diabetics: A questionnaire survey of 18,385 diabetics over a 10-year period. J Diabetes Investig. 2010;1(1-2):66-76
24. Carr Bl, Guerra V, Giannini EG. et al. Association of abnormal plasma bilirubin with aggressive hepatocellular carcinoma phenotype. Semin Oncol. 2014;41(2):252-8
25. Kinoshita A, Onoda H, Imai N. et al. The Glasgow Prognostic Score, an inflammation based prognostic score, predicts survival in patients with hepatocellular carcinoma. BMC Cancer. 2013;13:52
Author contact
![]() Corresponding author: Kiyokazu Hiwatashi, MD, PhD, Department of Digestive Surgery, Breast and Thyroid Surgery Graduate School of Medical and Dental Sciences Kagoshima University, Sakuragaoka 8-35-1 Kagoshima, 890-8520, Japan. E-mail address: khiwakufm.kagoshima-u.ac.jp; Tel: +81-99-275-5361; Fax: +81-99-265-7426
Corresponding author: Kiyokazu Hiwatashi, MD, PhD, Department of Digestive Surgery, Breast and Thyroid Surgery Graduate School of Medical and Dental Sciences Kagoshima University, Sakuragaoka 8-35-1 Kagoshima, 890-8520, Japan. E-mail address: khiwakufm.kagoshima-u.ac.jp; Tel: +81-99-275-5361; Fax: +81-99-265-7426