Impact Factor ISSN: 1837-9664

 Global reach, higher impact
J Cancer 2015; 6(10):930-937. doi:10.7150/jca.12284 This issue Cite
Research Paper
Transcriptomic and Functional Pathway Analysis of Human Cervical Carcinoma Cancer Cells Response to Microtubule Inhibitor
Jin Wang1,2, ![]() , Bin Yan3, Song-Mei Liu4, Huanhuan Sun5, Yonglong Pan3, Daogang Guan6, Xiaoyan Zhang1, Jianqing Xu1, Haiqing Ma5,
, Bin Yan3, Song-Mei Liu4, Huanhuan Sun5, Yonglong Pan3, Daogang Guan6, Xiaoyan Zhang1, Jianqing Xu1, Haiqing Ma5, ![]()
1. Scientific Research Center, Shanghai Public Health Clinical Center, 2901 Caolang Road, Jinshan District, Shanghai 201508, China
2. Department of Translational Molecular Pathology, The University of Texas, M.D. Anderson Cancer Center, Houston, TX 77030, USA
3. Laboratory for Food Safety and Environmental Technology, Institutes of Biomedicine and Biotechnology, Shenzhen Institutes of Advanced Technology, Chinese Academy of Sciences, Shenzhen 518055, China
4. Center for Gene Diagnosis, Zhongnan Hospital of Wuhan University, Wuhan, Hubei 430071, China
5. Department of Oncology, The Fifth Affiliated Hospital of Sun Yat-sen University, Zhuhai, Guangdong 519000, China
6. Department of Biology, Hong Kong Baptist University, Hong Kong, China
Received 2015-3-30; Accepted 2015-6-12; Published 2015-7-29
Abstract
Background: There clearly is a need for effective chemotherapy for early-stage, high-risk patients with human cervical carcinoma. Vinblastine (VBL) is a key microtubule inhibitor, but unproven in its mechanisms as an important antitumor agent in cervical carcinoma.
Methods: We selected the concentration of vinblastine inducing 30% cell death for analyses assessing the DNA content, gene expression and transcriptional gene regulation of VBL-treated KB-3 cells.
Results: Transcriptomic and hierarchical clustering analysis demonstrated that treatment of KB-3 cells with VBL altered the expression of a diverse group of genes with G2/M arrest, which regulated by four oncogenic or tumor suppresser transcription factors (AP1, NFKB1, RELA, and TP53). Functional pathway analysis revealed the disease response to the biological effects of vinblastine in cervical carcinoma chemotherapy including protein ubiquitination pathway, RhoGDI signaling, integrin signaling, agranulocyte adhesion and biapedesis, and actin nucleation pathways. Northern blots also confirmed that KRT-7, FN14, IER3, and ID1 were deregulated in VBL-treated KB-3 cells.
Conclusion: Transcriptional time series profiles and a functional pathway analysis of VBL-treated KB-3 cells will provide a new strategy for improving microtubule inhibitor chemotherapy for cervical carcinoma.
Keywords: KB-3 cells, vinblastine, gene expression, transcriptional gene regulation, pathway analysis.
Background
Human cervical carcinoma KB-3 cells, representing a subclone of human HeLa cells, are highly sensitive to most chemotherapeutic drugs, clone with high efficiency, growing rapidly (1, 2). Vinblastine (VBL), as a microtubule inhibitor, is an important antitumor agent that induces G2/M arrest and subsequent apoptosis in a wide variety of cell lines (3). It was well known that VBL treatment caused the down-regulation of p53 and its target p21 and up-regulation of tumor necrosis factor alpha and Bak in KB-3 cells, identifying these genes as putative targets of vinblastine-inducible AP-1, which demonstrated that VBL -inducible AP-1 played a destructive, proapoptotic role and regulated the expression of a specific subset of target genes (4). p21 was also confirmed to play a protective role in VBL-induced apoptosis in KB-3 cells through a c-Jun regulated pathway (5). Repression of proangiogenic and metastatic factors (VEGF, bFGF, MMP2, and MMP9) was also detected in VBL-treated cancer cells (6). However, the networks of affecting gene expression programs and the molecular mechanisms of antitumor of this microtubule inhibitor that link G2/M arrest and apoptosis in VBL-treated cervical cancer are poorly understood.
In our previous studies, 49 genes were down-regulated when VBL-resistant KB-v1 cells were subjected to lower dose or depletion of VBL and DNA microarray is a very useful tool to detect drug response targets in cancer treatment (7). Thus, in view of the complex array of genetic factors contributing to VBL treatment of KB-3 cells, cDNA microarray should be useful for examining the drug response in cancer. Identification of transcription factor (TF) target genes would help for elucidating the transcriptional control of the VBL-triggering gene expression programs. Thus, these analyses may ultimately enable the use of signature expression profiles of drug treatment to predict response to VBL, further to improve our understanding of mechanisms of microtubule inhibitor in human cervical carcinoma cancer KB-3 cells.
Methods
Cytotoxicity assay
The sulforhodamine B (SRB) assay standard procedures were used (8). KB-3 cells were purchased from the American Type Culture Collection and cultured in DMEM supplemented with 10% heat-inactivated fetal calf serum and the antibiotics penicillin and streptomycin. In this assay, KB-3 cells were plated in 96-well culture plates (104 cells/well) and were grown overnight at 37oC in a 5% CO2 incubator. VBL was then added to the wells to achieve a final concentration ranging from 10-6 to 10-4 M. Control wells were prepared by adding 100 μl culture medium. The plates were incubated at 37oC in a 5% CO2 incubator for 48 h. After adding 50 μl of 50% trichloroacetic acid for 10 min at room temperature, the plates were then put at 4oC for 4 h and the supernatant were removed, washed 5 times with H2O. Then, SRB was added to each well for 30 minutes. Unbound dye was removed by four washes with 1% acetic acid. The protein-bound dye was extracted with 10 mM Tris base at a wavelength of 515 nm. The LD50 and LD30 were determined from the plots of percent viability vs. dose of compound added.
Cell cycle analysis
To determine cell cycle distribution, 5 x 10⁵ cell were plated in 60-mm dishes, treated with 2.5 x 10⁻⁴ µM of vinblastine for 0, 2, 4, 8, 12, 24, and 48 h. Cells were then collected by trypsinization, fix in 95% ethanol, wash in 1% BSA-PBS, resuspended in 1 μg/ml of RNase and 50 μg/ml of PI, incubated for 30 min in the dark at 37oC, and analyzed by flow cytometry using a FACSCalibur. The data were analyzed using the ModFit DNA analysis program as described previously (9).
Gene expression profiling
RNA was isolated with Trizol LS (Invitrogen, Carlsbad, CA, USA) and purified using the RNeasy Mini Kit (Qiagen, Valencia, CA, USA). RNA quality was assessed using an Agilent 2100 Bioanalyzer (Agilent Technologies, Waldbronn, DE, USA). Total RNA from each sample was labelled using a Low Input Labeling Kit (Agilent Technologies), which involves reverse transcribing the mRNA to produce cDNA and then transcribing in the presence of Cy3-CTP or Cy5-CTP to produce labelled cRNA from pancreatic cancer cell lines was paired with differentially labelled cRNA from KB-3 cells or VBL-treated KB-3 cells and hybridized to a 44K Whole Human Genome Oligo Microarray (Agilent Technologies) at 60 °C for 17 h according to the manufacturer's protocol. To reduce systematic bias, dye-swap hybridizations were performed for each cell line, and the resulting data were combined with analysis, in which dye assignment was reversed in the second hybridization in Agilent arrays.
Microarray data and pathway analysis
The microarray data were represented as the antilog ratio of gene expression measures of VBL treated KB-3 cells to untreated KB-3 cells. The data were normalized and analyzed using Partek Genomics Solution software, as reported in our previous studies (10). We used the Ingenuity Pathway Analysis (IPA) tool to determine the enriched canonical pathways on the basis of differential gene expression.
Identification of transcription factor (TF) target genes
Previously, we developed a bioinformatics tool CMGRN to identify target gene of TFs and to construct gene regulatory networks, that has been successfully applied in cancer dataset (11). This method is based on Bayesian hierarchical model with Gibbs sampling implementation to calculate joint conditional probability that genes is regulated by TFs. It is able to integrate both gene expression profiles with binding data of TFs, and to predict target genes of TFs (11). Here, we applied this methodology to integrate expression data of the differentially expressed genes (fold change at least 1.5) from the VBL-treated microarray experiment and the binding data of four TFs, NFKB1, RELA, AP1 and TP53 derived from Yan et al (12). As a result, we will predict target genes of the four TFs and then infer the transcriptional gene regulatory networks.
Northern blotting
Total cellular RNA of untreated or VBL-treated KB-3 cells was isolated as described previously (7), run on a 1% agarose gel (15 g per gel lane) containing 2.2 M formaldehyde, and transferred to a nitrocellulose membrane. Membrane was dried at room temperature, and RNA was cross-linked by UV irradiation in a Stratalinker (Stratagene). Hybridization was performed in ExpressHyb Hybridization buffer (CLONTECH) containing 1 x 10⁶ cpm/ml of 32P-labeled cDNA probe (ID1, IER3, KRT-7, FN14 and β-actin) at 65oC for 2 h. Blots were washed in 2 x SSC and 0.1% SDS for 20 min, followed by a wash at 50oC in 0.2 x SSC and 0.1% SDS for 20 min.
Results
Flow cytometry analysis of the effect of vinblastine on KB-3 cells
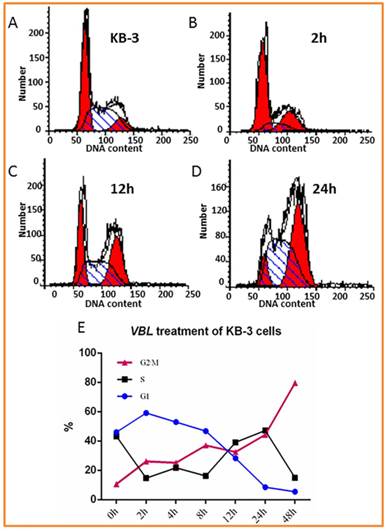
First, we tested the cytotoxicity of vinblastine in human cervical carcinoma KB-3 cells using Sulforhodamine B (SRB) assay as described previously (8). After KB-3 cells were treated with VBL for 48 h, the median lethal dose (LD50) and the concentration of vinblastine at which 30% cell death was reached (LD30) in KB-3 cells were 6.8 x 10⁻⁴ µM and 2.5 x 10⁻⁴ µM, respectively. The flow cytometry assay provides information regarding cell cycle phase sensitivity to apoptosis is based on bivariate analysis of their DNA content (9). Next, the concentration of LD30 was selected for analyses assessing the DNA content of vinblastine-treated KB-3 cells, which was examined via propidium iodide (PI) staining and flow cytometry. At 0, 2, 4, 8, 12, 24, and 48 h post-treatment with 2.5 x 10⁻⁴ µM of vinblastine, KB-3 cells arrested predominately at G2/M phase of the cell cycle and the number of cells in the G1 phase had diminished (Fig. 1). With a longer duration of treatment (24 h), a much greater percentage of KB-3 cells at G2/M phase. These results indicate that KB-3 arrested at G2/M in response to vinblastine treatment.
Effect of vinblastine (VBL) on cellular DNA content. KB-3 cells untreated and treated with 2.5 x 10⁻⁴ µM of vinblastine for 2, 4, 8, 12, 24, and 48 h. Cells were subjected to DNA content analysis by flow cytometry with PI staining. A-D: KB-3 cells treated with 2.5 x 10⁻⁴ µM of VBL for 0, 2, 12 and 24h. E: Data analysis of Effect of VBL on cellular DNA content in KB-3 cells treated with 2.5 x 10⁻⁴ µM of VBL for 0, 2, 4, 8, 12, 24, and 48 h.
Gene clustering analysis showing the differentially expressed genes in VBL treated KB-3 cells in a time-dependent manner
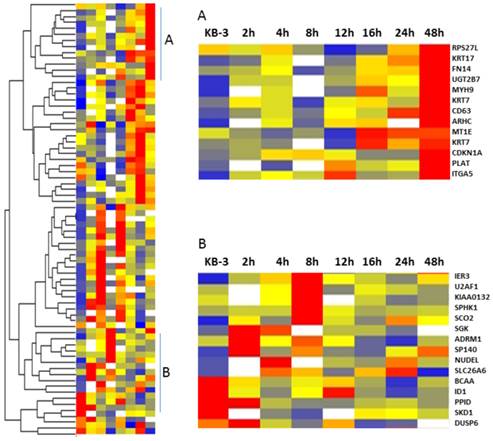
The VBL response gene candidates were selected based on the patterns from a heat-map figure (Fig. 2) from the 73 normalized gene lists via Partek Genomic Suite. The red is for the up-regulated genes, blue is for down-regulated genes, white is for the missing data in a time point, which were from differently expressed genes in KB-3 cells treated with 2.5 x 10⁻⁴ µM of vinblastine at 0, 2, 4, 8, 12, 16, 24, and 48 h, and identified to change in the transcriptome at a normal cutoff value ≥ ± 1.5-fold in 80% tested samples. Hierarchical clustering has the advantage that it is simple and the results can be easily visualized (13), and was used to partition data into two groups that have similar expression patterns (Fig. 2). These classes of genes could be distinguished into those whose mRNA levels remained induced for much longer (Fig. 2, cluster A) and those that responded early and whose induction was transient (Fig 2. cluster B), which included IER3, SCO2, SP140, ID1, DUSP6, ADRM1, U2AF1, NUDEL, SLC26A6, BCAA, PPID, SKD1, SPHK1, and SGK. Over-expressed genes in MDR KB-v1 cells can also be found in cluster A, which showed gradually increasing gene expression in VBL treatment of KB-3 cells as a function of time, including the genes that responded later (KRT 7, KRT 17, FN14, UGT2B7, ITGA5, and CD63) that appeared to be related to drug resistance involving cell wall metabolism, drug modification, and signal transduction (7). The transcriptional response to vinblastine suggests a multifaceted role for KB-3 cells in the physiology of drug metabolism.
Cluster image showing the different classes of gene expression profiles. Five hundred thirty-six genes whose RNA levels changes in response to 2.5 x 10⁻⁴ µM of vinblastine were selected. This subset of genes was clustered hierarchically into groups on the basis of the similarity of their expression profiles. The graphs show the average expression profiles for the genes in the corresponding cluster A and B.
Northern blot analysis was used to verify the array hybridization data
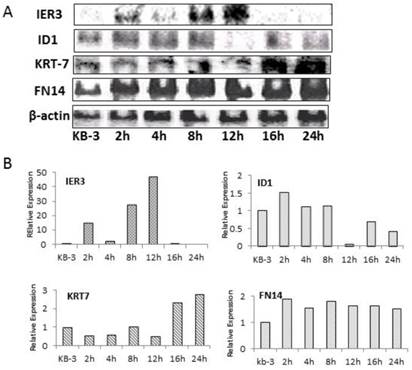
Northern blot analysis of ID1, IER3, KRT-7, FN14, and β-actin was performed on RNA prepared from KB-3 cells that were treated with 2.5 x 10⁻⁴ µM VBL for 0, 2, 4, 8, 12, 16, and 24 h and demonstrated that ID1, IER3, KRT-7, and FN14 were deregulated in KB-3 cells treated with VBL compared to β-actin as control (Fig. 3). Northern blot analysis of deregulated genes in KB-3 cells treated with VBL verified the array hybridization data.
Northern Blots analysis of ID1, IER3, KRT-7 and FN14, and ß-actin was used to normalize the RNA quantity in each sample (A). Analyzed the quantification of the mRNA expression levels of ID1, IER3, KRT-7 and FN14 those normalized to ß-actin in KB-3 cells treated with vinblatine (B).
Functional networks and pathways of VBL-induced stress response in human cervical carcinoma KB-3 cells were analyzed by the Ingenuity Pathway Analysis (IPA)
The genetic networks and cellular pathways were derived using the IPA program by analyzing 73 genes that were differentially expressed in VBL-treated KB-3 cells. A more comprehensive network and pathway analysis of all deregulated genes revealed their association with four important network functions and five critical canonical pathways, all of which are relevant to VBL-treated KB-3 cells. The differently expressed genes constituted about half the total molecules involved and the network-associated cellular functions and included those related to dermatological diseases and conditions, inflammatory disease, inflammatory response, energy production, cellular development, digestive system development and function, embryonic development, organ development, cancer, and cellular movement in VBL- treatment of cells (Table 1). They belong to five canonical signaling pathways that are commonly deregulated in VBL treatment (Table 2). Although only 14 (HSPA8, PSMD11, PSMC1, HLA-C, PSMD1, PSMD8, RHOC, ITGA5, RHOF, ACTG1, MSN, MYH9, CLDN1, and CAPN2) were deregulated in VBL-treated KB-3 cells with the protein ubiquitination, RhoGDI signaling, integrin signaling, agranulocyte adhesion and biapedesis, and actin nucleation signaling pathways, which play a role in in controlling cancer cell growth, microtubule inhibition, and the stress response of VBL- treated KB-3 cells.
Genetic networks associated with VBL-treated KB-3 cells.
| Top 4 VBL networks | Score | Focus molecules | Molecules in network |
|---|---|---|---|
| Dermatological diseases and conditions, inflammatory disease, inflammatory response | 42 | 19 | 19S proteasome, 20s proteasome, 26s Proteasome, Actin, ADRM1, Alpha tubulin, ATPase, CD63, Cytokeratin, ENaC, ERK1/2, ID1, IER3, KRT7, KRT14, KRT15, KRT17, Mlc, MYH9, Myosin, POLK, PP2A, PSMC1, PSMD, PSMD1, PSMD8, PSMD11, RACGAP1, RHOC, Rock, Smad, SMAD2, Ubiquitin, VPS4B, WNK1 |
| Energy production, cellular development, digestive system development and function | 31 | 15 | ABCF1, ANXA3, ATG4D, C1orf50, Calmodulin, DDX5, ERK, FAM216A, FBXO9, GDAP2, HLA-C, HNF1A, HNF4A, LOC102724594/U2AF1, MRPL19, MRPL33, MTRF1L, ORMDL2, PAM, Pka, PLP2, PRMT3, RNF44, SLC35D1, SLC7A6OS, SNX11, SP140, TAGLN2, TMUB2, TPM4, UBC, UGT2B7, ZNF155, ZNF442, ZNF586 |
| Embryonic development, organ development, | 28 | 14 | ACTG1, AKR1B1, Alpha catenin, ANXA4, caspase, CD3, CDKN1A, Clathrin, cytochrome C, estrogen receptor, F Actin, Hdac, Histone h3, Histone h4, HSPA8, IL12 (complex), Insulin, Interferon alpha, Jnk, LGALS3BP, MAGED2, MBD1, MSN, NFkB (complex), Notch, P38 MAPK, PI3K (complex), PPID, Pro-inflammatory Cytokine, Ras homolog, RHOF, RNA polymerase II, RPS3, RPS27L, SGK1 |
| Cancer, cellular movement | 23 | 12 | Akt, Alp, Ap1, AURKA, calpain, CAPN2, Cg, CLDN1, Creb, Cyclin A, DUSP5, Fibrinogen, Focal adhesion kinase, FSH, IL1, ITGA5, LDL, Lh, Mek, MT1E, MT1L, NMDA Receptor, NT5E, p85 (pik3r), Pdgf (complex), PDGF BB, Pkc(s), PLAT, PLC gamma, Ras, SLC26A6, SOD2, SPHK1, Tgf beta, VegfF |
Top 5 canonical pathways involving genes that are differently expressed in VBL- treated KB-3 cells, as determined by Ingenuity Pathway Analysis.
| Top 5 Canonical Pathways | P value | Ratio | Molecules |
|---|---|---|---|
| Protein Ubiquitination Pathway | 1.31E-04 | 2.35E-02 | HSPA8, PSMD11, PSMC1, HLA-C, PSMD1, PSMD8 |
| RhoGDI Signaling | 1.91E-04 | 2.89E-02 | RHOC, ITGA5, RHOF, ACTG1, MSN |
| Agranulocyte Adhesion and Diapedesis | 2.88E-04 | 2.65E-02 | MYH9, CLDN1, ITGA5, ACTG1, MSN |
| Integrin Signaling | 3.90E-04 | 2.48E-02 | RHOC, ITGA5, CAPN2, RHOF, ACTG1 |
| Actin Nucleation | 6.84E-04 | 5.36E-02 | RHOC, ITGA5, RHOF |
Transcriptional gene regulatory network in VBL-treated cells
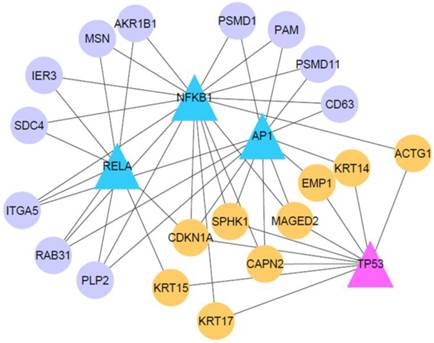
It has been demonstrated that some oncogenic or tumor suppresser TFs are implicated in affecting gene expression programs in cervical cancer, such as NF-κB (14, 15), AP1 (4, 14), and TP53 (16). In order to elucidate how these cancer-related TFs affect the response of VBL-treated KB-3 cells, we employed a newly developed bioinformatics method to identify their target genes (11). As shown in Table 3, we display the predicted target genes of AP1, NFKB1, RELA, and TP53. Some target genes have been validated in previous studies, for example, CDKN1A (p21), DUSP5, IER3, ITGA5, RPS27L and SOD2 (Table 3). We constructed a transcriptional gene regulatory network controlled by the four TFs (Fig. 4). Noticed is that nine genes are co-targeted by oncogenic (AP1, NFKB1 and RELA) and tumor suppresser TFs (TP53), and involve biological processes apoptosis (CDKN1A and SPHK1), calcium-activated neutral proteinase (CAPN2), epidermis development (EMP1, ACTG1, KRT14, KRT15 and KRT17), and tumor-associated antigen (MAGED2). By contrast, the oncogenic TFs also regulate genes related with ubiquitin-protein modification (PSMD11 and PSMD1), apoptosis (IEG3), and cell adhesion (ITGA5 and MSN). This result indicates a possibility of transcriptional gene regulation that mediates the VBL-induced response in the cancer cells.
Transcription factor target genes in VBL-treated tumor cells.
| Gene symbol | AP1 | NFKB1 | RELA | TP53 |
|---|---|---|---|---|
| ACTG1 | predicted target | predicted target | ||
| AKR1B1 | predicted target | predicted target | ||
| CAPN2 | predicted target | predicted target | predicted target | |
| CD63 | predicted target | predicted target | ||
| CDKN1A | validated target | validated target | validated target | validated target |
| CLDN1 | predicted target | |||
| DUSP5 | validated target | |||
| EMP1 | predicted target | predicted target | ||
| HLA-C | predicted target | |||
| HSPA8 | predicted target | |||
| IER3 | validated target | validated target | ||
| ITGA5 | predicted target | validated target | validated target | |
| KCNK1 | predicted target | |||
| KRT14 | predicted target | predicted target | ||
| KRT15 | predicted target | predicted target | ||
| KRT17 | predicted target | predicted target | ||
| LASP1 | predicted target | |||
| LGALS3BP | predicted target | |||
| MAGED2 | predicted target | predicted target | predicted target | |
| MORF4L2 | predicted target | |||
| MSN | predicted target | predicted target | ||
| MT1E | predicted target | |||
| MYH9 | predicted target | |||
| MYO1C | predicted target | |||
| PAM | predicted target | predicted target | ||
| PLP2 | predicted target | predicted target | predicted target | |
| PSMC1 | predicted target | |||
| PSMD1 | predicted target | predicted target | ||
| PSMD11 | predicted target | predicted target | ||
| PSMD8 | predicted target | |||
| RAB31 | predicted target | predicted target | predicted target | |
| RPS27L | validated target | |||
| SDC4 | predicted target | predicted target | ||
| SOD2 | validated target | |||
| SPHK1 | predicted target | predicted target | predicted target | |
| STC2 | predicted target | |||
| TAGLN2 | predicted target | |||
| TPM4 | predicted target |
Transcriptional gene regulatory network in VBL-treated KB-3 cell. Triangle nodes represent four TFs AP1, NFKB1, RELA and TP53. Circle nodes refer to target genes of at least two TFs. Orange nodes refer to genes jointly regulated by TP53 and other TFs.
Discussion
In this study, first, cytotoxicity studies and the flow cytometry assay provided information regarding the cytotoxicity of microtubule inhibitor in KB-3 cells and cell cycle phase sensitivity to apoptosis is based on bivariate analysis of their DNA content. The DNA content of untreated and VBL-treated KB-3 cells was examined via PI staining and flow cytometry. At 12 h post-treatment with 2.5 x 10⁻⁴ µM of VBL (LD30), KB-3 cells were arrested predominately at G2/M phase of the cell cycle and G1 phase was apparently decreased (Fig. 1). Under a longer duration of treatment, a much greater percentage of KB-3 was arrested at G2/M phase. The result indicated that KB-3 arrested at G2/M in response to VBL. At the same time, the hierarchical clustering analysis revealed that RPS27L, KRT17, FN14, UGT2B7, MYH9, CD63, ARHC, MT1E, KRT7, CDKN1A, PLAT, and ITGA5 were responsible for KB-3 cells arrested predominately at G2/M phase of the cell cycle with 2.5 x 10⁻⁴ µM vinblastine, which were highly overexpressed in VBL-treated KB-3 cells that responded later including those that control the cell cycle, DNA repair, and drug resistance. In these later response genes, RPS27L-expressing LoVo cells ceased DNA synthesis and apoptotic activity, and elevated RPS27L may improve the prognoses of certain CRC patients by enhancing the DNA repair capacity of their colonic cells (17). CDKN1A, as a negative regulator of cell proliferation and DNA replication, plays additional and fundamental roles in other important pathways, including regulation of transcription, apoptosis and DNA repair (18). UGT2B7 is an enzyme responsible for detoxification of xenobiotics, as one of the most active UDP-glucuronosyltransferases, involved in drug metabolism and in maintaining homeostasis of endogenous compounds (19). The expression of keratins is highly dependent on the state of cell development and differentiation and varies within different types of epithelia (20-22). For example, the incidence of a positive expression for KRT7 and KRT17 was significantly higher in desmoplastic malignant mesothelioma than in fibrous pleuritis (23). Fibroblast growth factor-inducible 14 (FN14) protein expression was associated with the invasive and metastatic potential of NSCLC and promotes hepatocyte growth factor receptor (HGFR/MET)-driven cell invasion (24). Our Northern blot validation of gene expression profiles confirmed that KRT-7 and FN14 were upregulated genes that responded later in KB-3 cells.
On the other hand, Figure 2 also shows that Cluster B of genes in the transcriptional program of KB-3 cells in early response to vinblastine treatment share similar expression patterns in transcript levels, which mRNA levels increase at 2, 4, and 8 h with vinblastine treatment, includes IER3, ID1, SCO2, SP140, DUSP6, ADRM1, U2AF1, NUDEL, SLC26A6, BCAA, PPID, SKD1, SPHK1, and SGK, which are known or likely to be involved in stress response, apoptosis, and PI3K/Akt signal transduction pathways. IER3 (early response gene immediate early response 3), which is induced by various stimuli, such as growth factors, cytokines, ionizing radiation, viral infection, and other types of cellular stress, plays a complex and to some extent contradictory role in cell cycle control and apoptosis (25). The lack of IER3 expression is associated with a deregulation of the NF-κB and PI3K/Akt pathways (26, 27), which represents a novel mechanism of Nrf2 regulation that may be lost in tumors and by which IER3 exerts its stress-adaptive and tumor-suppressive activity (28). Additionally, inhibitor of DNA binding (ID) family members are key regulatory proteins in a wide range of developmental and cellular processes and function by inhibiting target proteins that include the basic helix-loop-helix transcription factors (29). ID1 and ID3 function together to govern colon cancer-initiating cell self-renewal through p21 driven cell-cycle restriction (30). Based on the bioinformatics model analysis, we demonstrated that four major TFs (AP1, NFKB1, RELA, and TP53) and the downstream genes likely form regulatory networks to modulate genes expression programs related with the VBL-induced response in cervical cancer cells. Two members of NF-κB, RELA and NFKB1, can regulate IER3 and p21, providing evidence for involvement of this oncogenic TF in response of KB-3 cells to VBL through targeting apoptosis signaling. Our Northern blot analyses further confirmed that IER3 and ID1 were upregulated genes those responded early in KB-3 cells.
Last, we demonstrated that 14 genes, deregulated in VBL-treated KB-3 cells, were involved in five signaling pathways including protein ubiquitination pathway (HSPA8, PSMD11, PSMC1, HLA-C, PSMD1, PSMD8), RhoGDI signaling (RHOC, ITGA5, RHOF, ACTG1 and MSN), agranulocyte adhesion and biapedesis (MYH9, CLDN1, ITGA5, ACTG1 and MSN), integrin signaling (RHOC, ITGA5, CAPN2, RHOF and ACTG10), and actin nucleation by ARP-WASP complex (RHOC, ITGA5, RHOF) (Table 2). Gene network analysis reveals that cancer-related TFs are able to regulate these pathway genes, such as PSMD1, PSMD11, ITGA5 and MSN (Fig. 4). These functional pathways will help us understand the response of human cervical carcinoma to the biological effects of microtubule inhibitor as chemotherapy.
In summary, the present results represent an important advancement and provide a sound basis for further exploration, but we also recognize that in vitro results almost certainly represent a distorted and incomplete rendering of the normal physiological response of KB-3 cells to microtubule inhibitor. Transcriptional profiles and pathway analysis offer an opportunity to generate functional data on a genome-wide scale. Thus, mediating protein ubiquitination, RhoGDI signaling, and integrin signaling pathways may have a direct and effective impact on human cervical carcinoma treatment with microtubule inhibitor.
Abbreviations
CAPN2, Calcium-activated neutral proteinase; FN14, Fibroblast growth factor-inducible 14; IER3, Early response gene immediate early response 3; IPA, Ingenuity pathway analysis; ID, Inhibitor of DNA binding; LD50, Median lethal dose; SRB, Sulforhodamine B; TF, Transcription factor; VBL, Vinblastine.
Conflict of Interest
All authors have no conflict of interest.
Acknowledgements
The work described in this paper was supported by National Natural Science Foundation of China Grants 81271919 and 81072496H1014, and the work in Jin Wang's laboratory is supported partially by a grant (RCJJP21) from Shanghai Public Health Clinical Center, China.
References
1. Nelson-Rees WA, Flandermeyer RR. HeLa cultures defined. Science. 1976;191(4222):96-98
2. Yue B, Zhao CR, Xu HM. et al. Riccardin D-26, a synthesized macrocyclic bisbibenzyl compound, inhibits human oral squamous carcinoma cells KB and KB/VCR: In vitro and in vivo studies. Biochim Biophys Acta. 2013;1830(1):2194-2203
3. Studzinski GP, Bhandal AK, Brelvi ZS. Cell cycle sensitivity of HL-60 cells to the differentiation-inducing effects of 1-alpha,25-dihydroxyvitamin D3. Cancer Res. 1985;45(8):3898-3905
4. Fan M, Goodwin ME, Birrer MJ. et al. The c-Jun NH(2)-terminal protein kinase/AP-1 pathway is required for efficient apoptosis induced by vinblastine. Cancer Res. 2001;61(11):4450-4458
5. Bene A, Chambers TC. p21 functions in a post-mitotic block checkpoint in the apoptotic response to vinblastine. Biochem Biophys Res Commun. 2009;380(2):211-217
6. Auyeung KK, Law PC, Ko JK. Combined therapeutic effects of vinblastine and astragalus saponins in human colon cancer cells and tumor xenograft via inhibition of tumor growth and proangiogenic factors. Nutr Cancer. 2014;66(4):662-674
7. Wang J, Tai LS, Tzang CH. et al. 1p31, 7q21 and 18q21 chromosomal aberrations and candidate genes in acquired vinblastine resistance of human cervical carcinoma KB cells. Oncol Rep. 2008;19(5):1155-1164
8. Skehan P, Storeng R, Scudiero D. et al. New colorimetric cytotoxicity assay for anticancer-drug screening. J Natl Cancer Inst. 1990;82(13):1107-1112
9. Wang J, Fong CC, Tzang CH. et al. Gene expression analysis of human promyelocytic leukemia HL-60 cell differentiation and cytotoxicity induced by natural and synthetic retinoids. Life Sci. 2009;84(17-18):576-583
10. Wang J, Chan JY, Fong CC. et al. Transcriptional analysis of doxorubicin-induced cytotoxicity and resistance in human hepatocellular carcinoma cell lines. Liver Int. 2009;29(9):1338-1347
11. Guan D, Shao J, Deng Y. et al. CMGRN: a web server for constructing multilevel gene regulatory networks using ChIP-seq and gene expression data. Bioinformatics. 2014;30(8):1190-1192
12. Yan B, Li H, Yang X. et al. Unraveling regulatory programs for NF-kappaB, p53 and microRNAs in head and neck squamous cell carcinoma. PLoS One. 2013;8(9):e73656
13. Iyer VR, Eisen MB, Ross DT. et al. The transcriptional program in the response of human fibroblasts to serum. Science. 1999;283(5398):83-87
14. Kim SH, Oh JM, No JH. et al. Involvement of NF-kappaB and AP-1 in COX-2 upregulation by human papillomavirus 16 E5 oncoprotein. Carcinogenesis. 2009;30(5):753-757
15. Song LL, Peng Y, Yun J. et al. Notch-1 associates with IKKalpha and regulates IKK activity in cervical cancer cells. Oncogene. 2008;27(44):5833-5844
16. Ojesina AI, Lichtenstein L, Freeman SS. et al. Landscape of genomic alterations in cervical carcinomas. Nature. 2014;506(7488):371-375
17. Huang CJ, Yang SH, Lee CL. et al. Ribosomal protein S27-like in colorectal cancer: a candidate for predicting prognoses. PLoS One. 2013;8(6):e67043
18. Stivala LA, Cazzalini O, Prosperi E. The cyclin-dependent kinase inhibitor p21CDKN1A as a target of anti-cancer drugs. Curr Cancer Drug Targets. 2012;12(2):85-96
19. Menard V, Collin P, Margaillan G. et al. Modulation of the UGT2B7 enzyme activity by C-terminally truncated proteins derived from alternative splicing. Drug Metab Dispos. 2013;41(12):2197-2205
20. Coulombe PA, Lee CH. Defining keratin protein function in skin epithelia: epidermolysis bullosa simplex and its aftermath. J Invest Dermatol. 2012;132(3 Pt 2):763-775
21. Moll R, Divo M, Langbein L. The human keratins: biology and pathology. Histochem Cell Biol. 2008;129(6):705-733
22. Simpson CL, Patel DM, Green KJ. Deconstructing the skin: cytoarchitectural determinants of epidermal morphogenesis. Nat Rev Mol Cell Biol. 2011;12(9):565-580
23. Horiuchi T, Ogata S, Tominaga S. et al. Immunohistochemistry of cytokeratins 7, 8, 17, 18, and 19, and GLUT-1 aids differentiation of desmoplastic malignant mesothelioma from fibrous pleuritis. Histol Histopathol. 2013;28(5):663-670
24. Whitsett TG, Fortin Ensign SP, Dhruv HD. et al. FN14 expression correlates with MET in NSCLC and promotes MET-driven cell invasion. Clin Exp Metastasis. 2014;31(6):613-623
25. Arlt A, Schafer H. Role of the immediate early response 3 (IER3) gene in cellular stress response, inflammation and tumorigenesis. Eur J Cell Biol. 2011;90(6-7):545-552
26. Arlt A, Kruse ML, Breitenbroich M. et al. The early response gene IEX-1 attenuates NF-kappaB activation in 293 cells, a possible counter-regulatory process leading to enhanced cell death. Oncogene. 2003;22(21):3343-3351
27. Osawa Y, Nagaki M, Banno Y. et al. Expression of the NF-kappa B target gene X-ray-inducible immediate early response factor-1 short enhances TNF-alpha-induced hepatocyte apoptosis by inhibiting Akt activation. J Immunol. 2003;170(8):4053-4060
28. Stachel I, Geismann C, Aden K. et al. Modulation of nuclear factor E2-related factor-2 (Nrf2) activation by the stress response gene immediate early response-3 (IER3) in colonic epithelial cells: a novel mechanism of cellular adaption to inflammatory stress. J Biol Chem. 2014;289(4):1917-1929
29. Perk J, Iavarone A, Benezra R. Id family of helix-loop-helix proteins in cancer. Nat Rev Cancer. 2005;5(8):603-614
30. O'Brien CA, Kreso A, Ryan P. et al. ID1 and ID3 regulate the self-renewal capacity of human colon cancer-initiating cells through p21. Cancer Cell. 2012;21(6):777-792
Author contact
![]() Corresponding authors: Jin Wang, Ph.D., Scientific Research Center, Shanghai Public Health Clinical Center, 2901 Caolang Road, Jinshan District, Shanghai 201508, China; Ph: 86-21-37990333-7336; Fax: 86-21-57247094; Email: wjincityucom Or Haiqing Ma (haiqing_macom)
Corresponding authors: Jin Wang, Ph.D., Scientific Research Center, Shanghai Public Health Clinical Center, 2901 Caolang Road, Jinshan District, Shanghai 201508, China; Ph: 86-21-37990333-7336; Fax: 86-21-57247094; Email: wjincityucom Or Haiqing Ma (haiqing_macom)