Impact Factor ISSN: 1837-9664

 Global reach, higher impact
J Cancer 2016; 7(3):297-303. doi:10.7150/jca.12771 This issue Cite
Research Paper
Predicting Prostate Biopsy Results Using a Panel of Plasma and Urine Biomarkers Combined in a Scoring System
Maher Albitar1, Wanlong Ma1, Lars Lund2, Ferras Albitar1, Kevin Diep1, Herbert A. Fritsche3, Neal Shore4 ![]()
1. NeoGenomics Laboratories, Irvine, CA;
2. Departments of Urology, Odense University Hospital, Odense, Denmark;
3. Health Discovery Corporation, Savanah, Georgia;
4. Carolina Urologic Research Center, Myrtle Beach, SC, USA.
Received 2015-5-23; Accepted 2015-10-29; Published 2016-2-2
Abstract
Background: Determining the need for prostate biopsy is frequently difficult and more objective criteria are needed to predict the presence of high grade prostate cancer (PCa). To reduce the rate of unnecessary biopsies, we explored the potential of using biomarkers in urine and plasma to develop a scoring system to predict prostate biopsy results and the presence of high grade PCa.
Methods: Urine and plasma specimens were collected from 319 patients recommended for prostate biopsies. We measured the gene expression levels of UAP1, PDLIM5, IMPDH2, HSPD1, PCA3, PSA, TMPRSS2, ERG, GAPDH, B2M, AR, and PTEN in plasma and urine. Patient age, serum prostate-specific antigen (sPSA) level, and biomarkers data were used to develop two independent algorithms, one for predicting the presence of PCa and the other for predicting high-grade PCa (Gleason score [GS] ≥7).
Results: Using training and validation data sets, a model for predicting the outcome of PCa biopsy was developed with an area under receiver operating characteristic curve (AUROC) of 0.87. The positive and negative predictive values (PPV and NPV) were 87% and 63%, respectively. We then developed a second algorithm to identify patients with high-grade PCa (GS ≥7). This algorithm's AUROC was 0.80, and had a PPV and NPV of 56% and 77%, respectively. Patients who demonstrated concordant results using both algorithms showed a sensitivity of 84% and specificity of 93% for predicting high-grade aggressive PCa. Thus, the use of both algorithms resulted in a PPV of 90% and NPV of 89% for predicting high-grade PCa with toleration of some low-grade PCa (GS <7) being detected.
Conclusions: This model of a biomarker panel with algorithmic interpretation can be used as a “liquid biopsy” to reduce the need for unnecessary tissue biopsies, and help to guide appropriate treatment decisions.
Keywords: RNA, Cell-free, Gleason, scoring, high-grade, algorithm.
1. Introduction
Prostate biopsy (Bx) is currently the standard of care for prostate cancer (PCa) diagnosis, oftentimes reflexed after the detection of an elevated serum prostate-specific antigen (sPSA). Unfortunately, prostate Bx is not without potential complications, which might consist of discomfort, pain, bleeding, as well as the associated and financial costs. Bleeding has been reported in 6-13% of patients undergoing prostate Bx, while 0.3-4% experience symptomatic infection [1]. Furthermore, some newly diagnosed prostate cancers are indolent while other may be more aggressive with metastastic potential, with resultant risk of death [3]. A sPSA level ≥4.0 ng/ml is frequently used as a threshold warranting a biopsy evaluation [4]. Elevated sPSA level may reflect benign prostatic hyperplasia (BPH), inflammation, or malignancy. Some series suggest that for patients with sPSA >4 ng/ml, only 20-30% will be positive for cancer, resulting in approximately 75% of patients undergoing an unnecessary biopsy.
Additional biomarkers detected in urine, including PCa gene 3 (PCA3) [5] and TMPRSS2-ERG gene fusions [6], have been shown to improve PCa detection specificity, especially when tested after digital rectal examination (DRE) [7]. Currently, the most used prognostic predictor of PCa's clinical course is Gleason score (GS) based on biopsy results [8]. Data suggests that interventional strategies are useful in improving patient outcomes if high-grade PCa (GS ≥7) is diagnosed early [9]. In fact, it has been proposed that low-grade PCa (GS <7) should not be classified as cancer and that predicting its presence is unnecessary [10].
We recently reported the ability to predict the presence of PCa and high-grade PCa using a combination of biomarkers detected in urine and peripheral blood plasma [10]. We have improved upon this approach by adding additional biomarkers. In the current study of 319 patients we used the expression levels of 10 different genes, as analyzed in the urine and peripheral blood plasma, to develop a model system to predict the prostate Bx results. Using machine learning techniques, we optimized the number of input features and identified the most accurate scoring algorithm. The goal of developing this testing is to: 1) reduce the incidence of negative biopsies and, 2) to determine patients which are more likely to have high-grade PCa
For this study, we used genes (UAP1, PDLIM5, IMPDH2, HSPD1) determined to be PCa specific based on array expression data [2] along with genes (PSA, PCA3, TMPRSS2, ERG, AR, PTEN) highly implicated as PCa specific. Phosphatase and Tensin Homolog (PTEN) is a tumor suppressor that negatively regulates the phosphatidylinositide 3-kinase (PI3K) signaling pathway which is upregulated in approximately 40% of PCa, making it the most frequently deregulated tumor suppressor gene in PCa [11], [12], [13]. High-levels of Androgen Receptor (AR), a nuclear steroid receptor, expression correlate with increased proliferation of cancer cells. PCa tumors that overexpress AR are more aggressive, and associated with recurrence and a shorter relapse time [14], [15]. Genomic profiling of PCa shows AR pathway alterations in 56% of primary PCa and 100% of metastatic disease [16]. TMPRSS2-ERG rearrangements have been reported in 40-70% of PCa [17] and the translocation leads to dysregulation of expression of both genes as well as to the expression of a fusion transcript [18]. The ERG gene alone has been implicated in the development and progression of PCa [19], [20].
2. Materials and Methods
2.1 Study Design and Patients
From four urology practices, we collected urine and blood samples of 319 patients presenting with a clinical decision to proceed to a prostate biopsy. Histologic examination of standardized 12-core biopsies for each patient was provided. GS was performed according to the new modified system based on the 2005 consensus conference [21]. Table 1 shows the characteristics of the recruited patients. Patients needed to be newly diagnosed to participate in the study, and we excluded patients receiving any therapy for BPH or PCa. Urine samples were collected without DRE and processed within 48 hours of collection without the use of any preservative. To assure that urine samples were not influenced by Bx or other manipulation, we collected a second sample within 6-12 months of the first sample from 30 patients who had no significant clinical change. The patients were followed up to a year of the time of obtaining samples. If prostatectomy was performed, pathology data of prostatectomy was collected. In addition, we studied the biomarker profile in the urine and plasma in an independent cohort of 20 patients who were post-prostatectomy and used this group as control. None of the patients in this group had evidence of metastatic cancer. All laboratory work was performed with the IRB-approved protocol (Western IRB).
Characteristics of patients included in the development of the diagnostic algorithms.
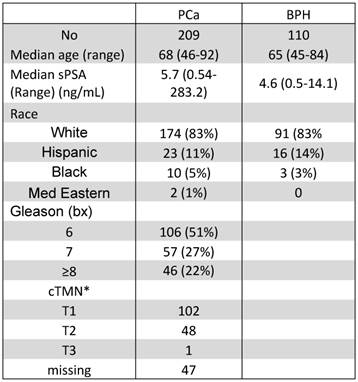
*cTMN: clinical tumor-node-metastases, none of the patients had evidence of metastasis and lymph node were not evaluated.
2.2 Urine and Plasma Processing
The urine sample from each patient was concentrated and plasma was separated and RNA from plasma and urine was extracted as previously described [10].
2.3 Quantitative Reverse Transcription-Polymerase Chain Reaction
Quantitative reverse transcription real time polymerase chain reaction (qRT-PCR) was performed as previously detailed [10]. The PTEN primers and probes were purchased as TaqMan Gene Expression Assays (Applied Biosystems). The primer probe set for the new biomarker AR was designed to encompass exons 6 and 7 and produced a PCR product of 91bp: 5'-GGAATTCCTGTGCATGAAAGC-3' (forward); 5'-CATTCGAAGTTCATCAAAGAATT-3' (reverse); VIC-CTTCAGCATTATTCCAGT-GMGBNFQ (probe).
2.4 Statistical Analysis
We compared multivariate regression models incorporating sPSA, age, and different biomarker combinations and determined their relevance based on the area under the receiver operating characteristic curve (AUROC). A single model was selected based on the fewest variables yielding the most favorable AUROC. Cross validation was performed using bootstrapping. To validate the selected model, we used an algorithm based on the training set, first using the testing sample set, then the training and testing sets in combination. An independent investigator performed the testing. We used the same approach and training set to predict, respectively, the patients with advanced GS PCa and presence of high-grade PCa (GS ≥7). There were 103 patients with GS ≥7 in the entire group. Of which 68 out of the 213 patients in the training set had GS ≥7.
3. Results
3.1 Patient Characteristics
Table 1 lists the characteristics of the patients in this study. Biopsies showed that 110 patients (34%) had BPH and 209 patients (66%) had PCa. The median age was 68 years (range: 46-92) in the PCa group and 65 years (range: 45-84) in the no-cancer group. The difference was borderline significant (P=0.054). As expected, the difference in PSA levels was significantly higher (P<0.0001) in the PCa group (median 5.7 ng/ml, range 0.54-283.2 ng/ml) as compared with no-cancer patients (median: 4.6 ng/ml, range: 0.5-14.1 ng/ml). However, 49 of the 209 patients (23%) with PCa had sPSA ≤4 ng/ml. In the no-cancer group, 37 patients (34%) had sPSA ≤4 ng/ml. Of the patients with cancer, 106 (51%) had GS 6, 57 (27%) had GS 7, and 46 (22%) had GS >7. There was no significant difference in race between the PCa and the no-cancer groups.
3.2 Comparing biomarkers in plasma
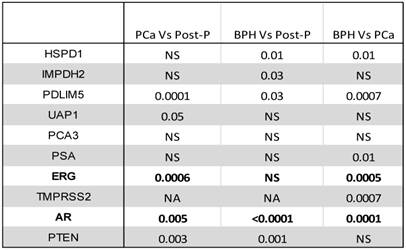
Biomarkers in plasma were measured using a standardized approach. RNA was extracted from equal amount of plasma and an equal amount of RNA solution was used in each RT/PCR reaction for all patients. Therefore, no normalization was used. We compared the levels of various markers between patients with and without cancer as well as the levels of these biomarkers to plasma samples collected from 20 patients after prostatectomy due to PCa (Table 2). The mRNA levels of PTEN, AR, ERG, UAP1, and PDLIM5 were significantly different in patients with PCa than post-prostatectomy patients (Wilcoxon Rank Sum test) (Table 2). Compared with post-prostatectomy samples, the no-cancer group had significantly different levels of PTEN, AR, PDLIM5, IMPDH2, and HSPD1 mRNA. In comparing the PCa group directly with the no-cancer group, AR, TMPRSS2, ERG, PSA, PDLIM5, and HSPD1 levels were significantly different (Table 2). PSA mRNA in the plasma was extremely low and barely detectable. The reason for this is not clear. In contrast, urine PSA mRNA was significantly more abundant (Table 2).
Comparing biomarker levels in plasma between patients with cancer, without cancer, and post-prostatectomy (P-value is shown; NS: Not Significant).
3.3. Comparing biomarkers in Urine
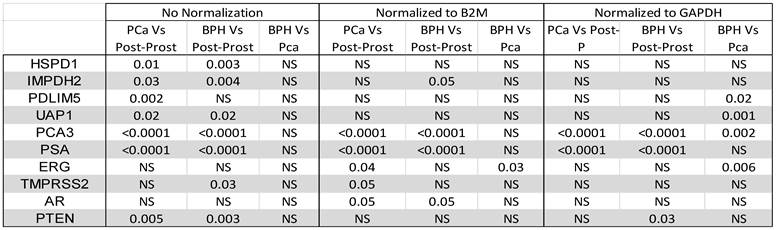
We concentrated all urine samples into 1 ml of urine and extracted RNA from all samples in a standardized fashion. Urine mRNA levels were compared between various groups before and after normalization to GAPDH or B2M as housekeeping genes (Table 3). As expected, the urine showed significant difference in the levels of PSA and PCA3 before and after prostatectomy for both cancer and no-cancer groups of patients, irrespective of normalization to housekeeping genes. However, there was no significant difference between cancer and no-cancer groups, except after normalization to GAPDH, which showed a significant difference in PDLIM5, UAP1, PSA, and ERG between the cancer and no-cancer groups (Table 3). ERG only was significantly different between the cancer and no-cancer groups after normalization to B2M (Table 3).
Comparing biomarkers levels in urine between patients with cancer, without cancer, and post-prostatectomy before and after normalization to either B2M or GAPDH (P-value is shown; NS: Not Significant).
3.4 Prediction of biopsy-based PCa diagnosis
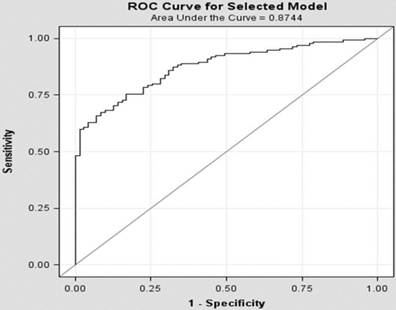
To develop a multivariable model for predicting Bx results, we divided patients into training and testing sets. Approximately two thirds (213 of 319: 68%) of patients were used for the training set and the development of the model for predicting PCa presence on the Bx. This set included 139 patients (65%) with PCa and 35% without cancer. We used the measured biomarkers in urine and plasma, along with sPSA and age in this group of patients, to screen for best biomarker combinations to predict the PCa patients, utilizing the algorithms indicated in Section 2.4. Logistic regression appeared to provide the best model with the least number of variables. One model included only 8 variables (Figure 1) and showed an area under the AUROC of 0.87. The biomarkers selected in this algorithm were ERG, AR, B2M, and GAPDH mRNA in plasma and PCA3, PTEN, and B2M mRNA from urine in addition to the sPSA. Using the testing set (N=106), this algorithm showed 79% sensitivity, 69% specificity, 83% PPV, and 63% NPV (Table 4) for detecting PCa using a cut-off at 0.64. The testing set results were comparable to those of the training set. When all patients were considered, the PPV and NPV were 87% and 63%, respectively (Table 4).
ROC Curve for predicting the presence of PCa using the training set only.
Sensitivity, specificity, positive predictive value and negative predictive value of the various algorithms.
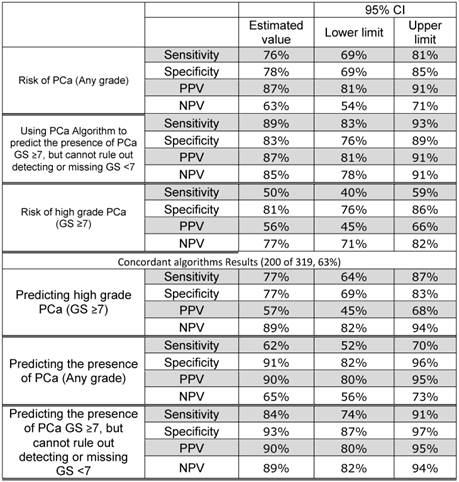
However, the majority of the missed patients using this algorithm were GS <7. The sensitivity and specificity were 89% and 83%, respectively, if we ignore missing low-grade PCa (Table 4). The PPV and NPV for detecting patients with PCa using this algorithm were 87% and 85%, respectively.
As noted in Section 2.1, we collected a second urine sample from 30 individuals. Measuring the biomarkers in the new samples, we then used these values in the algorithm and compared the overall classification. All 30 patients retained their original classification (5 positive and 25 negative).
3.5 Prediction of biopsy-based high-grade PCa
Considered by current standards to be similar to those with BPH, it is important to distinguish GS <7 PCa patients from GS ≥7 patients. Therefore, we grouped GS <7 (3+4 or 4+3) patients with no-cancer patients and used the training set for developing an algorithm for predicting GS ≥7 PCa on the Bx. The training set included 73 patients (34%) with high-grade PCa. As found previously, the best algorithm was logistic regression. The AUROC was 0.85 when using 13 variables; to assure reproducibility of results and to avoid overfitting, we used a model with only 8 biomarkers (ERG mRNA as measured in plasma and PSA, PTEN, PCA3, PDLIM5, GAPDH, and B2M mRNA as measured in urine) at an AUROC of 0.80. The ERG in plasma most likely reflects the biological relevance of TMPRSS2:ERG translocation. The PDLIM5 gene encodes for a protein that is believed to function as a scaffold protein involved in facilitating the activities of kinases related to muscles. Association between PDLIM5 expression and PCa has been reported [2] A four-gene expression signature for PCa cells consists of UAP1, PDLIM5, IMPDH2, and HSPD1 [2] appears to be involved in cancer cell proliferation [14]. The PSA mRNA was used with PCA3 in this model, with normalization to GAPDH and B2M also necessary. In addition, this model incorporated sPSA and age.
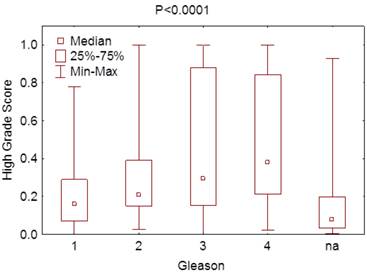
Using this model with the test samples, which included 37 patients (35%) with high-grade PCa, the specificity was 80% but sensitivity 41% for predicting high-grade PCa patients. The PPV and the NPV were 52% and 71%, respectively. These were similar to those seen in the training set. When all patients were used for predicting high-grade PCa, the sensitivity and specificity were 50% and 81%, respectively. Furthermore, there was significant difference in scoring using this algorithm between various Gleason grades (P < 0.0001) (Figure 2).
Correlation between the score obtained for the prediction of high-grade PCa and the GS.
3.6 Combined algorithms for predicting PCa
Each of the above two algorithms is a trained to predict different biopsy results. The first predicts the presence of any PCa while the second predicts the presence of high-Gleason grade PCa, although there is partial overlap. Since conceptually the most important aspect is predicting high-grade PCa, the strongest prediction is achieved when both algorithms are either both positive or both negative. When patients were tested by both algorithms, 200 of the 319 patients (63%) had concordant results. Predicting patients with high-grade PCa was significantly more reliable when the results were concordant, with both sensitivity and specificity of 77%. The PPV and NPV were 57% and 89% (Table 4), the sensitivity and specificity for predicting any cancer were 62% and 91%, and PPV and NPV 90% and 65%, respectively. However, most of these patients who were missed (low sensitivity) were GS <7. If these patients with GS <7 are accepted as negative, the sensitivity and specificity of the results were 84% and 93%, and PPV and NPV 90% and 89%, respectively (Table 4).
3.7. Correlation with prostatectomy findings
At one year of follow up, prostatectomy data was available on 73 of the 319 patients. All 73 patients with prostatectomy data were classified as cancer patients based on the biopsy. Of these patients only 19 patients had GS 6. Of these 7 patients were re-classified as GS 7 (3+4) on the prostatectomy. Interestingly, 3 of these 7 patients were classified by the algorithm as high-grade prostate cancer, 2 as low-grade cancer and 2 as no-cancer. The number of cases with a change in GS classification is too small and did not statistically change the overall conclusion of the algorithms.
4. Discussion
Clearly sPSA is not reliable due to poor specificity. Though Bx remains the commonly used for evaluating the presence or absence of high-grade PCa, it is well established that biopsies, as compared with prostatectomy, have a tendency to underestimate the GS and even miss the presence of cancer.
Urine has been shown to contain biomarkers useful for determining the presence of PCa. In addition, peripheral blood derived plasma and serum contain biomarkers reflecting abnormal or neoplastic processes in various parts of the body. As detailed in Section 2.4, we developed algorithms for predicting the presence of, first, PCa and, second, high-grade PCa. However, we restricted our endpoint at this time to Bx results and prediction of Bx results [22]. In our research we followed the recommendation established by the REMARK group [23]. To assure power greater than 80%, especially in detecting patients with GS ≥7, we recruited more patients with cancer for our group. Furthermore, the patients were blindly divided into training and testing sets, simulating prospective studies.
The algorithms that we developed for predicting the presence of PCa and high-grade PCa both used few biomarkers (see Sections 3.4 and 3.5). The first model showed good sensitivity (76%) and specificity (78%). The sensitivity in the second model was low (50%), but specificity was excellent (81%). The reason for the low sensitivity is not clear; however, it is possibly due to the reliance on the Bx results in the training set, which used the results to predict the GS. We expected that a significant number of cases with biomarkers in urine and plasma would be consistent with high-grade GS if prostatectomy was used, but through Bx these were determined to be low grade. This lead to more tolerance for biomarker abnormalities as low-grade PCa. While our long-range plan is to use prostatectomy data and long-term follow up for definite classification, at this time we must rely on the Bx results.
To improve the reporting, we combined the two algorithms and considered patients with concordant positive or negative results based on both algorithms. This group comprised 63% of total patients (200 of 319). Interestingly, the sensitivity in this group of predicting GS ≥7 PCa was 77%, with 77% specificity, 57% PPV, and 89% NPV. However, the PPV was at 90% for predicting the presence of any PCa and NPV at 89% for predicting high-grade PCa.
The remaining patients with discordant results (37%) can reliably predict the presence or absence of PCa, with 76% sensitivity, 78% specificity, 87% PPV, and 63% NPV. However, we cannot reliably predict the presence of high-grade PCa in this group.
With long-term follow up and through the collection of prostatectomy data, we would be able to improve our algorithm by reclassifying patients for training and thus develop a reliable system based on biomarkers in urine and plasma. Our non-invasive approach and testing can provide a significantly improved system to determine whether to biopsy, assess the presence or absence of PCa, and evaluate the grade of this cancer in a majority of patients.
5. Conclusions
Using a panel of biomarkers in urine and plasma, we have developed a non-invasive approach to predict prostate Bx results. This model, which is based on using laboratory biomarkers and patient age, can be used as a “liquid biopsy” to reduce the need for tissue biopsies. Further studies have incorporated this model to clinical models such as the Prostate Cancer Prevention Trial risk calculator, which may provide a clinically very robust and practical approach for PCa screening and active surveillance.
Acknowledgements
The authors thank Benjamin Sampson for editorial help.
Author contributions
Wanlong Ma, Ferras Albitar,a Kevin Diep, and Maher Albitar were involved in generating the data and involved in data analysis. Wanlong Ma, Lars Lund, Herbert A. Fritsche, Neal Shore, and Maher Albitar developed the concept of the study and design.
Lars Lund and Neal Shore provided samples and patient data.
All authors were involved with and approved the manuscript.
Competing Interests
Wanlong Ma, Ferras Albitar, Kevin Diep, and Maher Albitar are employed by NeoGenomics Laboratories.
Lars Lund, Herbert A. Fritsche and Neal Shore: no financial conflict to disclose.
References
1. Ankerst DP, Boeck A, Freedland SJ, Jones JS, Cronin AM, Roobol MJ, Hugosson J, Kattan MW, Klein EA, Hamdy F, Neal D, Donovan J, Parekh DJ, Klocker H, Horninger W, Benchikh A, Salama G, Villers A, Moreira DM, Schröder FH, Lilja H, Vickers AJ, Thompson IM. Evaluating the Prostate Cancer Prevention Trial High Grade Prostate Cancer Risk Calculator in 10 international biopsy cohorts: results from the Prostate Biopsy Collaborative Group. World J Urol. 2014Feb;32(1):185-191
2. Guyon Isabelle, Herbert Fritsche Paul Choppa, Li-Ying Yang Stephen Barnhill. A Four-Gene Expression Signature for Prostate Cancer Cells Consisting of UAP1, PDLIM5, IMPDH2, and HSPD1. UroToday International Journal. 2009;2(4):3834-3844
3. Zietman A. Evidence-based medicine, conscience-based medicine, and the management of low-risk prostate cancer. J Clin Oncol. 2009;27(30):4935-4936
4. Thompson IM, Pauler DK, Goodman PJ. et al. Prevalence of prostate cancer among men with a prostate-specific antigen level < or = 4.0 ng per milliliter. N Engl J Med. 2004;350:2239-2246
5. De Kok JB, Verhaegh GW, Roelofs RW. et al. DD3 (PCA3), a very sensitive and specific marker to detect prostate tumors. Cancer Res. 2002;62:2695-2698
6. St John J, Powell K, Conley-Lacomb MK. et al. TMPRSS2-ERG fusion gene expression in prostate tumor cells and its clinical and biological significance in prostate cancer progression. J Cancer Sci Ther. 2012;4(4):94-101
7. Prensner JR, Rubin MA, Wei JT. et al. Beyond PSA: The next generation of prostate cancer biomarkers. Sci Transl Med. 2012;4:127rv3
8. Humphrey PA. Gleason grading and prognostic factors in carcinoma of the prostate. Med Pathol. 2004;17:292-306
9. Carter HB, Partin AW, Walsh PC. et al. Gleason Score 6 adenocarcinoma: should it be labeled as cancer? J Clin Oncol. 2012;30(35):4294-4296
10. Ma W, Diep K, Fritsche HA. et al. Diagnostic and prognostic scoring system for prostate cancer using urine and plasma biomarkers. Genet Test Mol Biomarkers. 2014;18(3):156-63
11. De Velasco MA, Uemura H. Preclinical remodeling of human prostate cancer through the PTEN/AKT pathway. Adv Urol. 2012;2012:1-12
12. Suzuki H, Freije D, Nusskern DR. et al. Interfocal heterogeneity of PTEN/MMAC1 gene alteration sin multiple metastatic prostate cancer tissues. Cancer Res. 1998;58:204-9
13. Yoshimoto M, Cunha IW, Coudry RA. et al. FISH analysis of 107 prostate cancers shows that PTEN genomic deletion is associated with poor clinical outcome. Br J Cancer. 2007;97:678-85
14. Li Y, Gao Y, Xu Y. et al. si-RNA-Mediated Knockdown of PDLIM5 Suppresses Gastric Cancer Cell Proliferation in Vitro. Chem Biol Drug Des. 2014 doi: 10.1111/cbdd.12428
15. Donovan MJ, Osman I, Khan FM. et al. Androgen receptor expression is associated with prostate cancer-specific survival in castrate patients with metastatic disease. BJU Int. 2010;105(4):462-67
16. Taylor BS, Schultz N, Hieronymus H. et al. Integrative genomic profiling of human prostate cancer. Cancer Cell. 2010;18(1):11-22
17. Phin S, Moore MW, Cotter PD. Genomic rearrangements of PTEN in prostate cancer. Front Oncol. 2013;3:240
18. Jhaver A, Reid A, Clark J. et al. Detection of TMPRSS2-ERG translocations in human prostate cancer by expression profiling using GeneChip Human Exon 1.0 ST arrays. J Mol Diagnon. 2008;10(1):50-7
19. Bismar TA, Yoshimoto M, Vollmer RT. et al. PTEN genomic deletion is an early even associated with ERG gene rearrangements in prostate cancer. BJU Int. 2011;107(3):477-85
20. Krohn A, Diedler T, Burkhardt L. et al. Genomic deletion of PTEN is associated with tumor progression and early PSA recurrence in ERG fusion-positive and fusion-negative prostate cancer. Am J Pathol. 2012;181(2):401-12
21. Epstein JI, Allsbrook WC Jr, Amin MB. et al. Update on the Gleason grading system for prostate cancer: Results of an international consensus conference of urologic pathologists. Adv Anat Pathol. 2006;13(1):57-9
22. Carter HB, Partin AW, Walsh PC, Trock BJ, Veltri RW, Nelson WG, Coffey DS, Singer EA, Epstein JI. Gleason score 6 adenocarcinoma: should it be labeled as cancer? J Clin Oncol. 2012;30(35):4294-6
23. McShane LM, Altman DG, Sauerbrei W, Taube SE, Gion M, Clark GM. REporting recommendations for tumor MARKer prognostic studies (REMARK). Nature Clinical Practice Oncology. 2005;2(8):416-422
Author contact
![]() Corresponding author: Maher Albitar, MD. NeoGenomics Laboratories; 5 Jenner, Ste 100; Irvine, CA 92618; Phone: (949) 275-7564 Fax: (949) 206-1865t e-mail: maheralbitarcom.
Corresponding author: Maher Albitar, MD. NeoGenomics Laboratories; 5 Jenner, Ste 100; Irvine, CA 92618; Phone: (949) 275-7564 Fax: (949) 206-1865t e-mail: maheralbitarcom.