Impact Factor ISSN: 1837-9664

 Global reach, higher impact
J Cancer 2016; 7(4):477-483. doi:10.7150/jca.13870 This issue Cite
Research Paper
Serum Unsaturated Free Fatty Acids: A Potential Biomarker Panel for Early-Stage Detection of Colorectal Cancer
Yaping Zhang1, Chengyan He2, Ling Qiu3, Yanmin Wang4, Xuzhen Qin3, Yujie Liu1, Zhili Li1 ![]()
1. Department of Biophysics and Structural Biology, Institute of Basic Medical Sciences, Chinese Academy of Medical Sciences & School of Basic Medicine, Peking Union Medical College, Beijing, China;
2. Clinical Lab Diagnosis, China-Japan Union Hospital, Jilin University, Changchun, China;
3. Department of Clinical Laboratory, Peking Union Medical College Hospital, Chinese Academy of Medical Sciences & Peking Union Medical College, Beijing, China;
4. Department of Clinical Laboratory, Heze Municipal Hospital, Heze, China.
Received 2015-9-16; Accepted 2015-12-3; Published 2016-1-29
Abstract
Background: To screen biomarkers to differentiate early-stage colorectal cancer (CRC) from benign colorectal disease (BCD) and healthy controls.
Materials & Methods: Quantitative and qualitative analysis of C16:1, C18:3, C18:2, C18:1, C20:4, and C22:6 in 185 healthy controls, 55 patients with BCD, and 139 patients with CRC was performed. Comparisons of their levels in between CRC patients, BCD patients, and healthy controls were performed using Mann-Whitney U test.
Results: Serum levels of C16:1, C18:3, C18:2, C18:1, C20:4, and C22:6 in CRC patients were significantly decreased compared with healthy controls and BCD patients. A combination of C16:1, C18:2, C20:4, and C22:6 has excellent diagnostic performance to differentiate early-stage CRC patients from healthy controls plus BCD patients, with an AUC of 0.926, a sensitivity of 84.6%, and a specificity of 89.8%.
Conclusions: Serum levels of C16:1, C18:2, C20:4, and C22:6 could be diagnostic indicators of early-stage CRC patients.
Keywords: unsaturated free fatty acids, biomarker panel, early detection, serum, colorectal cancer.
Introduction
Colorectal cancer (CRC) is the third most common cancer and the fifth most frequent cause of cancer deaths in China [1]. Clinical data show that 5-year survival rate of early-stage CRC postoperative patients is around 90% [2]. However, most of CRC patients were diagnosed at advanced-stage due to its asymptomatic and poor diagnostic techniques. Early screening is an effective way to reduce the morbidity and mortality [3]. Colonoscopy is a primary screening tool for diagnosing CRC because of its excellent diagnostic accuracy. However, invasive nature limits its effectiveness. The fecal occult blood test is an economical, noninvasive, and widely available screening method for diagnosing CRC, with low sensitivity [4, 5]. Stool DNA test [6] has better sensitivity and specificity than the fecal occult blood test, but the high cost has limited its use. Fecal immunochemical test is more sensitive in detecting both CRC and adenomas than the fecal occult blood test, with the sensitivities of 25% to 100% and the specificities of >90% [7]. So, it is necessary to develop low-cost, less invasive, high-sensitivity, and high-specificity screening methods for early diagnosis of CRC.
Cancer involves in numerous metabolic pathways such as glycolysis and tricarboxylic acid cycle [8]. Recent studies have shown that metabolite profile could be a diagnostic tool to differentiate CRC from healthy controls [9, 10], but most of these studies failed to quantify the levels of metabolites and to evaluate their diagnostic accuracies to detect CRC. Study on cancer cells also displayed specific changes in varied facets of lipid metabolism [11]. As the main source of energy in body, free fatty acids (FFAs) are the vital substrates for lipid synthesis, which could better interpret the mechanisms of disease and physiological processes. Unsaturated FFAs provide a large energy during cellular proliferation which is closely associated with malignancy [12]. Previous studies mainly focused on the effects of dietary unsaturated fatty acids on cancer cells, which still remains controversial [13]. Our previous study has indicated that the level ratios of serum C18:2/C18:1 and C18:3/C18:1 have excellent diagnostic ability to differentiate early-stage pancreatic cancer from pancreatitis plus controls, with an area under receiver operating characteristic (ROC) curve (AUC) of 0.912, a sensitivity of 86.7%, and a specificity of 88.6%, and that the panel of C16:1, C18:3, C18:2, C18:1, C20:4, and C22:6 has excellent diagnostic ability to differentiate advanced-stage pancreatic cancer from controls plus pancreatitis, with an AUC value of 0.989, a sensitivity of 91.7%, and a specificity of 98.6% [14] and to differentiate early-stage breast cancer from healthy controls, with an AUC value of 0.953, a sensitivity of 83.3%, and a specificity of 87.1% [15]. Our previous studies have also found that serum FFA levels are closely correlated with lung cancer[16] and gastric cancer[17].
In this study, we performed simultaneous quantitative and qualitative analysis of serum C16:1, C18:3, C18:2, C18:1, C20:4, and C22:6 in 379 participants using chip-based direct-infusion nanoESI-Fourier transform ion cyclotron resonance mass spectrometry (CBDInanoESI-FTICR MS) in the negative ion mode. The linearity and stability test were performed to evaluate feasibility of the platform. The results indicate that a combination of C16:1, C18:2, C20:4, and C22:6 has excellent diagnostic accuracy for differentiating early-stage CRC patients from healthy controls plus patients with BCDs, with an AUC value of 0.926, a sensitivity of 84.6%, and a specificity of 89.8%.
Materials & methods
Chemicals & reagents
HPLC-grade methanol, ethanol, and acetonitrile were supplied by Fisher Scientific (Pittsburg, PA, USA). The ultrapure water was purified by a Milli-Q system (Millipore, USA). Palmitoleic acid (C16:1), heptadecenoic acid (C17:1), linolenic acid (C18:3), linoleic acid (C18:2), oleic acid (C18:1), arachidonic acid (C20:4), heneicosanoic acid (C21:0), docosahexaenoic acid (C22:6), and ammonium acetate (all with purity of > 99%, except C22:6, purity of > 98%) were purchased from Sigma-Aldrich Chemicals (St. Louis, MO, USA).
Participants and study design
139 CRC patients were recruited from China-Japan Union Hospital (n=59) and Peking Union Medical College Hospital (n=80). Evaluations of hematochemical parameters were performed in both hospitals. Tumors were further classified into early stage (stage I or II, n = 39) and advanced stage (stage III or IV, n = 75) based on the Union for International Cancer Control (UICRC) tumor-node metastasis (TNM) classification. 55 BCD patients were from Peking Union Medical College Hospital. 185 healthy controls were enrolled from Heze Municipal Hospital (n=69) and China-Japan Union Hospital (n=116), and clinical records were reviewed to make sure that these individuals were in health status. All samples were remaining sera after the clinical laboratory examination which were drawn in the morning after about 10 hours overnight fast without bowel preparation. The investigation was divided into a training study and a validation study. CRC patients (n=59) from China-Japan Union Hospital and the age- and gender- matched healthy controls (n=69) from Heze Municipal Hospital were included in the training set. Other 80 CRC patients and 55 BCD patients from Peking Union Medical College Hospital and 116 healthy controls from China-Japan Union Hospital were included in the validation set. The characteristics of all participants are summarized in Table 1. The study was approved by the Ethics Review Board at the Institute of Basic Medical Sciences, Chinese Academy of Medical Sciences.
Characteristics of participants in the study.
| Training Set | Validation Set | |||||
|---|---|---|---|---|---|---|
| Controls (n=69) | CRC (n=59) | Controls (n=116) | BCD (n=55) | CRC (n=80) | ||
| Male/Female | 36/33 | 34/25 | 72/44 | 34/21 | 36/44 | |
| Age(years) Mean± SD | 57.9±10.4 | 59.1±11.4 | 58.9±10.4 | 58.2±10.9 | 59.5±10.3 | |
| Range | 35-73 | 34-75 | 42-78 | 42-77 | 42-78 | |
| Stage Ⅰ& Ⅱ(Early Stage) | 1/3 | 21/14 | ||||
| Ⅲ & Ⅳ(Advanced Stage) | 23/15 | 23/14 | ||||
SD: standard deviation; CRC: colorectal cancer; BCD: benign colorectal disease.
Standard solutions and sample preparation
Standard solutions were prepared as our own previous study [14]. Briefly, C17:1 and C21:0 were used as internal standards (ISs) at the final concentrations of 83.3 nM and 33.3 nM in ethanol. The standard solutions used for generating the calibration curves were prepared by mixing C16:1, C18:3, C18:2, C18:1, C20:4, and C22:6 at six different concentrations in ethanol, along with the fixed concentrations of ISs (83.3 nM C17:1 and 33.3 nM C21:0). Six different concentrations are as follows: the first mixture: 684.0 nM C16:1, 163.3 nM C18:3, 1137.7 nM C18:2, 1671.7 nM C18:1, 365.7 nM C20:4, and 112.3 nM C22:6; the second: 342.0 nM C16:1, 81.7 nM C18:3, 568.8 nM C18:2, 835.8 nM C18:1, 182.8 nM C20:4, and 56.2 nM C22:6; the third: 68.4 nM C16:1, 16.3 nM C18:3, 113.8 nM C18:2, 167.2 nM C18:1, 36.6 nM C20:4, and 11.2 nM C22:6; the fourth: 34.2 nM C16:1, 8.2 nM C18:3, 56.9 nM C18:2, 83.6 nM C18:1, 18.3 nM C20:4, and 5.6 nM C22:6; the fifth: 13.7 nM C16:1, 3.3 nM C18:3, 22.8 nM C18:2, 33.4 nM C18:1, 7.3 nM C20:4, and 2.3 nM C22:6; and the sixth: 8.6 nM C16:1, 2.0 nM C18:3, 14.2 nM C18:2, 20.9 nM C18:1, 4.6 nM C20:4, and 1.4 nM C22:6. Each of these mixtures was analyzed three times, and the results are expressed as mean ± standard deviation (SD). The calibration equations were constructed between the concentration ratios of fatty acids to ISs (C16:1, C18:3, C18:2, C18:1 to C17:1 and C20:4, C22:6 to C21:0) and their respective corresponding intensity ratios. The third mixture was selected as quality control sample to evaluate the experimental stability. The quality control sample was analyzed once every 10 test samples. Relative SD was calculated based on the intensity ratios of C16:1, C18:3, C18:2, or C18:1 to C17:1 and C20:4 or C22:6 to C21:0, respectively.
Sample preparation was also performed as our own previous study[14]. Briefly, 50 µL of each serum sample was spiked with 950 µL of methanol/acetonitrile (3/2, v/v) to precipitate serum proteins. The resulting mixture was vortexed for 30 s and then stored at -20 °C overnight. After the mixture was centrifuged at 19000 g for 30 min at 4 °C, the supernatant was transferred into a new tube. Accurate pipetting of the above supernatant of 20 µL was mixed with 1µL of the ISs solution, 500 µL of hexane, and 500 µL of water, and then the resulting solution was vortexed and centrifuged at 1500 g for 10 min. After the centrifugation, top layer was transferred to another vial and air-dried. The dried residue was re-dissolved in 1 mL of methanol/acetonitrile/5 mM ammonium acetate (42/28/30, v/v/v) for analysis.
Mass Spectrometry
Extracted FFAs were analyzed using a 9.4 T Apex-ultra™ hybrid Qh-FTICR MS (Bruker Daltonics, Billerica, MA, USA) equipped with a NanoMate system (Advion BioSciences, Ithaca, NY, USA) in the negative ion mode. 0.1 µL of the sample followed by 0.5 µL of air was introduced directly into the nanoESI source, with a voltage of -1.8 kV and a head pressure of 0.7 psi at a flow rate of 100 nL/min. Each spectrum was accumulated 10 full scans over the mass range of 150-400 Da and the resolution was 200,000 at m/z 400. A mixture of C15:0 (molecular weight = 242.22458 Da), C17:0 (270.25588 Da), and C21:0 (326.31848 Da) was employed to calibrate the instrument before analysis.
Serum unsaturated FFAs in this study were identified on the basis of their observed accurate molecular masses and reliable isotope distributions detected by FTICR MS. Their mass error was ≤ 0.00025 Da and the relative intensity error of their isotopic peaks was < 2%. For the missing levels of unsaturated FFAs, the baseline intensity in each spectrum was adopted for the following statistical analysis.
Statistical analysis
Comparisons of the levels of these unsaturated FFAs between healthy controls, patients, and patients with different CRC stages in the training study or the validation study were performed by Mann-Whitney U test. Significantly changed unsaturated FFAs were subjected to ROC analysis. The AUC, sensitivity, and specificity were calculated to evaluate the diagnostic ability. All statistical analyses were performed by SPSS software (version 16.0, Chicago, IL, USA). The results are expressed as mean ± SD. p values of <0.05 were considered to be statistically significant.
Results
Simultaneous qualitative and quantitative analysis of serum FFAs
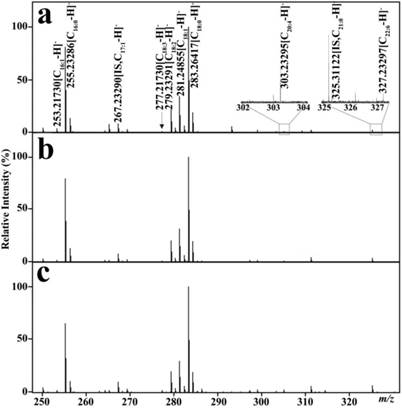
As shown in Table 2, the calibration equations of C16:1, C18:3, C18:2, C18:1, C20:4, and C22:6 were constructed with correlation coefficients (R2) of >0.99 on the basis of their mixture standard working solutions. 39 mass spectra of the quality control sample were analyzed with relative SD of <16% for each analyte, indicating that the experimental reproducibility is acceptable for complex biological samples. Representative mass spectra of serum FFAs in one healthy control, one BCD patient, and one CRC patient are shown in Fig. 1. The levels of these six unsaturated FFAs were calculated on the basis of their respective corresponding calibration equations listed in Table 2. These unsaturated FFAs were identified via comparing the observed accurate molecular masses and reliable isotope distributions with their respective theoretical values, with the absolute mass error of ≤ 0.00025 Da and the relative intensity error of their isotopic peaks of < 2%.
Calibration equations, correlation coefficient (R2), and experimental stability.
| FAs | Linearity (n=3) | QC (%) | ||
|---|---|---|---|---|
| FA (nM) | Equation | R2 | ||
| C16:1 | 8.5-684.0 | Y=0.518(±0.028)X+0.161(±0.030) | 0.996 | <16 |
| C18:3 | 2.0-163.5 | Y=1.365(±0.195)X-0.054(±0.043) | 0.993 | <12 |
| C18:2 | 14.2-1138.0 | Y=1.521(±0.072)X+0.121(±0.099) | 0.996 | <12 |
| C18:1 | 20.9-1672.0 | Y=1.646(±0.032)X+1.249(±0.076) | 0.994 | <16 |
| C20:4 | 4.6-366.0 | Y=3.164(±0.100)X-0.350(±0.298) | 0.997 | <12 |
| C22:6 | 1.4-112.3 | Y=2.006(±0.208)X-0.016(±0.008) | 0.995 | <13 |
X: Concentration ratios of individual fatty acids to ISs (83.3 nM C17:1 and 33.3 nM C21:0); Y: respective corresponding intensity ratios of fatty acids to ISs; QC: quality control.
Representative mass spectra of serum FFAs from one healthy control (a), one BCD patient (b), and one CRC patients (c) in the negative ion mode.
Comparison of changes in the levels of FFAs between healthy controls and patients
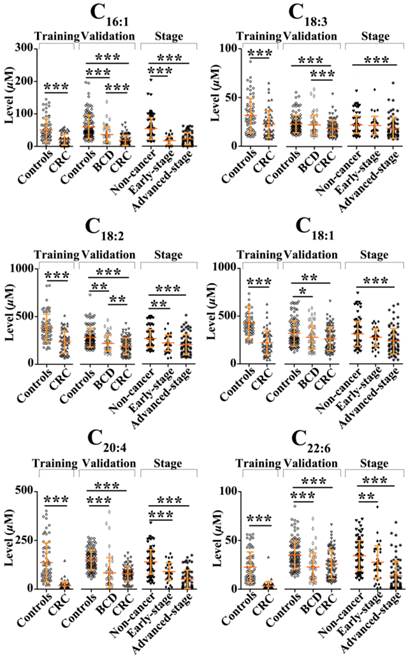
In the training study, Mann-Whitney U test indicated that the levels of C16:1, C18:3, C18:2, C18:1, C20:4, and C22:6 in CRC patients were significantly decreased compared with healthy controls (p < 0.001). Their scatter plots are shown in Fig. 2. As shown in Table 3, monounsaturated free fatty acids (MUFFA, i.e., C16:1 and C18:1), polyunsaturated free fatty acids (PUFFA, i.e., C18:3, C18:2, C20:4, and C22:6), and panel a (a combination of C16:1, C18:3, C18:2, C18:1, C20:4, and C22:6) displayed good diagnostic ability to differentiate CRC patients from healthy controls, with the AUC values of > 0.90, the sensitivities of > 81%, and the specificities of > 82%. Representative ROC curve for panel a is shown in Fig. 3A.
Scatter plots of serum levels of C16:1, C18:3, C18:2, C18:1, C20:4, and C22:6 in the training set, the validation set, and different CRC stages. *, p< 0.05; **, p< 0.01; ***, p< 0.001.
The AUC values, cut-off values, sensitivity, and specificity of significantly changed unsaturated FFAs between controls and patients.
| FFAs | Training set | cut- off | Validation set | ||||||||||||||
|---|---|---|---|---|---|---|---|---|---|---|---|---|---|---|---|---|---|
| Controls vs. CRC | Controls vs. CRC | Controls vs. BCD | BCD vs. CRC | ||||||||||||||
| AUC (95% CI) | Sens (%) | Spec (%) | AUC (95% CI) | Sens (%) | Spec (%) | AUC (95% CI) | Sens (%) | Spec (%) | cut- off | AUC (95% CI) | Sens (%) | Spec (%) | cut- off | ||||
| C16:1 | 0.790(.714-.867) | 79.7 | 55.9 | 20.7 | 0.907(.865-.949) | 95.7 | 70.7 | 0.732(.650-.813) | 73.3 | 67.3 | 38.7 | 0.776(.699-.852) | 72.7 | 70.0 | 20.7 | ||
| C18:3 | 0.664(.571-.758) | 92.8 | 25.4 | 11.4 | 0.661(.582-.740) | 99.1 | 21.2 | 0.610(.515-.705) | 98.2 | 21.2 | 11.4 | ||||||
| C18:2 | 0.790(.713-.868) | 98.6 | 30.5 | 160.4 | 0.753(.681-.825) | 97.4 | 42.5 | 0.701(.612-.789) | 64.7 | 69.1 | 240.6 | 0.602(.507-.696) | 72.7 | 42.5 | 160.4 | ||
| C18:1 | 0.878(.816-.940) | 98.6 | 57.6 | 208.6 | 0.622(.539-.704) | 81.0 | 43.8 | 0.599(.505-.692) | 66.4 | 52.7 | 247.2 | ||||||
| C20:4 | 0.963(.933-.993) | 46.4 | 98.3 | 113.6 | 0.865(.815-.915) | 74.1 | 83.8 | 0.845(.769-.921) | 79.3 | 81.8 | 107.2 | ||||||
| C22:6 | 0.973(.944-.999) | 26.1 | 98.3 | 32.0 | 0.686(.607-.764) | 50.0 | 70.0 | 0.757(.674-.841) | 81.0 | 61.8 | 23.0 | ||||||
| MUFFA | 0.908(.854-.962) | 81.4 | 87.0 | 0.6 | 0.914(.874-.954) | 75.0 | 90.5 | 0.735 (.654-.816) | 72.7 | 66.4 | 0.4 | ||||||
| PUFFA | 0.976(.951-1.001) | 98.3 | 82.6 | 0.3 | 0.904(.860-.948) | 87.5 | 73.3 | ||||||||||
| Panel a | 0.980(.959-1.000) | 94.9 | 88.4 | 0.4 | 0.981(.966-.996) | 93.8 | 92.2 | ||||||||||
| Panel b | 0.823(.750-.896) | 74.5 | 88.8 | 0.4 | |||||||||||||
| Panel c | 0.779(.702-.855) | 70.0 | 81.8 | 0.7 | |||||||||||||
Note: CRC: colorectal cancer; BCD: benign colorectal diseases; Sens: sensitivity; Spec: specificity; MUFFA: monounsaturated free fatty acid; PUFFA: polyunsaturated free fatty acid; Panel a: C16:1, C18:3, C18:2, C18:1, C20:4, and C22:6; Panel b: C16:1, C18:2, C18:1, C20:4, and C22:6; Panel c: C16:1, C18:3, and C18:2.
Representative ROC curves of different biomarker panels. (A) the panel a (a combination of C16:1, C18:3, C18:2, C18:1, C20:4, and C22:6) differentiates CRC patients from healthy controls in the training set. (B) the panel a differentiates CRC patients from healthy controls in the validation set. (C) the panel b (a combination of C16:1, C18:2, C18:1, C20:4, and C22:6) differentiates BCD patients from healthy controls. (D) The panel c (a combination of C16:1, C18:3, and C18:2) differentiates CRC patients from BCD patients. (E) The panel d (a combination of C16:1, C18:2, C20:4, and C22:6) differentiates early-stage CRC patients from non-cancer participants (healthy controls plus BCD patients). (F) the biomarker panel a differentiates advanced-stage CRC patients from non-cancer participants.
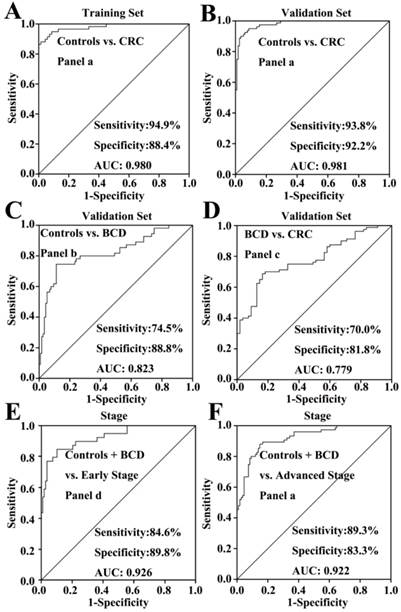
To validate the above-mentioned findings, we further performed an independent validation study, including 55 BCD patients, 80 CRC patients, and 116 healthy controls. ROC analysis indicated that C16:1, C20:4, MUFFA, PUFFA, and panel a had high diagnostic ability to differentiate CRC patients from healthy controls, with the AUC values of >0.86, the sensitivities of >74%, and the specificities of >70%. Representative ROC curve for panel a is shown in Fig. 3B.
We also performed the comparisons between healthy controls, BCD patients, and CRC patients using Mann-Whitney U test. Statistical results indicate that significant decrease in the levels of C16:1, C18:2, C18:1, C20:4, and C22:6 in BCD patients or CRC patients were observed compared with healthy controls (p < 0.05). It should be noted that the levels of C16:1, C18:2, and C18:3 in BCD patients were significantly increased compared with CRC patients (p < 0.01). ROC analysis indicated that only C20:4 and panel b (a combination of C16:1, C18:2, C18:1, C20:4, and C22:6) has high diagnostic ability to differentiate BCD patients from healthy controls, with the AUC values of > 0.82. Representative ROC curve for panel b is shown in Fig. 3C. It is worth noting that panel c (a combination of C16:1, C18:3, and C18:2) has high diagnostic ability to differentiate BCD patients from CRC patients, with the AUC of 0.78, the sensitivity of 70%, and the specificity of 81%. Representative ROC curve for panel c is shown in Fig. 3D.
Association of changes in the levels of FFAs with CRC stages
Comparisons of non-cancer participants (healthy controls plus BCD patients) with different stages of CRC showed that significant decrease in the levels of FFAs was observed in both early-stage patients (except C18:1 and C18:3) and advanced-stage patients (p < 0.01, Fig. 2). ROC analysis showed that panel d (a combination of C16:1, C18:2, C20:4, and C22:6) and panel a provide excellent diagnostic performance to differentiate early-and advanced-stage patients from non-cancer participants, respectively, with the AUC values of >0.92, the sensitivities of > 84%, and the specificities of >83% (Table 4). ROC curves for panels d and a are shown in Fig. 3E-F, respectively.
The AUC values, cut-off values, sensitivity and specificity of significantly changed unsaturated FFAs between controls plus BCD patients and CRC patients with different stages.
| FFAs | Controls plus BCD vs. Early stage | Controls plus BCD vs. Advanced stage | |||||
|---|---|---|---|---|---|---|---|
| AUC (95% CI) | Sens (%) | Spec (%) | Cut- off | AUC (95% CI) | Sens (%) | Spec (%) | |
| C16:1 | 0.906 (.851-.960) | 95.4 | 71.8 | 20.7 | 0.820 (.757-.883) | 95.4 | 56.0 |
| C18:3 | 11.4 | 0.655 (.569-.742) | 88.9 | 46.7 | |||
| C18:2 | 0.730 (.622-.838) | 93.5 | 30.8 | 160.4 208.6 | 0.703 (.621-.785) | 84.3 | 50.7 |
| C18:1 | 0.690 (.608-.772) | 83.3 | 54.7 | ||||
| C20:4 | 0.766 (.672-.811) | 64.8 | 76.9 | 113.6 | 0.874 (.825-.923) | 75.0 | 81.3 |
| C22:6 | 0.626 (.522-.729) | 50.9 | 69.2 | 32.0 | 0.852 (.791-.913) | 81.5 | 74.7 |
| MUFFA | 0.6 | 0.821 (.759-.883) | 58.7 | 93.5 | |||
| PUFFA | 0.785 (.704-.866) | 66.7 | 82.4 | 0.3 | 0.877 (.828-.926) | 70.7 | 89.8 |
| Panel a | 0.4 | 0.922 (.883-.961) | 89.3 | 83.3 | |||
| Panel d | 0.926 (.876-.975) | 84.6 | 89.8 | 0.4 | |||
Note: CRC: colorectal cancer; BCD: benign colorectal diseases; MUFFA: monounsaturated free fatty acid; PUFFA: polyunsaturated free fatty acid; Panel a: C16:1, C18:3, C18:2, C18:1, C20:4, and C22:6; Panel d: C16:1, C18:2, C20:4, and C22:6.
Discussion
In the present study, we employed CBDInanoESI-FTICR MS platform to perform simultaneous quantitative and qualitative analysis of six serum unsaturated FFAs in 379 participants, with high throughput. Compared with liquid chromatography or gas chromatography coupled to MS, this CBDInanoESI-FTICR MS strategy is less time-consuming, with about 30 seconds per sample. As shown in Fig. 2, significant decrease in the levels of C16:1, C18:3, C18:2, C18:1, C20:4, and C22:6 was observed in CRC patients in both the training and validation study, which are not totally and positively correlated with those in CRC tissues. Previous study showed a decrease in the levels of C18:3 and C18:2 and a increase in the levels of C18:1 and C20:4 in human CRC tissues [18]. These change trends between serum and tissue may be due to renal and/or hepatic clearance, which play important roles in the metabolites [19]. Significant decrease in the levels of C14:0, C15:0, C18:3, and C18:0 and increase in the levels of C24:0, C25:0, C26:0, C28:0, and C30:0 in CRC patients were also observed compared with healthy controls [20]. Recent tissue study showed that significant decrease in the levels of C16:1 and C18:1 in CRC tissue were also observed compared with adjacent normal tissue [21], suggesting that these fatty acids may involve in colorectal cancer. It was found that C18:2, C18:1, and C16:1 could induce the generation of lipid droplets and trigger efficient lipid droplet accumulation in melanoma cells [22]. Previous prospective studies have also showed that unsaturated fatty acids inhibited some mechanism pathways in colorectal carcinogenesis [21, 23, 24]. In addition, the associations between PUFFA intake and risk of CRC remains inconclusive. Some epidemiological studies suggested that consumption of n-3 PUFFA or lower ratio of n-6 to n-3 fatty acids may decrease CRC risk [25-27]. However, recent study showed that that there were no statistically significant associations between CRC risk and dietary intake of any of the vitamins, minerals or essential fatty acids [28].
Statistically significant decrease in the levels of C16:1, C18:2, C18:1, C20:4, and C22:6 were observed in BCD patients compared with healthy controls, and significant increase in the levels of C16:1, C18:3, and C18:2 in BCD patients were detected compared with CRC patients. ROC analysis showed that panel b can discriminate BCD patients from healthy controls, with the AUC value of 0.823, the sensitivity of 74.5%, and the specificity of 88.8%. More importantly, panel c has excellent diagnostic accuracy to differentiate CRC patients from BCD patients, with the AUC value of 0.779, the sensitivity of 70.0%, and the specificity of 81.8%. It is worth noting that panels a and d have shown excellent diagnostic ability to differentiate advanced-stage and early -stage CRC from non-cancer participants, respectively, with the AUC values of>0.92, the sensitivities of>84%, and the specificities of>83%, which are the similar to or better than other tumor biomarkers, such as lipid profiling [29], the combination of 2-hydroxybutyrate, aspartic acid, kynurenine and cystamine [30], the serum dermokine level [31], the methylation of serum NEUROG1 [32], and the combination of 3 protein mass peaks for discriminating CRC, BCD, and healthy controls with accuracy of >80% [33].
Conclusions
In this study, we used CBDInanoESI-FTICR MS platform to perform the simultaneously quantitative and qualitative analysis of multiple targeted serum unsaturated FFAs with high resolution, high mass accuracy, and high throughput. Change trends in the levels of serum unsaturated FFAs in all participants including 185 healthy controls, 55 BCD patients, and 139 CRC patients were closely correlated with the pathological status of participants. A combination of C16:1, C18:2, C20:4, and C22:6 as a biomarker panel has shown excellent diagnostic ability to differentiate early-stage CRC from healthy controls plus BCD. It is worth noting that the development of colorectal diseases are accompanied with decreased levels of serum unsaturated FFAs, indicating that the detection of serum unsaturated FFAs might have important clinical significance for early detection of CRC.
Acknowledgements
This study was supported by the National Natural Science Foundation of China (Grant no. 91542101) to Z. Li.
Competing Interests
All authors disclose any affiliations that are consideration to be relevant and important with any organization that to our knowledge has any direct interest in the subject matter discussed.
References
1. Wang F, Wang FH, Bai L, Xu RH. Role of capecitabine in treating metastatic colorectal cancer in Chinese patients. Onco Targets Ther. 2014;7:501-511
2. Labianca R, Beretta GD, Mosconi S, Milesi L, Pessi MA. Colorectal cancer: screening. Ann Oncol. 2005;16(Suppl 2):ii127-132
3. Mahabaleshwarkar R, Khanna R, West-Strum D, Yang Y. Association Between Health-Related Quality of Life and Colorectal Cancer Screening. Popul Health Manag. 2013;16:178-189
4. Lansdorp-Vogelaar I, Knudsen AB, Brenner H. Cost-effectiveness of colorectal cancer screening. Epidemiol Rev. 2011;33:88-100
5. Levin B, Lieberman DA, McFarland B, Andrews KS, Brooks D, Bond J, Dash C, Giardiello FM, Glick S, Johnson D, Johnson CD, Levin TR, Pickhardt PJ, Rex DK, Smith RA, Thorson A, Winawer SJ. Screening and surveillance for the early detection of colorectal cancer and adenomatous polyps, 2008: a joint guideline from the American Cancer Society, the US Multi-Society Task Force on Colorectal Cancer, and the American College of Radiology. Gastroenterol. 2008;134:1570-1595
6. Itzkowitz S, Brand R, Jandorf L, Durkee K, Millholland J, Rabeneck L, Schroy PC, Sontag S, Johnson D, Markowitz S, Paszat L, Berger BM. A Simplified, Noninvasive Stool DNA Test for Colorectal Cancer Detection. Am J Gastroenterol. 2008;103:2862-2870
7. Lee JK, Liles EG, Bent S, Levin TR, Corley DA. Accuracy of Fecal Immunochemical Tests for Colorectal Cancer Systematic Review and Meta-analysis. Ann Intern Med. 2014;160:171-181
8. Seyfried TN, Flores RE, Poff AM, D'Agostino DP. Cancer as a metabolic disease: implications for novel therapeutics. Carcinogenesis. 2014;35:515-527
9. Tan B, Qiu Y, Zou X, Chen T, Xie G, Cheng Y, Dong T, Zhao L, Feng B, Hu X, Xu LX, Zhao A, Zhang M, Cai G, Cai S, Zhou Z, Zheng M, Zhang Y, Jia W. Metabonomics identifies serum metabolite markers of colorectal cancer. J Proteome Res. 2013;12:3000-3009
10. Williams MD, Reeves R, Resar LS, Hill HH. Metabolomics of colorectal cancer: past and current analytical platforms. Anal Bioanal Chem. 2013;405:5013-5030
11. Santos CR, Schulze A. Lipid metabolism in cancer. Febs J. 2012;279:2610-2623
12. Huang Q, Tan Y, Yin P, Ye G, Gao P, Lu X, Wang H, Xu G. Metabolic characterization of hepatocellular carcinoma using nontargeted tissue metabolomics. Cancer Res. 2013;73:4992-5002
13. Serini S, Piccioni E, Merendino N, Calviello G. Dietary polyunsaturated fatty acids as inducers of apoptosis: implications for cancer. Apoptosis. 2009;14:135-152
14. Zhang YP, Qiu L, Wang YM, Qin X, Li ZL. High-throughput and high-sensitivity quantitative analysis of serum unsaturated fatty acids by chip-based nanoelectrospray ionization-Fourier transform ion cyclotron resonance mass spectrometry: early stage diagnostic biomarkers of pancreatic cancer. Analyst. 2014;139:1697-1706
15. Zhang YP, Song LN, Liu N, He CY, Li ZL. Decreased serum levels of free fatty acids are associated with breast cancer. Clin Chim Acta. 2014;437:31-37
16. Zhang YP, He CY, Qiu L, Wang YM, Zhang L, Qin XZ, Liu YJ, Zhang D, Li ZL. Serum Unsaturated Free Fatty Acids: Potential Biomarkers for Early Detection and Disease Progression Monitoring of Non-Small Cell Lung Cancer. Journal of Cancer. 2014;5:706-714
17. Zhang YP, Qiu L, Wang YM, He CY, Qin XZ, Liu YJ, Li ZL. Unsaturated free fatty acids: a potential biomarker panel for early detection of gastric cancer. Biomarkers. 2014;19:667-673
18. Szachowicz-Petelska B, Sulkowski S, Figaszewski ZA. Altered membrane free unsaturated fatty acid composition in human colorectal cancer tissue. Mol Cell Biochem. 2007;294:237-242
19. Wang H, Tso VK, Slupsky CM, Fedorak RN. Metabolomics and detection of colorectal cancer in humans: a systematic review. Future Oncol. 2010;6:1395-1406
20. Kondo Y, Nishiumi S, Shinohara M, Hatano N, Ikeda A, Yoshie T, Kobayashi T, Shiomi Y, Irino Y, Takenawa T, Azuma T, Yoshida M. Serum fatty acid profiling of colorectal cancer by gas chromatography/mass spectrometry. Biomarkers in Medicine. 2011;5:451-460
21. Zhang J, Zhang L, Ye X, Chen L, Gao Y, Kang JX, Cai C. Characteristics of fatty acid distribution is associated with colorectal cancer prognosis. Prostaglandins Leukot Essent Fatty Acids. 2013;88:355-360
22. Ruiz-Vela A, Aguilar-Gallardo C, Martinez-Arroyo AM, Soriano-Navarro M, Ruiz V, Simon C. Specific unsaturated fatty acids enforce the transdifferentiation of human cancer cells toward adipocyte-like cells. Stem Cell Rev. 2011;7:898-909
23. Giros A, Grzybowski M, Sohn VR, Pons E, Fernandez-Morales J, Xicola RM, Sethi P, Grzybowski J, Goel A, Boland CR, Gassull MA, Llor X. Regulation of colorectal cancer cell apoptosis by the n-3 polyunsaturated fatty acids Docosahexaenoic and Eicosapentaenoic. Cancer Prev Res (Phila). 2009;2:732-742
24. Tjonneland A, Overvad K, Bergmann MM, Nagel G, Linseisen J, Hallmans G, Palmqvist R, Sjodin H, Hagglund G, Berglund G, Lindgren S, Grip O, Palli D, Day NE, Khaw KT, Bingham S, Riboli E, Kennedy H, Hart A. Linoleic acid, a dietary n-6 polyunsaturated fatty acid, and the aetiology of ulcerative colitis: a nested case-control study within a European prospective cohort study. Gut. 2009;58:1606-1611
25. Murff HJ, Shu XO, Li H, Dai Q, Kallianpur A, Yang G, Cai H, Wen W, Gao YT, Zheng W. A prospective study of dietary polyunsaturated fatty acids and colorectal cancer risk in Chinese women. Cancer Epidemiol Biomarkers Prev. 2009;18:2283-2291
26. Tokudome S, Kojima M, Suzuki S, Ichikawa H, Ichikawa Y, Miyata M, Maeda K, Marumoto M, Agawa H, Arakawa K, Tanaka T, Ando R, Hattori N, Goto C, Tokudome Y, Imaeda N, Kuriki K, Okuyama H, Moore MA. Marine n-3 fatty acids and colorectal cancer: is there a real link? Cancer Epidemiol Biomarkers Prev. 2006;15:406-407
27. Kuriki K, Wakai K, Hirose K, Matsuo K, Ito H, Suzuki T, Saito T, Kanemitsu Y, Hirai T, Kato T, Tatematsu M, Tajima K. Risk of colorectal cancer is linked to erythrocyte compositions of fatty acids as biomarkers for dietary intakes of fish, fat, and fatty acids. Cancer Epidemiol Biomarkers Prev. 2006;15:1791-1798
28. Key TJ, Appleby PN, Masset G, Brunner EJ, Cade JE, Greenwood DC, Stephen AM, Kuh D, Bhaniani A, Powell N, Khaw KT. Vitamins, minerals, essential fatty acids and colorectal cancer risk in the United Kingdom Dietary Cohort Consortium. Int J Cancer. 2012;131:E320-325
29. Li F, Qin XZ, Chen HQ, Qiu L, Guo YM, Liu H, Chen GQ, Song GG, Wang XD, Li FJ, Guo S, Wang BH, Li ZL. Lipid profiling for early diagnosis and progression of colorectal cancer using direct-infusion electrospray ionization Fourier transform ion cyclotron resonance mass spectrometry. Rapid Commu Mass Spectrom. 2013;27:24-34
30. Nishiumi S, Kobayashi T, Ikeda A, Yoshie T, Kibi M, Izumi Y, Okuno T, Hayashi N, Kawano S, Takenawa T, Azuma T, Yoshida M. A novel serum metabolomics-based diagnostic approach for colorectal cancer. PLoS One. 2012;7:e40459
31. Tagi T, Matsui T, Kikuchi S, Hoshi S, Ochiai T, Kokuba Y, Kinoshita-Ida Y, Kisumi-Hayashi F, Morimoto K, Imai T, Imoto I, Inazawa J, Otsuji E. Dermokine as a novel biomarker for early-stage colorectal cancer. J Gastroenterol. 2010;45:1201-1211
32. Herbst A, Rahmig K, Stieber P, Philipp A, Jung A, Ofner A, Crispin A, Neumann J, Lamerz R, Kolligs FT. Methylation of NEUROG1 in Serum Is a Sensitive Marker for the Detection of Early Colorectal Cancer. Am J Gastroenterol. 2011;106:1110-1118
33. Liu M, Li CF, Chen HS, Lin LQ, Zhang CP, Zhao JL, Liu Y, Zhang SJ, Jin JC, Wang L, Liu JR. Differential expression of proteomics models of colorectal cancer, colorectal benign disease and healthy controls. Proteome Sci. 2010;8:16
Author contact
![]() Corresponding author: Zhili Li, Department of Biophysics and Structural Biology, Institute of Basic Medical Sciences, Chinese Academy of Medical Sciences & School of Basic Medicine, Peking Union Medical College, 5 Dongdan San Tiao, Beijing 100005, P.R. China. Tel/Fax: +86-10-69156479; E-mail: lizhilipumc.edu.cn.
Corresponding author: Zhili Li, Department of Biophysics and Structural Biology, Institute of Basic Medical Sciences, Chinese Academy of Medical Sciences & School of Basic Medicine, Peking Union Medical College, 5 Dongdan San Tiao, Beijing 100005, P.R. China. Tel/Fax: +86-10-69156479; E-mail: lizhilipumc.edu.cn.