Impact Factor ISSN: 1837-9664

 Global reach, higher impact
J Cancer 2016; 7(6):702-710. doi:10.7150/jca.14208 This issue Cite
Research Paper
ARNT2 Regulates Tumoral Growth in Oral Squamous Cell Carcinoma
Yasushi Kimura1, Atsushi Kasamatsu2 ![]() , Dai Nakashima2, Masanobu Yamatoji2, Yasuyuki Minakawa1, Kazuyuki Koike2, Kazuaki Fushimi2, Morihiro Higo2, Yosuke Endo-Sakamoto2, Masashi Shiiba3, Hideki Tanzawa1,2, Katsuhiro Uzawa1,2
, Dai Nakashima2, Masanobu Yamatoji2, Yasuyuki Minakawa1, Kazuyuki Koike2, Kazuaki Fushimi2, Morihiro Higo2, Yosuke Endo-Sakamoto2, Masashi Shiiba3, Hideki Tanzawa1,2, Katsuhiro Uzawa1,2 ![]()
1. Department of Oral Science, Graduate School of Medicine, Chiba University, 1-8-1 Inohana, Chuo-ku, Chiba 260-8670, Japan;
2. Department of Dentistry and Oral-Maxillofacial Surgery, Chiba University Hospital, 1-8-1 Inohana, Chuo-ku, Chiba 260-8670, Japan;
3. Department of Medical Oncology, Graduate School of Medicine, Chiba University, 1-8-1 Inohana, Chuo-ku, Chiba 260-8670, Japan.
Received 2015-10-23; Accepted 2016-1-22; Published 2016-3-26
Abstract
Aryl hydrocarbon receptor nuclear translocator (ARNT) 2 is a transcriptional factor related to adaptive responses against cellular stress from a xenobiotic substance. Recent evidence indicates ARNT is involved in carcinogenesis and cancer progression; however, little is known about the relevance of ARNT2 in the behavior of oral squamous cell carcinoma (OSCC). In the current study, we evaluated the ARNT2 mRNA and protein expression levels in OSCC in vitro and in vivo and the clinical relationship between ARNT2 expression levels in primary OSCCs and their clinicopathologic status by quantitative reverse transcriptase-polymerase chain reaction, immunoblotting, and immunohistochemistry. Using ARNT2 overexpression models, we performed functional analyses to investigate the critical roles of ARNT2 in OSCC. ARNT2 mRNA and protein were down-regulated significantly (P < 0.05 for both comparisons) in nine OSCC-derived cells and primary OSCC (n=100 patients) compared with normal counterparts. In addition to the data from exogenous experiments that ARNT2-overexpressed cells showed decreased cellular proliferation, ARNT2-positive OSCC cases were correlated significantly (P < 0.05) with tumoral size. Since von Hippel-Lindau tumor suppressor, E3 ubiquitin protein ligase, a negative regulator of hypoxia-inducible factor (HIF1)-α, is a downstream molecule of ARNT2, we speculated that HIF1-α and its downstream molecules would have key functions in cellular growth. Consistent with our hypothesis, overexpressed ARNT2 cells showed down-regulation of HIF1-α, which causes hypofunctioning of glucose transporter 1, leading to decreased cellular growth. Our results proposed for the first time that the ARNT2 level is an indicator of cellular proliferation in OSCCs. Therefore, ARNT2 may be a potential therapeutic target against progression of OSCCs.
Keywords: ARNT2, oral squamous cell carcinoma, cellular proliferation, VHL, HIF1-α, GLUT-1.
Introduction
The transcription factors aryl hydrocarbon receptor nuclear translocator (ARNT) and ARNT2 have important roles in adaptive responses to generalized and cellular stress (1-5). The amino acid sequence of ARNT2 is more than 90% identical to that of ARNT (6, 7). Whereas ARNT is expressed ubiquitously both during fetal development and throughout adulthood, ARNT2 is expressed predominately in the central nervous system and developing kidney (8-12). ARNT2 acts as a common obligate partner for several other members of the family, including aryl hydrocarbon receptor and single-minded 1, a transcription factor (13-15). ARNT2 knockout mice and zebrafish have severe developmental defects and die shortly after birth (16-19).
ARNT2 mRNA expression levels are correlated positively with breast cancer prognosis, and the presence of ARNT2 was associated significantly with smaller tumoral sizes and the 5-year survival rate after breast cancer diagnosis (12). A high intratumoral ARNT2 level was well correlated with longer overall survival and lower tumoral recurrence of hepatocellular carcinoma after resection (20). Although many of the functions of ARNT2 are unknown, those perspective findings indicate a possible role of ARNT2 in oral squamous cell carcinoma (OSCC) development, treatment, and outcome.
In addition to our previous data that indicated that ARNT2 is a significantly down-regulated gene in OSCC (21), we report here that lower ARNT2 expression is associated with tumoral size in OSCCs. Therefore, we propose that ARNT2 may be a key regulator of tumoral progression in OSCCs.
Materials and Methods
Ethics statement
The Ethics Committee of the Graduate School of Medicine, Chiba University, approved the study protocol (approval number, 236). The study was performed according to the tenets of the Declaration of Helsinki. All patients provided written informed consent before participating in this research.
OSCC-derived cell lines and tissue specimens
Human OSCC-derived cell lines (HSC-2, HSC-3, HSC-4, KOSC-2, Ho-1-u-1, Ho-1-N-1, Sa3, Ca9-22, and SAS) were obtained from the Human Science Research Resources Bank (Osaka, Japan) or the RIKEN BioResource Center (Ibaraki, Japan) through the National Bio-Resource Project of the Ministry of Education, Culture, Sports, Science and Technology (MEXT) (Tokyo, Japan). Short tandem repeat profiles confirmed the cellular identity. Primary cultured human normal oral keratinocytes (HNOKs) were obtained from three healthy donors and served as a normal control (22-26). All cells were grown in Dulbecco's modified Eagle medium (DMEM) (Sigma-Aldrich, St. Louis, MO, USA) supplemented with 10% fetal bovine serum (FBS) (Sigma) and 50 units/ml penicillin and streptomycin (Sigma).
One hundred primary OSCC samples and patient-matched normal epithelial specimens were obtained during surgeries performed at Chiba University Hospital. The resected tissues were fixed in 20% buffered formaldehyde solution for pathologic diagnosis and immunohistochemistry (IHC). Histopathologic diagnosis of each OSCC sample was performed according to the World Health Organization criteria by the Department of Pathology of Chiba University Hospital. Clinicopathologic staging was determined by the TNM classification of the International Union against Cancer (27). All patients had OSCC that was histologically confirmed, and tumoral samples were checked to ensure that tumoral tissue was present in more than 80% of specimens.
Preparation of cDNA and protein
Total RNA was isolated using Trizol Reagent (Invitrogen, Carlsbad, CA, USA) according to the manufacturer's instructions. cDNA was generated from 5 µg total RNA using Ready-To-Go You-Prime First-Strand Beads (GE Healthcare, Buckinghamshire, UK) and oligo (dT) primer (Hokkaido System Science, Sapporo, Japan) according to the manufacturer's instructions.
For protein extraction, the cells were washed twice with cold phosphate buffered saline (PBS) and centrifuged briefly. The cellular pellets were incubated at 4°C for 30 minutes in a lysis buffer (7 M urea, 2 M thiourea, 4% w/v CHAPS, and 10 mM Tris pH 7.4) with a proteinase inhibitor cocktail (Roche Diagnostics, Mannheim, Germany). The protein concentration was measured using the BCA Protein Assay Kit (Thermo, Rockford, IL, USA).
mRNA expression analysis
Real-time quantitative reverse transcriptase-polymerase chain reaction (qRT-PCR) was performed using the LightCycler 480 apparatus (Roche Diagnostics). Primers and universal probes were designed using the Universal Probe Library (Roche Diagnostics), which specifies the most suitable set. The primer sequences used for qRT-PCR were: ARNT2, forward, 5'- TGAGGGGTACAGGGAACAAG-3'; reverse, 5'- GAGATTTGGGACATGTTCTGG -3'; and universal probe #35; GAPDH, forward, 5'- AGCCACATCGCTCAGACAC-3'; reverse, 5'-GCCCAATACGACCAAATCC-3'; and universal probe #60; von Hippel-Lindau tumor suppressor, E3 ubiquitin protein ligase (VHL), forward, 5'-TGAGCTGATATCGCACCATT-3'; reverse, 5'-CTGGAGTGTCTCATTCACTTCACT-3'; and universal probe #19; hypoxia inducible factor 1, alpha subunit (HIF-1α), forward, 5'- TTTTTCAAGCAGTAGGAATTGGA-3'; reverse, 5'-GTGATGTAGTAGCTGCATGATCG-3'; and universal probe #66; and solute carrier family 2 (facilitated glucose transporter), member 1 (GLUT-1), forward, 5'-GGTTGTGCCATACTCATGACC-3'; reverse, 5'-CAGATAGGACATCCAGGGTAGC-3'; and universal probe #67.
The transcript amounts for ARNT2, VHL, HIF-1α, and GLUT-1 were estimated from the respective standard curves and normalized to the GAPDH transcript amount determined in corresponding samples. All samples were analyzed in triplicate and three independent preparations of RNA were analyzed from each cell line.
Immunoblot analysis
Protein extracts (20 µg) were separated by sodium dodecyl sulfate polyacrylamide gel electrophoresis in 10% gel, transferred to nitrocellulose membranes, and blocked for 1 hour at room temperature in Blocking One (Nacalai Tesque, Tokyo, Japan). The membranes were incubated with rabbit anti-ARNT2 polyclonal antibody (Santa Cruz Biotechnology, Santa Cruz, CA, USA), mouse anti-GAPDH monoclonal antibody (Santa Cruz Biotechnology), mouse anti-VHL monoclonal antibody (Cell Signaling Technology, Danvers, MA, USA), rabbit anti-HIF-1α polyclonal antibody (Cell Signaling Technology), and mouse anti-GLUT-1 monoclonal antibody (Arigo Biotechnology, Hsinchu City, Taiwan, China) overnight at 4°C. The membranes were washed with 0.1% Tween-20 in Tris-buffered saline and incubated with secondary antibody coupled to horseradish peroxidase-conjugated anti-rabbit or anti-mouse IgG (Promega, Madison, WI, USA) for 1 hour at room temperature. Finally, bands were detected using SuperSignal West Pico Chemiluminescent substrate (Thermo), and immunoblotting was visualized by exposing the membranes to the BioRad ChemiDoc™ XRS System (BioRad, Tokyo, Japan). The signal intensities were quantitated using Image Lab software (BioRad). Densitometric ARNT2, VHL, HIF-1α, and GLUT-1 protein data were normalized to GAPDH protein levels.
IHC
IHC was performed on 4-µm sections of paraffin-embedded specimens using rabbit anti-ARNT2 polyclonal antibody (Santa Cruz Biotechnology). Briefly, after deparaffinization and hydration, the endogenous peroxidase activity was quenched by a 30-minute incubation in a mixture of 0.3% hydrogen peroxide solution in 100% methanol; the sections were blocked for 2 hours at room temperature with 1.5% blocking serum (Santa Cruz Biotechnology) in PBS before reacting with anti-ARNT2 antibody at 4°C in a moist chamber overnight. Upon incubation with the primary antibody, the specimens were washed three times in PBS and treated with Envision reagent (DAKO, Carpinteria, CA, USA) followed by color development in 3,3'-diaminobenzidine tetrahydrochloride (DAKO). The slides then were slightly counterstained with hematoxylin, dehydrated with ethanol, cleaned with xylene, and mounted. Nonspecific binding of an antibody to proteins other than the antigen sometimes occurred. As a negative control, triplicate sections were immunostained without exposure to primary antibodies, which confirmed the staining specificity. To quantify the status of ARNT2 protein expression in those components, we used the IHC scoring systems described previously (28-32). In summary, the mean percentages of positive tumoral cells were determined in at least three random fields at 400× magnification in each section. The intensity of the ARNT2 immunoreaction was scored as follows: 0+, none; 1+, weak; 2+, moderate; and 3+, intense. The cellular number and the staining intensity were multiplied to produce an ARNT2 IHC score. To determine the cutoff points of ARNT2 IHC scores, we analyzed the IHC scores of 100 patients using the receiver operating characteristic (ROC) curve and the Youden index. Cases with a score above 107.0 were defined as ARNT2-positive. Two independent pathologists from Chiba University Hospital, neither of whom had knowledge of the patients' clinical status, made these judgments.
Plasmid construction and transfection of ARNT2 overexpression vector
To construct the ARNT2 overexpression vector, the Gateway® LR clonase enzyme mix kit (Invitrogen) was used for the LR recombination reaction, including 100 ng of entry clone plasmid DNA (CUSABIO, Wuhan, China), 100 ng of destination vector pcDNA-DEST47 (Invitrogen), 2 μl of 5 × LR clonase reaction buffer, and 2 μg of LR clonase enzyme. The mixture was brought to a final volume of 10 μl with TE buffer (pH 8.0) and incubated at room temperature for 1 hour.
The HSC-3 and KOSC-2 cell lines were transfected with the ARNT2 overexpression vector (oeARNT2) or control vector (Mock) (Invitrogen) using Lipofectamine 3000 reagents (Invitrogen). After transfection, the stable transfectants were isolated by the culture medium containing 300 μg/mL G418 solution (Invitrogen). Two to three weeks after selection, viable colonies were transferred to new dishes. The oeARNT2 and Mock cells were used for further experiments.
Proliferation assay
The transfectants were seeded in six-well plates at a density of 1 × 10⁴ viable cells per well. The cells were cultured for 168 hours and counted every 24 hours. At the indicated time points, the cells were trypsinized and counted using a hemocytometer in triplicate samples.
Immunofluorescence
The transfectants were plated on chamber slides (Becton-Dickinson Falcon, Franklin Lakes, NJ, USA) at 50% confluency, washed with ice-cold PBS, fixed with 4% paraformaldehyde-PBS for 20 min, and then permeabilized in PBS containing 0.2% Triton X-100 as described previously (24). Fixed cells were incubated with a blocking solution containing 0.5% bovine serum albumin for 1 hour at room temperature and incubated with primary antibodies overnight at 4°C. We used the following primary antibodies: rabbit anti-ARNT2 polyclonal antibody (Santa Cruz Biotechnology) and mouse anti-GLUT-1 monoclonal antibody (Arigo Biolaboratories). After washing with PBS, the cells were incubated with secondary antibodies for 1 hour at room temperature. The secondary antibodies were fluorescein isothiocyanate-conjugated anti-rabbit IgG antibody (Vector Laboratories, Burlingame, CA, USA) or Texas Red-conjugated anti-mouse IgG antibody (Vector Laboratories) incubated for 1 hour at room temperature in the dark. Finally, the sections were washed three times with PBS and mounted using Mounting Medium with DAPI (Vector Laboratories). The immunofluorescence was performed by confocal microscopy and analyzed using FluoView Software (Olympus Optical, Tokyo, Japan).
Glucose cellular uptake assay
The glucose uptake value was determined by the levels of intracellular 2-deoxyglucose 6-phosphate (2-DG) using the Glucose Cellular Uptake Measurement Kit (Cosmo Bio, Tokyo, Japan). The transfectants were seeded in six-well plates at a density of 1 × 10⁴ viable cells per well and then cultured in DMEM without FBS for 6 hours. Each well was washed three times with Krebs-Ringer Phosphate HEPES (KRPH) buffer and the cells were cultured in KRPH buffer containing 1 mM 2-DG for 1 hour. The wells were washed three times with PBS containing 200 μM phloretin to quench the glucose uptake. The cells were sonicated and centrifuged at 15,000 x g for 20 minutes. The supernatant was mixed with reaction buffer and incubated at 80 °C for 15 minutes. The mixture was added to a 96-well plate and incubated for 2 hours at 37 °C. The fluorescence intensity was measured at an excitation wavelength of 540 nm and an emission wavelength of 590 nm using a plate reader.
Statistical analysis
In comparisons of the ARNT2 expression levels, statistical significance was evaluated using the Mann-Whitney U test. The relationships between the ARNT2 IHC scores and clinicopathological profiles were evaluated by the Mann-Whitney U test, χ2 test, and Fisher's exact test. P < 0.05 was considered significant. The data are expressed as the mean ± standard error of the mean.
Results
Evaluation of ARNT2 expression in OSCC-derived cell lines
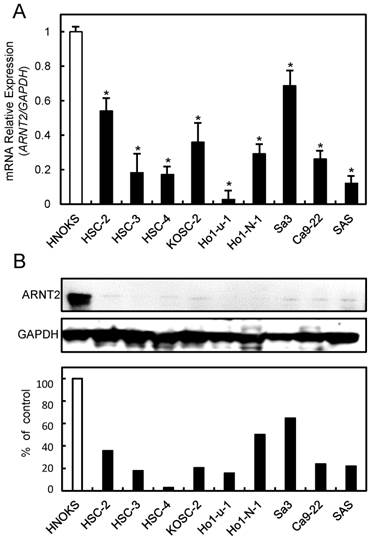
To investigate the expression status of ARNT2, we performed qRT-PCR and immunoblot analyses using nine OSCC-derived cell lines (HSC-2, HSC-3, HSC-4, KOSC-2, Ho-1-u-1, Ho-1-N-1, Sa3, Ca9-22, and SAS) and HNOKs. ARNT2 mRNA was down-regulated significantly (P < 0.05) in all OSCC-derived cell lines compared with the HNOKs (Fig. 1A). Fig. 1B shows representative results of immunoblot analysis. The ARNT2 protein expression decreased significantly (P < 0.05) in all OSCC-derived cell lines compared with the HNOKs.
Evaluation of ARNT2 expression in OSCC-derived cell lines. (A) Quantification of ARNT2 mRNA expression in OSCC-derived cell lines by qRT-PCR analysis. Significant (*P < 0.05, Mann-Whitney U-test) down-regulation of ARNT2 mRNA is seen in nine OSCC-derived cell lines compared with HNOKs. Data are expressed as the means ± standard errors of the mean of triplicate results. (B) Immunoblot analysis of ARNT2 protein in OSCC-derived cell lines and HNOKs. ARNT2 protein expression is down-regulated in OSCC-derived cell lines compared with that in HNOKs. Densitometric ARNT2 protein data are normalized to GAPDH protein levels. The values are expressed as a percentage of HNOKs.
Evaluation of ARNT2 expression in primary OSCCs
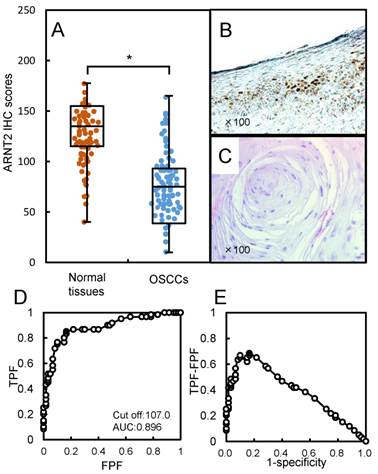
We analyzed the ARNT2 protein expression in primary OSCCs from 100 patients using the IHC scoring system (33-39). The ARNT2 IHC scores in adjacent normal oral tissues and OSCCs ranged from 40 to 180 (median, 135) and 10 to 157 (median, 75). The IHC scores in the primary OSCCs were significantly (P < 0.05) lower than in normal oral tissues (Fig. 2A). Fig. 2B and C, respectively, show representative IHC results for ARNT2 protein in adjacent normal oral tissue and primary OSCCs. Strong ARNT2 immunoreactivity was detected in the nuclei of normal tissues, whereas the OSCC tissues showed almost negative immunostaining. To determine an optimal cutoff point of the identified IHC scores, we used ROC curve analysis and the Youden index. The ROC curve analysis (area under the curve, 0.896; 95% confidence interval [CI], 0.8201-0.9438; P < 0.05) and Youden index (sensitivity, 85.0%; specificity, 83.3%; P < 0.05) showed that the cutoff value was 107 (Fig. 2D, E). Table 1 shows the correlations between the clinicopathological characteristics of the patients with OSCC and the status of ARNT2 protein expression. Among the clinical parameters, the ARNT2 expression level was significantly (P < 0.05) related to the primary tumoral size of the OSCCs.
Evaluation of ARNT2 expression in primary OSCCs. (A) The ARNT2 IHC scores in adjacent normal oral tissues and OSCCs range from 40 to 180 (median, 135) and 10 to 157 (median, 75), respectively. The IHC scores in primary OSCCs are significantly (*P < 0.05) lower than in normal oral tissues. Representative IHC results for ARNT2 protein in (B) normal oral tissue and primary (C) OSCC. Strong ARNT2 immunoreactivity is seen in normal oral tissues, whereas the OSCCs show almost negative immunostaining. Original magnification, x 100. (D) ROC curve analysis shows the optimal cutoff value is 107.5 (area under the curve, 0.896; 95% CI, 0.8201-0.9438; *P < 0.05). (E) The Youden index (sensitivity, 85.0%; specificity, 83.3%; *P < 0.05) also shows that the optimal cutoff value is 107.5. AUC, area under the curve.
Correlation between ARNT2 expression and clinical classification in OSCCs.
| Clinical classification | Total | Results of immunostaining | P value | |
|---|---|---|---|---|
| ARNT2 negative | ARNT2 positive | |||
| Age at surgery (years) | ||||
| <60 | 26 | 21 | 5 | 0.3618 |
| ≧60, <70 | 25 | 21 | 4 | |
| ≧70 | 49 | 34 | 15 | |
| Gender | ||||
| Male | 62 | 45 | 17 | 0.3446 |
| Female | 38 | 31 | 7 | |
| T-primary tumor | ||||
| T1 | 8 | 6 | 2 | 0.02087* |
| T2 | 60 | 51 | 9 | |
| T3 | 16 | 10 | 6 | |
| T4 | 16 | 9 | 7 | |
| N-regional lymph node | ||||
| Negative | 63 | 51 | 12 | 0.1506 |
| Positive | 37 | 25 | 12 | |
| Stage | ||||
| I | 6 | 4 | 2 | 0.1049 |
| II | 42 | 36 | 6 | |
| III | 17 | 13 | 4 | |
| IV | 35 | 23 | 12 | |
| Vascular invasion | ||||
| Negative | 74 | 59 | 15 | 0.439 |
| Positive | 26 | 17 | 9 | |
| Histopathologic type | ||||
| Well differentiated | 62 | 48 | 14 | 0.807 |
| Moderately differentiated | 32 | 23 | 9 | |
| Poorly differentiated | 6 | 5 | 1 | |
| Tumoral site | ||||
| Tongue | 51 | 40 | 11 | 0.6045 |
| Gingiva | 29 | 21 | 8 | |
| Buccal mucosa | 10 | 8 | 2 | |
| Soft palate | 3 | 2 | 1 | |
| Oral floor | 7 | 5 | 2 | |
* P<0.05 is significant.
Establishment of ARNT2 overexpressed cells
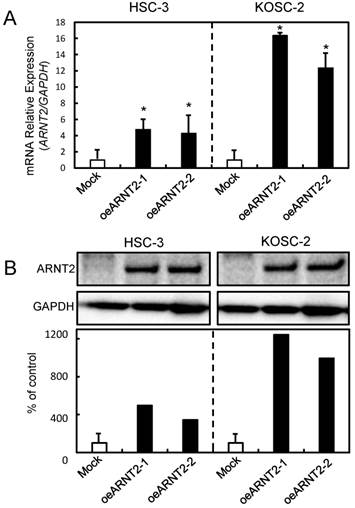
Since frequent down-regulation of ARNT2 was observed in the OSCC-derived cells (Fig. 1), the OSCC-derived cells (HSC-3 and KOSC-2) were transfected with ARNT2 overexpression vector (oeARNT2) and control vector (Mock). To confirm the efficiency of the transfections, we performed qRT-PCR and immunoblot analyses (Fig. 3A, B). The ARNT2 mRNA expression level in the oeARNT2 cells was significantly (P < 0.05) greater than in the Mock cells (Fig. 3A). The ARNT2 protein level in the oeARNT2 cells also increased compared with the Mock cells (Fig. 3B).
Establishment of ARNT2 overexpressed cells. Significant (*P < 0.05, Mann-Whitney U test) up-regulation of (A) ARNT2 mRNA and (B) protein are observed in oeARNT2 cells compared with that in Mock cells using qRT-PCR and immunoblot analyses. Densitometric ARNT2 protein data are normalized to GAPDH protein levels. The values are expressed as a percentage of the Mock cells.
Cellular proliferation of ARNT2 overexpressed cells
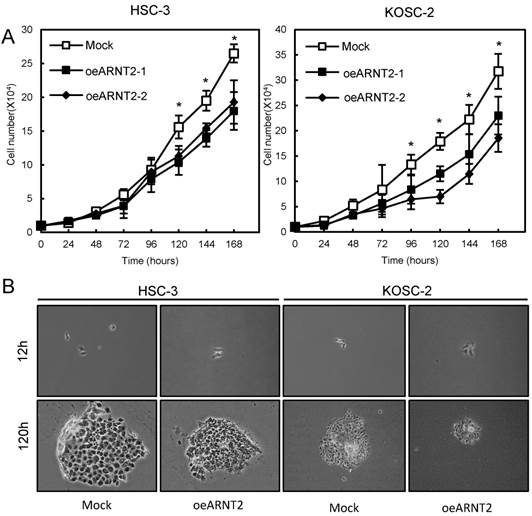
To evaluate the effect of ARNT2 overexpression on cellular growth, we performed a cellular proliferation assay. We found a significant (P < 0.05) decrease in cellular growth in the oeARNT2 cells compared with the Mock cells (Fig. 4A). Images were obtained after 12 and 120 hours using a Leica LCD microscope (Leica Microsystems, Wetzlar, Germany) (original magnification, x200) (Fig. 4B).
Cellular proliferation of ARNT2 overexpressed cells. (A) To determine the effect of ARNT2 overexpression on cellular proliferation, oeARNT2 and Mock cells are seeded in six-well plates at a density of 1 × 10⁴ viable cells per well. Both transfectants are cultured for 168 hours and counted every 24 hours. The oeARNT2 cells have significantly (P < 0.05) decreased cellular growth compared with the Mock cells. (B) Images are obtained after 12 and 120 hours using a Leica LCD microscope (original magnification, x200) and are representative of three independent experiments. The results are expressed as the means ± standard errors of the mean of values from three assays. h, hours.
Evaluation of VHL, HIF1-α, and GLUT-1 expression levels in ARNT2 overexpressed cells
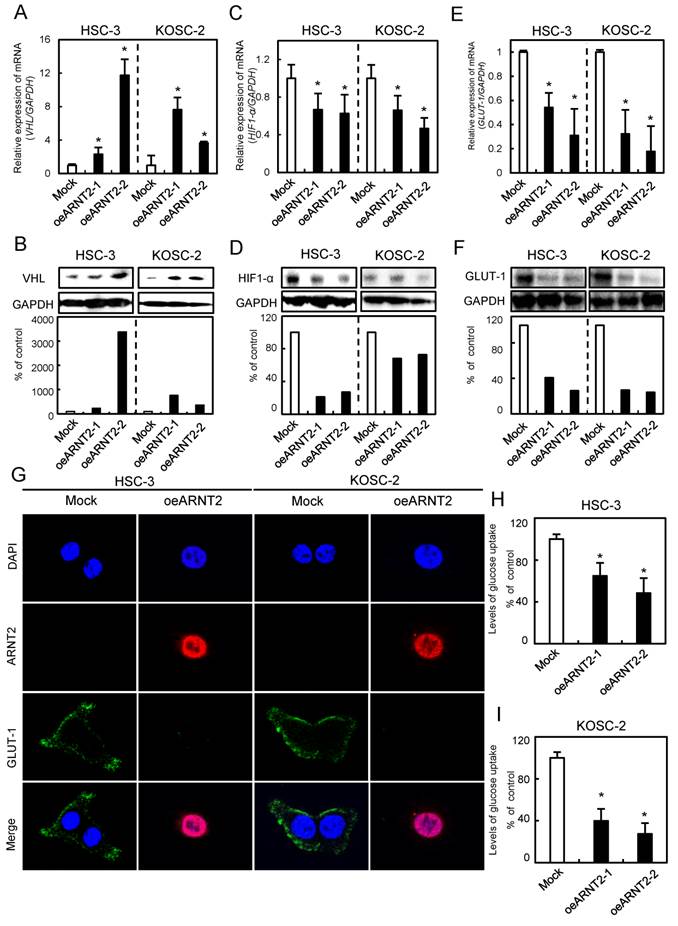
Since VHL a negative regulator of HIF1-α, is a molecule downstream from ARNT2 (14), we investigated the VHL and HIF1-α expression levels in ARNT2-overexpressed cells. The VHL mRNA and protein expression levels in the oeARNT2 cells were significantly (P < 0.05) greater than in Mock cells (Fig. 5A, B). In contrast, the HIF1-α mRNA and protein expression levels in the oeARNT2 cells were significantly (P < 0.05) lower than in the Mock cells (Fig. 5C, D). The GLUT-1, a HIF1-α related molecule, mRNA and protein expression levels in the oeARNT2 cells measured by qRT-PCR, immunoassay, and glucose cellular uptake analyses were significantly (P < 0.05) lower than in Mock cells (Fig. 5E, F). The immunofluorescence data showed strong immunoreactivity of ARNT2 and weak immunoreactivity of GLUT-1 in the oeARNT2 cells, whereas the Mock cells showed weak immunoreactivity of ARNT2 and strong immunoreactivity of GLUT-1 (Fig. 5G). The glucose cellular uptake assay showed that ARNT2 overexpression resulted in significantly (P < 0.05) decreased levels of glucose uptake compared with the Mock cells (Fig. 5H, I).
Evaluation of VHL, HIF1-α, and GLUT-1 expression levels in ARNT2 overexpressed cells. (A) Expression of VHL mRNA in oeARNT2 and Mock cells. The VHL mRNA expression level in the oeARNT2 cells is significantly (*P < 0.05, Mann-Whitney U test) higher than in the Mock cells. (B) Immunoblot analysis shows that the VHL protein levels in the oeARNT2 cells are increased markedly compared with the Mock cells. (C) Expression of HIF1-α mRNA in the oeARNT2 and Mock cells. The HIF1-α mRNA expression level in the oeARNT2 cells is significantly (*P < 0.05, Mann-Whitney U test) lower than in the Mock cells. (D) Immunoblot analysis shows that the HIF1-α protein levels in the oeARNT2 cells are decreased markedly compared with the Mock cells. (E) The expression levels of GLUT-1 mRNA in the oeARNT2 and Mock cells. The GLUT-1 mRNA expression level in the oeARNT2 cells is significantly (*P < 0.05, Mann-Whitney U test) lower than in the Mock cells. (F) Immunoblot analysis shows that the GLUT-1 protein levels in the oeARNT2 cells are also decreased markedly compared with the Mock cells. (B, D, F) Densitometric protein data are normalized to the GAPDH protein levels. The values are expressed as a percentage of the Mock cells. (G) Strong immunoreactivity of ARNT2 and weak immunoreactivity of GLUT-1 are seen in the oeARNT2 cells, whereas strong immunoreactivity of GLUT-1 and weak immunoreactivity of ARNT2 are seen in the Mock cells (red, ARNT2; green, GLUT-1; blue, DNA). ARNT2 is localized in the nucleus and cytosol of the oeARNT2 cells. GLUT-1 is localized in the cell membrane. (H, I) A glucose uptake assay shows that ARNT2 overexpression results in significantly (P < 0.05) decreased levels of glucose uptake compared with the Mock cells. The values are expressed as a percentage of the Mock cells.
Discussion
The current study found that ARNT2 was down-regulated frequently in OSCCs and was correlated with tumoral progression. Consistent with these clinical findings (Fig. 2), in vitro experiments showed that ARNT2 overexpression significantly inhibits cellular proliferation (Fig. 4).
ARNT2 expression is a prognostic marker and a potential therapeutic target in breast and hepatocellular cancers (12, 20). High expression of ARNT2 is associated with extended survival rates from the time of diagnosis in both cancers (12, 20), suggesting that ARNT2 plays important roles in cancer development and progression. However, similar to our current study, exogenous overexpressed ARNT2 in non-small cell lung cancer cells significantly decreased the capacity for proliferation and increased cell apoptosis (40). Therefore, ARNT2 plays pivotal roles in development and progression of several types of cancers.
We also found a new pathway downstream of ARNT2 in OSCCs. Briefly, overexpressed ARNT2 positively regulated VHL, a tumor suppressor gene, which ubiquitinates HIF1-α for degradation by the proteasome (41), leading to down-regulation of GLUT-1. Without VHL, HIF-1α translocates to the nucleus to activate the expression of its target genes, such as GLUT-1 (41). HIF-1α increases the rate of glucose uptake through the transcriptional activation of GLUT-1 (42, 43). Elevated expression levels of either HIF1-α or GLUT-1 has been detected in many different cancers, including head and neck tumors (44-47). GLUT-1 expression is undetectable primarily in normal epithelial tissues and benign epithelial tumors. GLUT-1 protein expression is associated with a poor prognosis in a wide range of solid tumors (48-52). Actually, in the current study, we found that overexpressed ARNT2 cells had significantly (P < 0.05) decreased cellular growth and levels of glucose uptake compared with Mock cells (Fig. 5).
In conclusion, ARNT2 is frequently down-regulated in OSCCs and plays an important role in OSCC progression through the VHL-HIF1-α-GLUT-1 axis. Therefore, ARNT2 expression is likely to be a biomarker of proliferation, a prognostic indicator, and a potential therapeutic target for OSCC.
Competing Interests
The authors have declared that no competing interest exists.
References
1. Furness SG, Lees MJ, Whitelaw ML. The dioxin (aryl hydrocarbon) receptor as a model for adaptive responses of bHLH/PAS transcription factors. FEBS letters. 2007;581:3616-25
2. Hendricks JC. Invited review: Sleeping flies don't lie: the use of Drosophila melanogaster to study sleep and circadian rhythms. Journal of applied physiology (Bethesda, Md: 1985). 2003;94:1660-72 discussion 73
3. Tukey RH, Strassburg CP. Human UDP-glucuronosyltransferases: metabolism, expression, and disease. Annual review of pharmacology and toxicology. 2000;40:581-616
4. Wakabayashi N, Slocum SL, Skoko JJ, Shin S, Kensler TW. When NRF2 talks, who's listening? Antioxidants & redox signaling. 2010;13:1649-63
5. Whitlock JP Jr. Induction of cytochrome P4501A1. Annual review of pharmacology and toxicology. 1999;39:103-25
6. Pongratz I, Antonsson C, Whitelaw ML, Poellinger L. Role of the PAS domain in regulation of dimerization and DNA binding specificity of the dioxin receptor. Molecular and cellular biology. 1998;18:4079-88
7. Reisz-Porszasz S, Probst MR, Fukunaga BN, Hankinson O. Identification of functional domains of the aryl hydrocarbon receptor nuclear translocator protein (ARNT). Molecular and cellular biology. 1994;14:6075-86
8. Jain S, Maltepe E, Lu MM, Simon C, Bradfield CA. Expression of ARNT, ARNT2, HIF1 alpha, HIF2 alpha and Ah receptor mRNAs in the developing mouse. Mechanisms of development. 1998;73:117-23
9. Aitola MH, Pelto-Huikko MT. Expression of Arnt and Arnt2 mRNA in developing murine tissues. The journal of histochemistry and cytochemistry: official journal of the Histochemistry Society. 2003;51:41-54
10. Dougherty EJ, Pollenz RS. Analysis of Ah receptor-ARNT and Ah receptor-ARNT2 complexes in vitro and in cell culture. Toxicological sciences: an official journal of the Society of Toxicology. 2008;103:191-206
11. Freeburg PB, Abrahamson DR. Divergent expression patterns for hypoxia-inducible factor-1beta and aryl hydrocarbon receptor nuclear transporter-2 in developing kidney. Journal of the American Society of Nephrology: JASN. 2004;15:2569-78
12. Martinez V, Kennedy S, Doolan P, Gammell P, Joyce H, Kenny E. et al. Drug metabolism-related genes as potential biomarkers: analysis of expression in normal and tumour breast tissue. Breast cancer research and treatment. 2008;110:521-30
13. Michaud JL, DeRossi C, May NR, Holdener BC, Fan CM. ARNT2 acts as the dimerization partner of SIM1 for the development of the hypothalamus. Mechanisms of development. 2000;90:253-61
14. Hao N, Bhakti VL, Peet DJ, Whitelaw ML. Reciprocal regulation of the basic helix-loop-helix/Per-Arnt-Sim partner proteins, Arnt and Arnt2, during neuronal differentiation. Nucleic acids research. 2013;41:5626-38
15. Schweitzer J, Lohr H, Bonkowsky JL, Hubscher K, Driever W. Sim1a and Arnt2 contribute to hypothalamo-spinal axon guidance by regulating Robo2 activity via a Robo3-dependent mechanism. Development (Cambridge, England). 2013;140:93-106
16. Hill AJ, Heiden TC, Heideman W, Peterson RE. Potential roles of Arnt2 in zebrafish larval development. Zebrafish. 2009;6:79-91
17. Keith B, Adelman DM, Simon MC. Targeted mutation of the murine arylhydrocarbon receptor nuclear translocator 2 (Arnt2) gene reveals partial redundancy with Arnt. Proceedings of the National Academy of Sciences of the United States of America. 2001;98:6692-7
18. Hsu HJ, Wang WD, Hu CH. Ectopic expression of negative ARNT2 factor disrupts fish development. Biochemical and biophysical research communications. 2001;282:487-92
19. Hosoya T, Oda Y, Takahashi S, Morita M, Kawauchi S, Ema M. et al. Defective development of secretory neurones in the hypothalamus of Arnt2-knockout mice. Genes to cells: devoted to molecular & cellular mechanisms. 2001;6:361-74
20. Li W, Liang Y, Yang B, Sun H, Wu W. Downregulation of ARNT2 promotes tumor growth and predicts poor prognosis in human hepatocellular carcinoma. Journal of gastroenterology and hepatology. 2015;30:1085-93
21. Yamano Y, Uzawa K, Shinozuka K, Fushimi K, Ishigami T, Nomura H. et al. Hyaluronan-mediated motility: a target in oral squamous cell carcinoma. International journal of oncology. 2008;32:1001-9
22. Saito Y, Kasamatsu A, Yamamoto A, Shimizu T, Yokoe H, Sakamoto Y. et al. ALY as a potential contributor to metastasis in human oral squamous cell carcinoma. Journal of cancer research and clinical oncology. 2013;139:585-94
23. Shimizu T, Kasamatsu A, Yamamoto A, Koike K, Ishige S, Takatori H. et al. Annexin A10 in human oral cancer: biomarker for tumoral growth via G1/S transition by targeting MAPK signaling pathways. PloS one. 2012;7:e45510
24. Unozawa M, Kasamatsu A, Higo M, Fukumoto C, Koyama T, Sakazume T. et al. Cavin-2 in oral cancer: A potential predictor for tumor progression. Molecular carcinogenesis. 2015
25. Kasamatsu A, Uzawa K, Nakashima D, Koike H, Shiiba M, Bukawa H. et al. Galectin-9 as a regulator of cellular adhesion in human oral squamous cell carcinoma cell lines. International journal of molecular medicine. 2005;16:269-73
26. Endo Y, Uzawa K, Mochida Y, Shiiba M, Bukawa H, Yokoe H. et al. Sarcoendoplasmic reticulum Ca(2+) ATPase type 2 downregulated in human oral squamous cell carcinoma. International journal of cancer Journal international du cancer. 2004;110:225-31
27. Sobin LH, Gospodarowicz MK, Wittekind C. TNM classification of malignant tumours. John Wiley & Sons. 2011
28. Sakuma K, Kasamatsu A, Yamatoji M, Yamano Y, Fushimi K, Iyoda M. et al. Expression status of Zic family member 2 as a prognostic marker for oral squamous cell carcinoma. Journal of cancer research and clinical oncology. 2010;136:553-9
29. Shimizu F, Shiiba M, Ogawara K, Kimura R, Minakawa Y, Baba T. et al. Overexpression of LIM and SH3 Protein 1 leading to accelerated G2/M phase transition contributes to enhanced tumourigenesis in oral cancer. PloS one. 2013;8:e83187
30. Fukumoto C, Nakashima D, Kasamatsu A, Unozawa M, Shida-Sakazume T, Higo M. et al. WWP2 is overexpressed in human oral cancer, determining tumor size and poor prognosis in patients: downregulation of WWP2 inhibits the AKT signaling and tumor growth in mice. Oncoscience. 2014;1:807-20
31. Uchida F, Uzawa K, Kasamatsu A, Takatori H, Sakamoto Y, Ogawara K. et al. Overexpression of CDCA2 in human squamous cell carcinoma: correlation with prevention of G1 phase arrest and apoptosis. PloS one. 2013;8:e56381
32. Usukura K, Kasamatsu A, Okamoto A, Kouzu Y, Higo M, Koike H. et al. Tripeptidyl peptidase II in human oral squamous cell carcinoma. Journal of cancer research and clinical oncology. 2013;139:123-30
33. Yamatoji M, Kasamatsu A, Kouzu Y, Koike H, Sakamoto Y, Ogawara K. et al. Dermatopontin: a potential predictor for metastasis of human oral cancer. International journal of cancer Journal international du cancer. 2012;130:2903-11
34. Minakawa Y, Kasamatsu A, Koike H, Higo M, Nakashima D, Kouzu Y. et al. Kinesin family member 4A: a potential predictor for progression of human oral cancer. PloS one. 2013;8:e85951
35. Ishige S, Kasamatsu A, Ogoshi K, Saito Y, Usukura K, Yokoe H. et al. Decreased expression of kallikrein-related peptidase 13: possible contribution to metastasis of human oral cancer. Molecular carcinogenesis. 2014;53:557-65
36. Baba T, Sakamoto Y, Kasamatsu A, Minakawa Y, Yokota S, Higo M. et al. Persephin: A potential key component in human oral cancer progression through the RET receptor tyrosine kinase-mitogen-activated protein kinase signaling pathway. Molecular carcinogenesis. 2015;54:608-17
37. Kimura R, Kasamatsu A, Koyama T, Fukumoto C, Kouzu Y, Higo M. et al. Glutamate acid decarboxylase 1 promotes metastasis of human oral cancer by beta-catenin translocation and MMP7 activation. BMC cancer. 2013;13:555
38. Koyama T, Ogawara K, Kasamatsu A, Okamoto A, Kasama H, Minakawa Y. et al. ANGPTL3 is a novel biomarker as it activates ERK/MAPK pathway in oral cancer. Cancer medicine. 2015;4:759-69
39. Iyoda M, Kasamatsu A, Ishigami T, Nakashima D, Endo-Sakamoto Y, Ogawara K. et al. Epithelial cell transforming sequence 2 in human oral cancer. PloS one. 2010;5:e14082
40. Yang B, Yang E, Liao H, Wang Z, Den Z, Ren H. ARNT2 is downregulated and serves as a potential tumor suppressor gene in non-small cell lung cancer. Tumour biology: the journal of the International Society for Oncodevelopmental Biology and Medicine. 2015;36:2111-9
41. Haddad NM, Cavallerano JD, Silva PS. Von hippel-lindau disease: a genetic and clinical review. Seminars in ophthalmology. 2013;28:377-86
42. Gnarra JR, Zhou S, Merrill MJ, Wagner JR, Krumm A, Papavassiliou E. et al. Post-transcriptional regulation of vascular endothelial growth factor mRNA by the product of the VHL tumor suppressor gene. Proceedings of the National Academy of Sciences of the United States of America. 1996;93:10589-94
43. Iliopoulos O, Levy AP, Jiang C, Kaelin WG Jr, Goldberg MA. Negative regulation of hypoxia-inducible genes by the von Hippel-Lindau protein. Proceedings of the National Academy of Sciences of the United States of America. 1996;93:10595-9
44. Airley RE, Mobasheri A. Hypoxic regulation of glucose transport, anaerobic metabolism and angiogenesis in cancer: novel pathways and targets for anticancer therapeutics. Chemotherapy. 2007;53:233-56
45. Medina RA, Owen GI. Glucose transporters: expression, regulation and cancer. Biological research. 2002;35:9-26
46. Amann T, Hellerbrand C. GLUT1 as a therapeutic target in hepatocellular carcinoma. Expert opinion on therapeutic targets. 2009;13:1411-27
47. Denko NC. Hypoxia, HIF1 and glucose metabolism in the solid tumour. Nature reviews Cancer. 2008;8:705-13
48. Cooper R, Sarioglu S, Sokmen S, Fuzun M, Kupelioglu A, Valentine H. et al. Glucose transporter-1 (GLUT-1): a potential marker of prognosis in rectal carcinoma? British journal of cancer. 2003;89:870-6
49. Oliver RJ, Woodwards RT, Sloan P, Thakker NS, Stratford IJ, Airley RE. Prognostic value of facilitative glucose transporter Glut-1 in oral squamous cell carcinomas treated by surgical resection; results of EORTC Translational Research Fund studies. European journal of cancer (Oxford, England: 1990). 2004;40:503-7
50. Younes M, Lechago LV, Lechago J. Overexpression of the human erythrocyte glucose transporter occurs as a late event in human colorectal carcinogenesis and is associated with an increased incidence of lymph node metastases. Clinical cancer research: an official journal of the American Association for Cancer Research. 1996;2:1151-4
51. Haber RS, Rathan A, Weiser KR, Pritsker A, Itzkowitz SH, Bodian C. et al. GLUT1 glucose transporter expression in colorectal carcinoma: a marker for poor prognosis. Cancer. 1998;83:34-40
52. Grabellus F, Nagarajah J, Bockisch A, Schmid KW, Sheu SY. Glucose transporter 1 expression, tumor proliferation, and iodine/glucose uptake in thyroid cancer with emphasis on poorly differentiated thyroid carcinoma. Clinical nuclear medicine. 2012;37:121-7
Author contact
![]() Corresponding authosr: Atsushi Kasamatsu and Katsuhiro Uzawa, Department of Oral Science, Graduate School of Medicine, Chiba University, 1-8-1 Inohana, Chuo-ku, Chiba 260-8670, Japan. Tel/Fax: +81-43-226-2300; E-mail: kasamatsuachiba-u.jp or uzawakchiba-u.jp.
Corresponding authosr: Atsushi Kasamatsu and Katsuhiro Uzawa, Department of Oral Science, Graduate School of Medicine, Chiba University, 1-8-1 Inohana, Chuo-ku, Chiba 260-8670, Japan. Tel/Fax: +81-43-226-2300; E-mail: kasamatsuachiba-u.jp or uzawakchiba-u.jp.