Impact Factor ISSN: 1837-9664

 Global reach, higher impact
J Cancer 2016; 7(7):810-816. doi:10.7150/jca.14310 This issue Cite
Research Paper
In Situ Characterizing Membrane Lipid Phenotype of Human Lung Cancer Cell Lines Using Mass Spectrometry Profiling
Manwen He, Shuai Guo, Junling Ren, Zhili Li ![]()
Department of Biophysics and Structural Biology, Institute of Basic Medical Sciences, Chinese Academy of Medical Sciences & School of Basic Medicine, Peking Union Medical College, Beijing 100005, PR China.
Received 2015-11-3; Accepted 2016-3-15; Published 2016-4-26
Abstract
Abnormal lipid metabolisms are closely associated with cancers. In this study, mass spectrometry was employed to in situ investigate the associations of membrane lipid phenotypes of six human lung cancer cell lines (i.e., A549, H1650, H1975 from adenocarcinoma, H157 and H1703 from squamous cell carcinomas, and H460 from a large cell carcinoma) with cancer cell types and finally total 230 lipids were detected. Based these 230 lipids, partial least-square discriminant analysis indicated that fifteen lipids (i.e., PE 18:0_18:1, PI 18:0_20:4, SM 42:2, PE 16:0_20:4, PE 36:2, PC 36:2, SM 34:1, PA 38:3,C18:0, C22:4, PA 34:2, C20:5, C20:2, C18:2, and CerP 36:2) with variable importance in the projection (VIP) value of > 1.0 could be used to differentiate six cancer cell lines with the Predicted Residual Sum of Square (PRESS) score of 0.1974. Positive correlation between polyunsaturated fatty acids (i.e., C20:4, C22:4, C22:5, and C22:6) and polyunsaturated phospholipids (PE 16:0_20:4, PE 38:4, and PI 18:0_20:4) was observed in lung adenocarcinoma cells, especially for H1975 cells. Three adenocarcinoma cell lines (i.e., A549, H1650, and H1975) could be differentiated from other lung cancer cell lines based on the expression of C18:1, C20:1, C20:2, C20:5, and C22:6.
Keywords: mass spectrometry, lung cancer cell lines
Introduction
Lung cancer is the major cause of cancer-related death worldwide. Non-small-cell lung carcinoma represents 85%-90% of all lung cancer death, including adenocarcinoma, squamous cell carcinoma, and large cell carcinoma [1]. The American Cancer Society reported that estimated deaths of lung cancer account for high proportion (28% in males and 26% in females) among ten leading cancers in the United States [2]. Lipids as important membrane biological molecules are responsible for membrane structure, signal transduction, and efficient fueling [3]. Recent studies have shown that cancer cells generate fatty acids (FAs) through de novo lipogenesis to maintain a constant supply of lipids or energy requirements in the rapid growth of tumors [4, 5]. Deregulation of lipid metabolism can lead to pathophysiological processes and changes in lipid mediators [6]. Changes in the levels of membrane lipids are associated with diseases. Significantly increased monounsaturated FAs (MUFAs, i.e., C16:1 and C18:1) and monounsaturated phosphatidylcholines (MUPCs, i.e., PC 32:1, PC 34:1, and PC 36:1) are observed in the cancer microenvironment [7]. In addition, differences in lipid molecular species are found to be associated with cell morphology and cancer phenotype [8].
Recent advancements in mass spectrometry (MS) have increased its applications to analyze lipidome [9]. Liquid chromatography coupled with electrospray ionization mass spectrometer is suitable for global lipid profiling of complex biological samples based on its effective separation and identification of individual lipid species. Different lipid classes (i.e., phosphatidylcholines (PCs), sphingomyelins (SMs), phosphatidic acids (PAs), phosphatidylethanolamines(PEs), phosphatidylinositols (PIs), phosphatidylserines (PSs), triacylglycerols (TGs), and lysophosphatidylcholines (LPCs)) can be detected within a single run [10, 11]. Matrix-assisted laser desorption ionization-mass spectrometry (MALDI-MS) offers a distinct advantage for lipid analysis as it has enabled in situ direction of lipids while maintaining cell integrity [12, 13]. Lipids such as phospholipids and sphingolipids including sphingomyelin (SM) and ceramide (Cer) are efficiently detected in positive ion mode with a commonly used MALDI matrix (i.e., 2, 5-dihydroxybenzoic acid (DHB)) [14], while 1,8-bis(dimethylamino) naphthalene (DMAN) as highly basic matrix is usually employed for the detection of FAs and phospholipids in negative ion mode [15, 16], with a limited amount of time after its application under high vacuum condition. In addition, peak intensities detected using MALDI-MS are usually normalized to quantify relatively each detected species.
To investigate the associations of lipid phenotypes with six lung cancer cell lines (A549, H1650, and H1975 from adenocarcinoma, H157 and H1703 from squamous cell carcinomas, and H460 from a large cell carcinoma), MALDI-Fourier transform ion cyclotron resonance mass spectrometry (MALDI-FTICR MS) was performed to profile their membrane lipids. Two matrixes (DHB and DMAN) were used to coat on the cell samples, respectively, and the detected membrane lipids including PEs, PIs, SPLs, PCs, PAs, and FAs have significantly different distributions among six lung cancer cell lines.
Materials and Methods
Cell lines and culture
Human lung cancer cell lines (A549, H157, H1650, H1703, H1975, and H460) were obtained from the Cell Resource Center, Chinese Academy of Medical Sciences. Cells were cultivated in Roswell Park Memorial Institute 1640 media supplemented with 10% fetal bovine serum, 100 U/mL penicillin, and 100 mg/mL streptomycin. A conductive indium tin oxide (ITO)-coated glass slide was placed at the bottom of each 100-mm culture dish before cells were seeded. Cells were grown at 37℃ in 5% CO2 atmosphere, followed by incubating until 80% confluence.
Cell sample preparation
The cell-coated glass slides were washed with phosphate buffer saline three times and then were air-dried at room temperature. Matrix deposition was performed as previously described [7]. Briefly, approximately 4 mg of DHB or 8 mg of DMAN was coated homogeneously on the surface of each cell-coated slide using a sublimation device and then for mass spectrometric analysis in positive or negative ion mode. Matrix-coated slides were placed at -20 °C for 30 min for matrix re-crystallization in a Petri dish (100 mm diameter × 15 mm depth), followed by parallelly placing the cold slide and a piece of filter paper wetted totally with methanol/water (1:1, v/v) at the bottom of the Petri dish for approximately 3 min at room temperature to re-crystallize the deposited matrix.
Mass spectrometric analysis
Lipid profiling was performed using a 9.4 T Apex-ultraTM hybrid Qh-FTICR mass spectrometer (Bruker Daltonics, Billerica, MA, USA) equipped with a 200 Hz, 355 nm Nd:YAG laser. In positive ion mode, Instrument calibration was performed using a phospholipid mixture (PC 24:0 at m/z 622.44423, PC 32:0 at m/z 734.56943, PC 36:0 at m/z 790.63203, and PC 44:2 at m/z 898.72593 from Avanti Polar Lipids, Inc.), and mass spectra were obtained over the m/z range of 500 ~1000. Three commercially available standard FAs (C16:0 at m/z 255.23296, C18:0 at m/z 283.26425, and C22:6 at m/z 327.23294 from Sigma-Aldrich) with the ESI Tuning Mix (Part No. G2432A, Agilent Technology, Inc.) were used for instrument calibration over the m/z range of 100~1000 in negative ion mode. For data acquisition, a mass spectrum was accumulated in broadband mode by three full scans once with 100 laser shots using 1Mb data points over the above-mentioned ranges in the positive and negative ion modes, respectively. Ten mass spectra were randomly collected over a whole slide. All spectra were acquired using ApexControl 3.0.0 (Bruker Daltonics).
Data handling and statistical analysis
Raw MS data were processed with DataAnalysis 4.0 (Bruker Daltonics). Peaks with signal-to-noise ratio of > 5, relative intensity of > 0.1%, and absolute intensity of > 10,000 were selected as reliable variables. After isotopic deconvolution, monoisotopic peaks among different samples were aligned within a narrow mass tolerance window (±0.001 Da) as a single variable, and their individual intensities were obtained. The resulting data were subsequently exported to Microsoft Excel and the peaks from [M+H]+, [M+Na]+, and [M+K]+ ions in the positive ion mode were further combined as one variable. Peaks detected less than two-thirds of six lung cancer cell lines were excluded. The half of the baseline intensity in each spectrum was adopted as their intensities of missing peaks. The intensities of lipids (or variables) from each mass spectrum were normalized to a constant number of 1000. Resulting datasets in the positive and negative ion modes from each cancer cell line were combined into one dataset before statistical analyses.
Partial least-square discriminant analysis (PLS-DA) was performed to evaluate differences among six lung cancer cell lines. On the basis of variables (or lipids) with variable importance in the projection (VIP) values of > 1.0 in the PLS-DA model, lipids responsible for distinguishing between different cell lines were obtained. Then univariate analysis was performed to validate statistical significance in the above-mentioned lipids using non-parametric Wilcoxon-Mann-Whitney test. Moreover, based on the detected lipids with different saturation, correlation and cluster analysis were used to analyze the correlation between saturated and unsaturated lipids among six cancer cell lines. Statistical analyses were performed using SAS software (version 9.2, SAS Institute Inc., Cary, NC) and SPSS software (version 12.0, SPSS Inc., Chicago, IL). A p value < 0.05 was considered to be statistically significant.
Structural identification of lipids of interest
The lipids of interest were identified as previously described [7, 17]. Briefly, significantly different lipids were searched against the Lipid maps (http://www.lipidmaps.org/) or the METLIN database (http://metlin.scripps.edu/), with a mass tolerance of < 2 ppm and the relative intensity error of isotopic peaks < 5%. The collision-induced dissociation was selected to obtain tandem mass spectra of the lipids of interest.
Results and Discussion
Direct lipid profiling of lung cancer cell lines
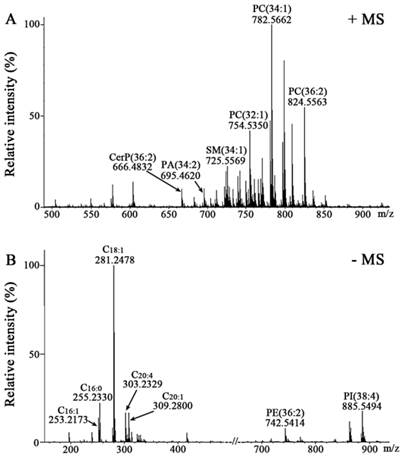
Membrane lipids are central to the regulation and control of cellular function and disease. Different lipid composition in cell membranes can affect cell behaviour such as phagocytosis and signaling cascades [18]. Due to the diversity and complexity of lipids, lipid analysis usually contains many steps including lipid extraction, MS-based analysis, and data processing using bioinformatics tools [9]. In this study, we have employed a rapid and relatively simple procedure to directly analyze intact cell samples avoiding extraction and/or separation of lipids. Representative mass spectra of two cell-coated slides from H1703 cancer cell line were acquired in the positive (Figure 1A) and negative ion modes (Figure 1B), respectively. Compared with Raman micro-spectroscopy and nuclear magnetic resonance spectroscopy which can only analyze and diagnose a group of lipids [19-21], MALDI-FTICR MS could in situ detect simultaneously many lipid species. After ion combination and intensity normalization, a total of 230 variables (146 in the positive ion mode and 84 in the negative ion mode) were selected for further statistical analyses.
Mass spectra of membrane lipids of H1703 cells. Positive ion mass spectrum of H1703 cells coated with DHB (A) and negative ion mass spectrum of H1703 cells coated with DMAN (B).
Discrimination among six lung cancer cell lines
PLS-DA score plot revealed the obvious separation trends among six lung cancer cell lines (A549, H157, H1650, H1703, H1975, and H460) with the Predicted Residual Sum of Square (PRESS) score of 0.1974 (Figure 2A). Six distinct clusters are observed based on the above-mentioned variables among six cell lines. H1975 (adenocarcinoma) and H1703 (squamous cell carcinoma) cells are located in the upper right hand quadrant, H460 (large cell undifferentiated carcinoma) cell line is located in the lower right hand quadrant, A549 (adenocarcinoma) and H157 (squamous cell carcinoma) cells are located in the lower left hand quadrant, and H1650 (adenocarcinoma) cell line is located in the upper left hand quadrant. Characterization of genetic status has showed that A549 cells are epidermal growth factor receptor (EGFR) wild-type and K-ras proto-oncogene mutants, but both H1650 and H1975 cells are EGFR mutants and K-ras wild-type. H157 and H460 cells are EGFR wild-type and K-ras mutants, while H1703 cells are EGFR and K-ras wild-type [22-24]. A total of 43 lipids with VIP values of >1.0 are contributed to differentiate these cancer cell lines in this PLS-DA model. In order to identify the above-mentioned lipids, collision-induced dissociation experiment was implemented to get fragment information. Fifteen lipids (i.e., PE 18:0_18:1, PI 18:0_20:4, SM 42:2, PE 16:0_20:4, PE 36:2, PC 36:2, SM 34:1, PA 38:3,C18:0, C22:4, PA 34:2, C20:5, C20:2, C18:2, and CerP 36:2) were identified (Figure 2B and Supplementary Table S1).
Differentiation of six lung cancer cell lines based on change in the levels of their membrane lipids. (A) PLS-DA model analysis of 230 variables to differentiate six different lung cancer cell lines (A549, H1650, H1975, H157, H1703, and H460). (B) Changes in expression levels of fifteen lipids (i.e., PE 18:0_18:1, PI 18:0_20:4, SM 42:2, PE 16:0_20:4, PE 36:2, PC 36:2, SM 34:1, PA 38:3,C18:0, C22:4, PA 34:2, C20:5, C20:2, C18:2, and CerP 36:2) with VIP values of > 1.0 for six lung cancer cells.
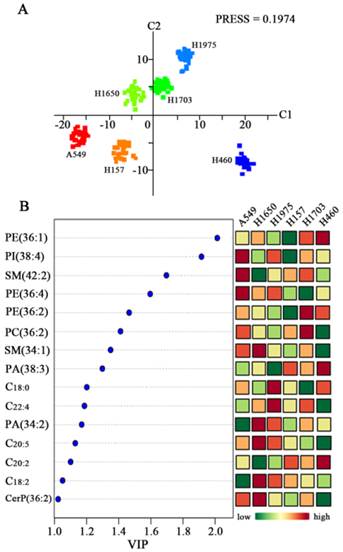
These 15 common lipids can be classified into six categories of lipids (PEs, PIs, SPLs, PCs, PAs, and FAs), most of which are polyunsaturated species. Their relative abundance is significantly different among six cancer cell lines (Figure 2B and Supplementary Figure S1). Significantly increased levels of PI 18:0_20:4, SM 42:2, and PE 16:0_20:4 and decreased levels of PA 34:2 and C18:2 in A549 cells relative to other cancer cells were observed. Significantly increased levels of SM 34:1, PA 34:2, C20:5, C18:2, and CerP 36:2 and decreased levels of SM 42:2 and C20:2 in H1650 cells relative to other cancer cells were observed. The levels of C18:0 and C22:4 in H1975 cells relative to other cancer cells were significantly increased, and PA 38:3 level was obviously decreased. Interestingly, only decreased levels of PE 18:0_18:1, PI 18:0_20:4, and PE 36:2 in H157 cells relative to other cancer cells were observed. The levels of PE 36:2 and PC 36:2 in H1703 cells relative to other cancer cells were obviously increased, and the levels of PE 16:0_20:4 and C18:0 were decreased. The levels of PE 18:0_18:1, PA 38:3 and C20:2 in H460 cells relative to other cancer cells were significantly increased, and decreased levels of PC 36:2, SM 34:1, C22:4, C20:5, and CerP 36:2 were obviously observed. Statistically significant differences (p values) in the levels of these lipids between six cancer cell lines are listed in Supplementary Table S2. Previous study indicated that significantly decreased levels of serum polyunsaturated FAs (PUFAs, C18:3, C18:2, C20:4, and C22:6) were observed in cancer patients compared with healthy controls [25]. Dietary PUFAs and long-chain n-3 FAs as assessed by the Healthy Eating Index 2005 are positively associated with lung health [26]. Increased intake of n-3 PUFAs, such as C20:5 and C22:6 , can influence the cellular properties, activities and pathways against the inflammation and neoplastic disorders of lung [27]. In this study, significant differences in the levels of PUFAs (i.e., C22:4, C20:5, C20:2, and C18:2) among six cancer cell lines were observed (Figure 2B). For example, the levels of these PUFAs are significantly different in three adenocarcinoma cell lines (A549, H1650, and H1975) (p < 0.001; Supplementary Table S2), which may provide some clues to perform personalized treatment and/or medicine for the patients with lung cancer.
Correlation and cluster analysis of characteristic lipids in different lung cancer cell lines
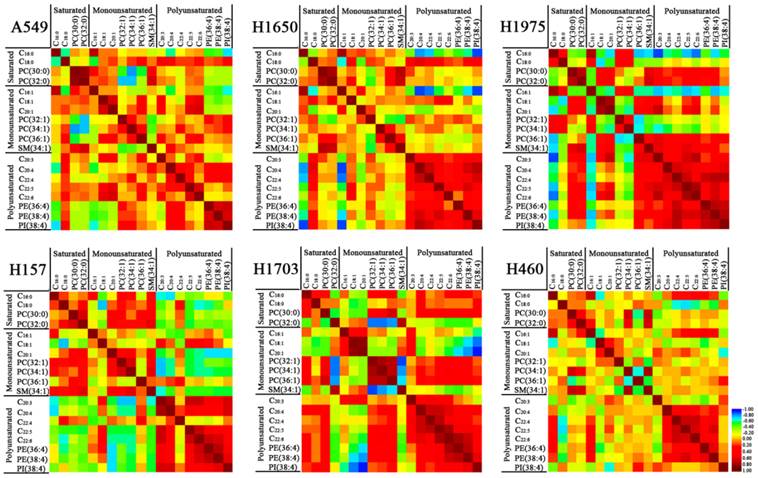
To confirm the correlation of lipid expression with specific fatty acyl chains and saturation in lung cancer cell lines, Spearman correlation analysis was performed to explore their relationships. For lung adenocarcinoma A549 cells (Figure 3), C16:0 and C16:1 were negatively correlated with polyunsaturated phospholipids (PE 16:0_20:4, PE 38:4, and PI 18:0_20:4). Saturated PCs (PC 30:0 and PC 32:0) were significantly negatively correlated with MUPCs (i.e., PC 32:1 and PC 34:1), but positively correlated with SM 34:1. MUFAs (i.e., C18:1 and C20:1) were positively correlated with PC 36:1 and PUFAs (C20:3, C22:5, and C22:6). PUFAs (i.e., C20:4 and C22:4) were positively correlated with polyunsaturated phospholipids (PE 16:0_20:4, PE 38:4, and PI 18:0_20:4). For lung adenocarcinoma H1650 and H1975 cells, C16:0 and C16:1 were negatively correlated with polyunsaturated species (i.e., C20:3, C20:4, C22:4, C22:5, PE 16:0_20:4, PE 38:4, and PI 18:0_20:4). The positive correlations between PUFAs and polyunsaturated phospholipids became more significant in these two cell lines. Especially in H1975 cells, C20:4, C22:4, C22:5, and C22:6 were significantly positively correlated with PE 16:0_20:4, PE 38:4, and PI 18:0_20:4 (r > 0.45, p < 0.01) (Figure 3 and Supplementary Tables S3-8). C18:0 was significantly positively correlated with C20:3, C20:4, and PI 18:0_20:4 in both A549 and H1650 cells, while PC 30:0 and PC 32:0 in H1975 cells were positively correlated with C18:1, C20:1, SM 34:1, C20:3, C22:5, and C22:6. For squamous cell carcinoma H157 cells, PC 32:1 and PC 34:1 were positively correlated with C20:1 and SM 34:1, but negatively correlated with polyunsaturated species (i.e., C20:3, C20:4, C22:5, C22:6, PE 16:0_20:4, PE 38:4, and PI 18:0_20:4). PUFAs (i.e., C20:3 and C22:5) were negatively correlated with saturated species (i.e., C16:0, C18:0, and PC 32:0) while positively correlated with PE 16:0_20:4, PE 38:4, and PI 18:0_20:4. These polyunsaturated phospholipids were negatively correlated with monounsaturated species (i.e., C20:1, PC 32:1, PC 34:1, and SM 34:1). For H1703 cells, C18:1 and C20:1 were negatively correlated with C18:0, PC 30:0, C20:4, C22:6, PE 16:0_20:4, PE 38:4, and PI 18:0_20:4. However, PC 32:1, PC 34:1, and PC 36:1 were positively correlated with PC 30:0, C22:6, PE 16:0_20:4, and PE 38:4. In addition, these MUPCs were negatively correlated with PC 32:0 and SM 34:1, and PUFAs (i.e., C20:4, C22:4, C22:5, and C22:6) were positively correlated with PE 16:0_20:4 and PE 38:4. For large cell carcinoma H460 cells, there were no obvious correlations among the above-mentioned lipids, except that C22:4, C22:5, and C22:6 were positively correlated with PE 16:0_20:4 and PE 38:4. Recent studies suggested that aberrant lipid metabolism is involved in human lung carcinogenesis [17, 28, 29] and PEs are required for completion of cytokinesis [30]. In this study, PE 16:0_20:4 and PE 38:4, which were positively correlated with PUFAs (C20:3, C20:4, and C22:4), especially in H1650 and H1975 cells (Figure 3), may indicate that these PUFAs and short fatty acid chains (i.e., C16:1, C16:0, C18:1 or C18:0) as precursors were esterified to the synthesis of PE 16:0_20:4 and PE 38:4.
Correlation between membrane lipids in each of six different lung cancer cell lines. Red represents positive correlation and blue represents negative correlation. The detailed information on the correlation coefficient (r) and p values are listed in Electronic Supplementary Material Table S3-8.
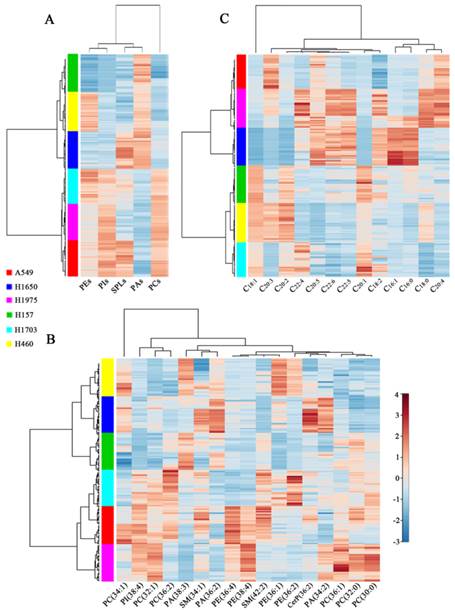
The hierarchical cluster analysis of the lipid expression for each cell line was portrayed as a heat map according to similarity measure. As shown in Figure 4A, two branches of cell lines were produced based on the expression of five kinds of phospholipids (PEs, PIs, SPLs, PAs, and PCs). One branch clustered three cell lines (H157, H460, and H1650) with the high expression levels of PAs and low expression levels of PEs, PIs, SPLs, and PCs. Other branch clustered H1703 and two adenocarcinoma cell lines (H1975, and A549) with the high expression levels of phospholipids, except PAs. PAs may serve as precursors for the synthesis of glycerol phospholipids (including PCs, PEs, and PIs) and as second messengers involved in cellular signaling [31, 32]. These two branches of cell lines were still obtained when the phospholipids were classified according to the specific species (Figure 4B). The distinct profiles of 17 common lipids (PC 34:1, PI 18:0_20:4, PC 32:1, PC 36:2, PA 38:3, SM 34:1, PA 36:2, PE 16:0_20:4, PE 38:4, SM 42:2, PE 18:0_18:1, PE 36:2, CerP 36:2, PA 34:2, PC 36:1, PC 32:0, and PC 30:0) were characterized by several subgroups. For example, SM 34:1, PA 36:2, and PA 38:3 as a cluster can be used to classify different lung cancer cell lines. It has been shown that SM 34:1 and PA 36:3 as a panel can be used to distinguish between malignant and benign thyroid tumors [33]. PC 36:1, PC 32:0, and PC 30:0 as a cluster were generally expressed at low levels in H460 and H1650 cell lines while at high levels in H1975 cells. Moreover, a heat map of the expression pattern of 13 FAs can also be used to discriminate different cell lines (Figure 4C). Three adenocarcinoma cell lines (A549, H1650, and H1975) as a cluster expressed low levels of C18:1, C20:1, and C20:2 and high levels of C20:5 and C22:6.
Hierarchical cluster analysis of membrane lipids of six different lung cancer cell lines. Changes in expression levels of five kinds of lipid species (PEs, PIs, SPLs, PAs, and PCs) (A), 17 common lipids (B), and 13 fatty acids (FAs) (C) in six lung cancer cell lines.
In addition, it should be noted that the shortage in this study is that a comparison of normal lung cell and six NSCLC cell lines was not performed due to the poor-cultivation status of normal lung cancer cell (BEAS-2B cell line).
Conclusions
This study has demonstrated that MALDI-MS combined with multivariate statistical analysis is able to detect cell type-specific membrane lipids. Alterations in the levels of the detected membrane lipids including PEs, PIs, SPLs, PCs, PAs, and FAs can help to differentiate and classify lung cancer cells, which may be associated with lung cancer cell phenotypes.
Supplementary Material
Supplementary tables and figures.
Acknowledgements
This study was supported by the National Natural Science Foundation of China (Grant no. 91542101) to Z. Li.
Conflict of interest
None of the authors have conflict of interest to declare.
References
1. Pavlou MP, Diamandis EP. The cancer cell secretome: a good source for discovering biomarkers? J Proteomics. 2010;73:1896-1906
2. Siegel R, Ma J, Zou Z, Jemal A. Cancer statistics, 2014. CA Cancer J Clin. 2014;64:9-29
3. German JB, Gillies LA, Smilowitz JT, Zivkovic AM, Watkins SM. Lipidomics and lipid profiling in metabolomics. Curr Opin Lipidol. 2007;18:66-71
4. Menendez JA, Lupu R. Fatty acid synthase and the lipogenic phenotype in cancer pathogenesis. Nat Rev Cancer. 2007;7:763-777
5. Zaidi N, Lupien L, Kuemmerle NB, Kinlaw WB, Swinnen JV, Smans K. Lipogenesis and lipolysis: the pathways exploited by the cancer cells to acquire fatty acids. Prog Lipid Res. 2013;52:585-589
6. Balgoma D, Checa A, Sar DG, Snowden S, Wheelock CE. Quantitative metabolic profiling of lipid mediators. Mol Nutr Food Res. 2013;57:1359-1377
7. Guo S, Wang Y, Zhou D, Li Z. Significantly increased monounsaturated lipids relative to polyunsaturated lipids in six types of cancer microenvironment are observed by mass spectrometry imaging. Sci Rep. 2014;4:5959
8. Doria ML, Cotrim CZ, Simoes C, Macedo B, Domingues P, Domingues MR, Helguero LA. Lipidomic analysis of phospholipids from human mammary epithelial and breast cancer cell lines. J Cell Physiol. 2013;228:457-468
9. Li L, Han J, Wang Z, Liu J, Wei J, Xiong S, Zhao Z. Mass spectrometry methodology in lipid analysis. Int J Mol Sci. 2014;15:10492-10507
10. Cajka T, Fiehn O. Comprehensive analysis of lipids in biological systems by liquid chromatography-mass spectrometry. Trends Analyt Chem. 2014;61:192-206
11. Zhao YY, Wu SP, Liu S, Zhang Y, Lin RC. Ultra-performance liquid chromatography-mass spectrometry as a sensitive and powerful technology in lipidomic applications. Chem Biol Interact. 2014;220:181-192
12. Han X, Yang K, Gross RW. Multi-dimensional mass spectrometry-based shotgun lipidomics and novel strategies for lipidomic analyses. Mass Spectrom Rev. 2012;31:134-178
13. Pirman DA, Efuet E, Ding XP, Pan Y, Tan L, Fischer SM, DuBois RN, Yang P. Changes in cancer cell metabolism revealed by direct sample analysis with MALDI mass spectrometry. PLoS One. 2013;8:e61379
14. Ellis SR, Brown SH, In Het Panhuis M, Blanksby SJ, Mitchell TW. Surface analysis of lipids by mass spectrometry: more than just imaging. Prog Lipid Res. 2013;52:329-353
15. Shroff R, Svatos A. 1,8-Bis(dimethylamino)naphthalene: a novel superbasic matrix for matrix-assisted laser desorption/ionization time-of-flight mass spectrometric analysis of fatty acids. Rapid Commun Mass Spectrom. 2009;23:2380-2382
16. Calvano CD, Zambonin CG, Palmisano F. Lipid fingerprinting of gram-positive lactobacilli by intact-matrix-assisted laser desorption/ionization mass spectrometry using a proton sponge based matrix. Rapid Commun Mass Spectrom. 2011;25:1757-1764
17. Guo Y, Wang X, Qiu L, Qin X, Liu H, Wang Y, Li F, Chen G, Song G, Guo S, Li Z. Probing gender-specific lipid metabolites and diagnostic biomarkers for lung cancer using Fourier transform ion cyclotron resonance mass spectrometry. Clin Chim Acta. 2012;414:135-141
18. van Meer G, Voelker DR, Feigenson GW. Membrane lipids: where they are and how they behave. Nat Rev Mol Cell Biol. 2008;9:112-124
19. Tolstik T, Marquardt C, Matthaus C, Bergner N, Bielecki C, Krafft C, Stallmach A, Popp J. Discrimination and classification of liver cancer cells and proliferation states by Raman spectroscopic imaging. Analyst. 2014;139:6036-6043
20. Nieva C, Marro M, Santana-Codina N, Rao S, Petrov D, Sierra A. The lipid phenotype of breast cancer cells characterized by Raman microspectroscopy: towards a stratification of malignancy. PLoS One. 2012;7:e46456
21. Al-Saffar NM, Marshall LV, Jackson LE, Balarajah G, Eykyn TR, Agliano A, Clarke PA, Jones C, Workman P, Pearson AD, Leach MO. Lactate and choline metabolites detected in vitro by nuclear magnetic resonance spectroscopy are potential metabolic biomarkers for PI3K inhibition in pediatric glioblastoma. PLoS One. 2014;9:e103835
22. Janmaat ML, Rodriguez JA, Gallegos-Ruiz M, Kruyt FA, Giaccone G. Enhanced cytotoxicity induced by gefitinib and specific inhibitors of the Ras or phosphatidyl inositol-3 kinase pathways in non-small cell lung cancer cells. Int J Cancer. 2006;118:209-214
23. Sudo M, Chin TM, Mori S, Doan NB, Said JW, Akashi M, Koeffler HP. Inhibiting proliferation of gefitinib-resistant, non-small cell lung cancer. Cancer Chemother Pharmacol. 2013;71:1325-1334
24. Yoon YK, Kim HP, Han SW, Oh do Y, Im SA, Bang YJ, Kim TY. KRAS mutant lung cancer cells are differentially responsive to MEK inhibitor due to AKT or STAT3 activation: implication for combinatorial approach. Mol Carcinog. 2010;49:353-362
25. Zhang Y, He C, Qiu L, Wang Y, Zhang L, Qin X, Liu Y, Zhang D, Li Z. Serum unsaturated free Fatty acids: potential biomarkers for early detection and disease progression monitoring of non-small cell lung cancer. J Cancer. 2014;5:706-714
26. Root MM, Houser SM, Anderson JJ, Dawson HR. Healthy Eating Index 2005 and selected macronutrients are correlated with improved lung function in humans. Nutr Res. 2014;34:277-284
27. Fasano E, Serini S, Piccioni E, Innocenti I, Calviello G. Chemoprevention of lung pathologies by dietary n-3 polyunsaturated fatty acids. Curr Med Chem. 2010;17:3358-3376
28. Cerne D, Zitnik IP, Sok M. Increased fatty acid synthase activity in non-small cell lung cancer tissue is a weaker predictor of shorter patient survival than increased lipoprotein lipase activity. Arch Med Res. 2010;41:405-409
29. Deja S, Porebska I, Kowal A, Zabek A, Barg W, Pawelczyk K, Stanimirova I, Daszykowski M, Korzeniewska A, Jankowska R, Mlynarz P. Metabolomics provide new insights on lung cancer staging and discrimination from chronic obstructive pulmonary disease. J Pharm Biomed Anal. 2014;100:369-380
30. Emoto K, Umeda M. An essential role for a membrane lipid in cytokinesis. Regulation of contractile ring disassembly by redistribution of phosphatidylethanolamine. J Cell Biol. 2000;149:1215-1224
31. Athenstaedt K, Daum G. Phosphatidic acid, a key intermediate in lipid metabolism. Eur J Biochem. 1999;266:1-16
32. English D, Cui Y, Siddiqui RA. Messenger functions of phosphatidic acid. Chem Phys Lipids. 1996;80:117-132
33. Guo S, Qiu L, Wang Y, Qin X, Liu H, He M, Zhang Y, Li Z, Chen X. Tissue imaging and serum lipidomic profiling for screening potential biomarkers of thyroid tumors by matrix-assisted laser desorption/ionization-Fourier transform ion cyclotron resonance mass spectrometry. Anal bioanal chem. 2014;406:4357-4370
Author contact
![]() Corresponding author: Dr. Zhili Li, Department of Biophysics and Structural Biology, Institute of Basic Medical Sciences, Chinese Academy of Medical Sciences & School of Basic Medicine, Peking Union Medical College, 5 Dongdan San Tiao, Beijing 100005, PR China. Tel/Fax: +86-10-69156479 E-mail: lizhilipumc.edu.cn.
Corresponding author: Dr. Zhili Li, Department of Biophysics and Structural Biology, Institute of Basic Medical Sciences, Chinese Academy of Medical Sciences & School of Basic Medicine, Peking Union Medical College, 5 Dongdan San Tiao, Beijing 100005, PR China. Tel/Fax: +86-10-69156479 E-mail: lizhilipumc.edu.cn.