Impact Factor ISSN: 1837-9664

 Global reach, higher impact
J Cancer 2016; 7(11):1452-1464. doi:10.7150/jca.15860 This issue Cite
Research Paper
Proteomic Upregulation of Fatty Acid Synthase and Fatty Acid Binding Protein 5 and Identification of Cancer- and Race-Specific Pathway Associations in Human Prostate Cancer Tissues
Jennifer S. Myers1, Ariana K. von Lersner1, Qing-Xiang Amy Sang1,2 ![]()
1. Department of Chemistry & Biochemistry, Florida State University, Tallahassee, FL, USA.
2. Institute of Molecular Biophysics, Florida State University, Tallahassee, FL, USA.
Received 2016-4-16; Accepted 2016-5-23; Published 2016-7-5
Abstract
Protein profiling studies of prostate cancer have been widely used to characterize molecular differences between diseased and non-diseased tissues. When combined with pathway analysis, profiling approaches are able to identify molecular mechanisms of prostate cancer, group patients by cancer subtype, and predict prognosis. This strategy can also be implemented to study prostate cancer in very specific populations, such as African Americans who have higher rates of prostate cancer incidence and mortality than other racial groups in the United States. In this study, age-, stage-, and Gleason score-matched prostate tumor specimen from African American and Caucasian American men, along with non-malignant adjacent prostate tissue from these same patients, were compared. Protein expression changes and altered pathway associations were identified in prostate cancer generally and in African American prostate cancer specifically. In comparing tumor to non-malignant samples, 45 proteins were significantly cancer-associated and 3 proteins were significantly downregulated in tumor samples. Notably, fatty acid synthase (FASN) and epidermal fatty acid-binding protein (FABP5) were upregulated in human prostate cancer tissues, consistent with their known functions in prostate cancer progression. Aldehyde dehydrogenase family 1 member A3 (ALDH1A3) was also upregulated in tumor samples. The Metastasis Associated Protein 3 (MTA3) pathway was significantly enriched in tumor samples compared to non-malignant samples. While the current experiment was unable to detect statistically significant differences in protein expression between African American and Caucasian American samples, differences in overrepresentation and pathway enrichment were found. Structural components (Cytoskeletal Proteins and Extracellular Matrix Protein protein classes, and Biological Adhesion Gene Ontology (GO) annotation) were overrepresented in African American but not Caucasian American tumors. Additionally, 5 pathways were enriched in African American prostate tumors: the Small Cell Lung Cancer, Platelet-Amyloid Precursor Protein, Agrin, Neuroactive Ligand-Receptor Interaction, and Intrinsic pathways. The protein components of these pathways were either basement membrane proteins or coagulation proteins.
Keywords: Differential protein expression profiles, pathway analysis, fatty acid metabolic process, cytoskeletal proteins, extracellular matrix, prostate cancer health disparity.
Introduction
Prostate cancer afflicts more American men than any other non-cutaneous cancer; only skin cancers are more frequently diagnosed [1]. Proteomic fingerprinting or profiling is frequently used to gain insight into prostate cancer development or to identify putative biomarkers, primarily through differential expression analysis [2-9]. However, a potential deficiency of profiling studies is that they may be hampered by the heterogeneity of prostate cancer, namely the differing tumor biology within individual patients. This can lead to patient-specific variance in differential protein expression between tumor and matched controls [10]. The low reproducibility between profiling studies of differentially expressed molecular markers is also of concern [11, 12]. While a consensus cohort of significant differentially expressed genes can be elucidated from data collected by separate laboratories and across different platforms, the overlap is still low [13]. An alternative approach uses differential expression data to flag changes in biological pathways or groups of functionally-related proteins. Rather than focusing on expression changes of individual genes, this approach considers the cooperative nature of proteins and the co-regulation of proteins involved in the same process. Pathway approaches increase overlap between studies, provide more robust results, effectively classify disease, and highlight core mechanisms of disease that may have otherwise been obscured [14-18].
One area of prostate cancer investigation that may benefit from a pathway-based strategy is in racial health disparities. African ancestry is an established risk factor for developing prostate cancer [19]. Epidemiologic data shows increased prevalence of prostate cancer among African American (AA) men compared to non-Hispanic Caucasian American (CA), Hispanic/Latino, Asian American or Pacific Islander, and American Indian or Alaskan Native men in the United States [19]. A growing body of evidence presents differing pathological and clinical characteristics between tumors in AA and CA patients, including elevated prostate specific antigen levels in AA men [20-23], more high-grade and advanced stage tumors among AA men [24-26], increased tumor burden and volume [27, 28], and increased risk of recurrence in AA patients [29, 30]. Genetic studies have also highlighted differences in molecular biology between AA and CA or European American prostate cancer [31-37]. Prostate cancer health disparities are influenced by socioeconomic indicators (e.g., education, income, employment, marital status, neighborhood, etc.); yet even after controlling for socioeconomic status, treatment and care, age, stage, and grade, reduced survival was still seen in AA men [38-40]. It is hypothesized that pathway analysis may shed light onto the nature of biological variation between AA and CA prostate tumors and its contribution to racial health disparities.
In this case study, we first characterized differential protein expression and differentially expressed pathways in prostate cancer generally. This builds upon previous work that examined differential gene expression and pathways in prostate cancer [41]. Second, because molecular markers differentially expressed between cancer and non-malignant samples may not be differentially expressed between races [37], we have attempted to identify differing patterns of protein expression and pathway activation in prostate cancer by race. While, proteomics-based profiling methods have been applied to examining racial differences and disparities in various cancers [42-44], to the best of our knowledge, very few studies have completed a global proteomic profile of AA prostate tumors. Fewer have taken an integrated profiling and pathway approach as presented herein.
Materials and Methods
Proteomics analysis
Protein expression in prostate cancer was determined using freshly frozen human prostate tumor tissues obtained from the Cooperative Human Tissue Network (Midwestern Division, Ohio State University, Columbus, OH, USA; Mid-Atlantic Division, University of Virginia, Charlottesville, VA, USA; Southern Division, University of Alabama at Birmingham, Birmingham, AL, USA; Western Division, Vanderbilt University, Nashville, TN, USA) and Meharry Medical College (Nashville, TN, USA). According to pathologist recommendations, specimen were matched by age, stage, and Gleason score, resulting in a collection of fourteen patients, nine of which also had corresponding non-malignant tissue (Table 1). During processing, all tissue was kept cold and handled in an isolated environment. Proteins were extracted into lysis buffer (0.1 M Tris (hydroxymethyl)-aminomethane, pH 7.6 (Sigma, St. Louis, MO, USA), 0.1 M dithiothreitol (Promega, Madison, WI) and 10 µL/mL of HaltTM EDTA-free protease & phosphatase inhibitor cocktail (ThermoScientific, Waltham, MA, USA)) from minced and washed tissue using mechanical homogenization and vigorous mixing. Proteins were further solubilized by heating in the presence of sodium dodecyl sulfate (Sigma, St. Louis, MO, USA). Clarified lysate was desalted and proteins were trypsin-digested in a modified filter-aided sample preparation protocol [45]. In this method, the lysis buffer was exchanged with a series of buffers while simultaneously digesting with mass spectrometry (MS)-grade trypsin (Pierce-Thermo Scientific, Rockford, IL, USA) in a 30,000 molecular weight cutoff spin filter unit (VWR, Radnor, PA). The order of buffer exchange was a follows: 1) urea buffer (8 M urea (Fisher Scientific, Waltham, MA, USA) in 0.1 M Tris, pH 8.5); 2) iodoacetamide buffer (0.05 M iodoacetamide (Amresco, Solon, OH, USA) in urea buffer); and 3) ammonium bicarbonate buffer (0.05 M ammonium bicarbonate (Fluka/Sigma, St. Louis, MO, USA) in water).
Patient clinical data for age-, stage-, and Gleason score-matched prostate tumor tissue samples.
| Characteristic | Tumor (n=14) | Non-malignant (n=9) | Fisher's Exact Test P-value |
|---|---|---|---|
| Race/Ethnicity | 0.669 | ||
| African-American | 7 | 6 | |
| Caucasian-American | 7 | 3 | |
| Age | 0.657 | ||
| <65 | 10 | 5 | |
| ≥ 65 | 4 | 4 | |
| Mean (Range) | 58.7 (48-71) | 60.9 (48-71) | |
| Stage | 0.757 | ||
| pT2a | 3 | 3 | |
| pT2c | 7 | 3 | |
| pT3a | 4 | 3 | |
| Gleason Score | 1 | ||
| 2+3 | 1 | 1 | |
| 3+3 | 7 | 4 | |
| 3+4 | 4 | 2 | |
| 4+3 | 2 | 2 |
Mass Spectrometry
Peptides were detected through mass spectrometry using an externally calibrated high-resolution electrospray tandem Thermo LTQ Orbitrap Velos nLC-ESI-LIT-Orbitrap mass spectrometer. NanoLC-MS/MS was run in technical triplicate to enable normalization and statistical analysis. The nanoLC eluent (2-cm trap column plus 10-cm analytical column in continuous, vented configuration with a 1-hour linear mobile phase gradient from 100% solution A (99.9% H2O and 0.1% formic acid) to 45% solution B (99.9% acetonitrile and 0.1% formic acid)) was directly nanosprayed into an LTQ Orbitrap Velos mass spectrometer (ThermoScientific, Waltham, MA, USA). The mass spectrometry data were acquired using 10 data-dependent collisional-induced-dissociation MS/MS scans per full scan under direct control of the Xcalibur software (ThermoScientific, Waltham, MA, USA). The peptide threshold was 95% confidence and the stringency for proteins was 99% confidence with at least 2 peptide matches. All measurements were performed at room temperature.
Differential Expression Analysis
Protein expression data were obtained from mass spectrometry analysis as spectral counts. The data were processed to sum isoforms for 1:1 matching in pathway analyses, round any non-integer values up to the nearest count, and calculate the magnitude of expression change as the base 2 logarithm (log2) of the ratio of mean spectral counts. To ensure that a log2 ratio could be calculated for each protein, samples with zero expression counts were adjusted by adding one to both the tumor and non-malignant mean. To determine how this impacted the pathway results, the analysis was run multiple times either excluding data with mean expression of zero, transforming each entry, or transforming only those entries with no expression count. There was no real difference in the results, so only those entries with no expression count were transformed. Data processing, statistical calculations, differential expression analysis, and plotting were done in the R statistical programming environment [46]. To determine differential expression, the mean spectral counts between tumor and non-malignant samples for each protein were compared using a two-sided, unpaired Wilcoxon rank sum test. The resulting P-values were adjusted for multiple comparisons correction using the Benjamini-Hochberg false discovery rate (FDR) method. Differentially expressed proteins (DEPs) were defined as proteins differing between two patient groups (non-malignant and tumor, or AA and CA) with at least 90% confidence after FDR correction (Q < 0.1).
Pathway Analyses
The Protein ANalysis THrough Evolutionary Relationships (PANTHER) Classification System and analysis tools (version 10.0, released 2015-05-15, available from http://pantherdb.org) were used to categorize PANTHER Protein Class and Gene Ontology (GO) Molecular Function and Biological Process annotations among DEPs [47]. The PANTHER Overrepresentation Test (released 2015-04-30) was used to search the data against the PANTHER and GO databases (released 2015-05-09) to identify either protein classes or GO annotations that were overrepresented in the data by more than random chance after Bonferroni correction.
Gene Set Enrichment Analysis (GSEA) was used to identify proteins (grouped as gene sets) comparatively enriched between phenotypes of interest [48]. Curated gene sets compiled from BioCarta and Reactome databases were pulled from the GSEA's Molecular Signatures Database. Additionally a custom Kyoto Encyclopedia of Genes and Genomes (KEGG) gene set was tailored from all available human KEGG pathways by removing those least likely to be relevant in human prostate cancer (Table S1). The GSEA analysis tool (version 2.2.0) was downloaded from http://www.broadinstitute.org/gsea/index.jsp. The entire protein expression dataset was loaded into the GSEA application without filtering based on differential expression. Because mapping is done by Entrez ID, putative proteins without Entrez ID were excluded. Gene sets smaller than 5 proteins and gene sets larger than 500 proteins were also excluded from the analysis. The FDR cut-off was relaxed to 25%. Positive enrichment scores correspond to enrichment in the AA samples. Negative enrichment scores correspond to enrichment in the CA samples.
Signaling pathway impact analysis (SPIA) was used to assess the importance of enriched proteins in terms of the impact and contribution to activation or inhibition of a pathway [49]. Pathway significance is derived from the probability that the number of DEPs observed in a pathway is larger than what would be observed at random. This is the probability of overrepresentation. Pathway significance is also derived from the position of DEPs at crucial junctions that can perturb the pathway. This is the probability of perturbation. The overrepresentation and perturbation probabilities are combined into a global probability metric which is adjusted by the FDR. SPIA analysis was accomplished using the R package “SPIA”, using a differential expression cut-off based on the FDR-adjusted Q-value. Before running the SPIA program, up to date KEGG files were downloaded (accessed 7/29/2015). The same relevant KEGG pathways used in GSEA analysis were used for SPIA (Table S1). Because mapping is done by Entrez ID, proteins without Entrez ID were excluded.
Results
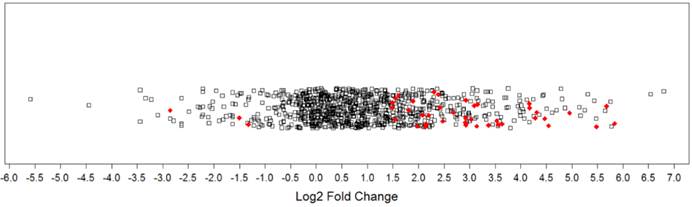
Comparing protein expression between all tumor samples (n=14) and all non-malignant samples (n=9) generated a protein expression profile for prostate cancer. Mass spectrometry identified 1612 proteins, with 1570 remaining after processing (Table S2). There were 48 DEPs (Q< 0.1), with 45 being cancer-associated (i.e., upregulated in tumor samples or detected only in tumor samples) and 3 being associated with the non-malignant condition (i.e., downregulated in tumor samples or detected only in non-malignant samples). More specifically, 41 proteins were significantly upregulated, 4 proteins were uniquely detected in tumor samples, 3 proteins were significantly downregulated in tumor samples, and no proteins were uniquely detected in the non-malignant samples. The distribution of log2 fold changes for all proteins was plotted in a 1-D scatter plot (Figure 1). Fold-changes for both upregulated and downregulated proteins were approximately 3-fold or greater (log2 ratio ≥ ± 1.5). A selection of these DEPs is presented in Table 2 and the full listing of DEPs can be found in the Supplementary Materials (Table S3).
Magnitude of protein expression changes between matched tumor and non-malignant human prostate tissues. In this one-dimensional scatter plot, the magnitudes of protein expression changes are represented by log2 fold ratios. Red diamonds represent differentially expressed proteins at a false discovery rate of 10%. Black squares denote other proteins detected that did not reach significance.
Selected differentially expressed proteins in human prostate tumors compared to non-malignant samples.
| Protein | Gene | Log2 | P-value | Q-value |
|---|---|---|---|---|
| Upregulated in Tumor | ||||
| 2,4-dienoyl-CoA reductase, mitochondrial | DECR1 | 5.84 | 1.72E-03 | 6.28E-02 |
| Aldehyde dehydrogenase family 1 member A3 | ALDH1A3 | 5.48 | 1.15E-03 | 5.00E-02 |
| Growth/differentiation factor 15 | GDF15 | 5.27 | 8.81E-06 | 4.17E-03 |
| Fatty acid-binding protein, epidermal | FABP5 | 4.82 | 2.35E-05 | 5.27E-03 |
| ADP-ribosylation factor-like protein 1 | ARL1 | 4.55 | 6.35E-04 | 4.36E-02 |
| Nucleobindin-1 | NUCB1 | 4.47 | 2.95E-04 | 2.90E-02 |
| T-complex protein 1 subunit theta | CCT8 | 4.32 | 7.83E-04 | 4.36E-02 |
| T-complex protein 1 subunit gamma | CCT3 | 4.29 | 9.08E-05 | 1.30E-02 |
| Lysosomal alpha-glucosidase | GAA | 4.07 | 1.26E-05 | 4.17E-03 |
| Fatty acid synthase | FASN | 3.62 | 1.33E-05 | 4.17E-03 |
| Coatomer subunit epsilon | COPE | 3.53 | 1.50E-03 | 5.84E-02 |
| Transcription intermediary factor 1-beta | TRIM28 | 3.52 | 8.18E-06 | 4.17E-03 |
| Complement component 1 Q subcomponent-binding protein, mitochondrial | C1QBP | 3.37 | 6.81E-04 | 4.36E-02 |
| T-complex protein 1 subunit delta | CCT4 | 3.35 | 3.00E-03 | 9.82E-02 |
| Endoplasmic reticulum resident protein 29 | ERP29 | 3.16 | 2.94E-04 | 2.90E-02 |
| T-complex protein 1 subunit zeta | CCT6A | 2.96 | 1.91E-03 | 6.65E-02 |
| Non-specific lipid-transfer protein | SCP2 | 2.95 | 1.52E-03 | 5.84E-02 |
| Elongation factor 1-delta | EEF1D | 2.93 | 7.53E-04 | 4.36E-02 |
| Methylcrotonoyl-CoA carboxylase beta chain, mitochondrial | MCCC2 | 2.93 | 4.22E-06 | 4.17E-03 |
| Lysosome-associated membrane glycoprotein 1 | LAMP1 | 2.92 | 6.71E-04 | 4.36E-02 |
| Downregulated in Tumor | ||||
| Keratin, type I cytoskeletal 17 | KRT17 | -1.33 | 1.21E-03 | 5.00E-02 |
| Keratin, type II cytoskeletal 7 | KRT7 | -1.50 | 1.91E-05 | 5.01E-03 |
| EGF-containing fibulin-like extracellular matrix protein 1 | EFEMP1 | -2.85 | 7.28E-04 | 4.36E-02 |
| Uniquely Detected in Tumor | ||||
| Golgi membrane protein 1 | GOLM1 | 1.97 | 1.12E-04 | 1.47E-02 |
| Heme-binding protein 2 | HEBP2 | 1.75 | 5.77E-04 | 4.36E-02 |
| Ribonuclease T2 | RNASET2 | 1.61 | 9.70E-04 | 4.91E-02 |
| Protein transport protein Sec23B | SEC23B | 1.39 | 1.61E-03 | 6.01E-02 |
Upregulated proteins with the largest fold change in expression are presented along with all downregulated and uniquely detected proteins. The Log2 fold change is the base 2 logarithm of the ratio of mean tumor expression to mean non-malignant expression.
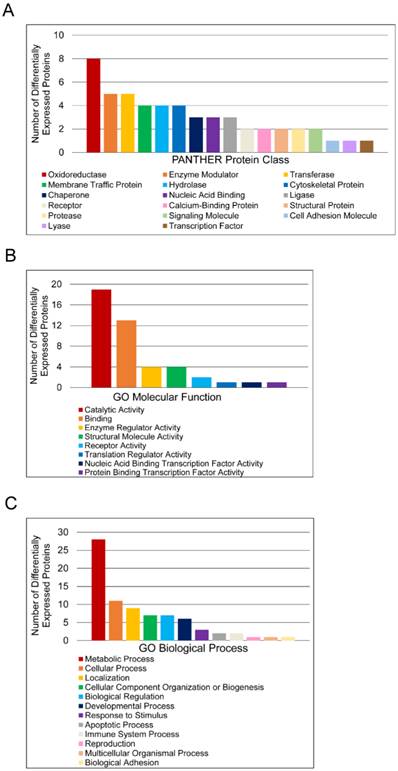
To further characterize molecular differences arising in prostate cancer, DEPs were sorted according to PANTHER database protein class and Gene Ontology (GO) Molecular Function and Biological Process annotations (Figure 2). Only one DEP, T-complex protein 1 subunit delta, had no annotations and was thus excluded from analysis. The protein classes “Oxidoreductase”, “Enzyme Modulator”, “Transferase”, “Membrane Traffic Protein”, and “Hydrolase” were the most abundant categories (Figure 2A). The label “Oxidoreductase” covered dehydrogenases, reductases, and oxidases. “Enzyme Modulator” includes G-protein modulators, phosphatase modulators, protease inhibitors, and G-proteins. “Transferase” covered glycosyltransferases, methyltransferases, acyltransferases, and acetyltransferases. “Membrane Traffic Protein” included vesicle coat proteins and membrane trafficking regulatory proteins, while “Hydrolase” included esterases, proteases, and glucosidases. “Catalytic Activity” and “Binding” were the predominant GO Molecular Function annotations (Figure 2B). The “Catalytic Activity” heading included oxidoreductase, hydrolase, transferase, enzyme regulation, ligase, and lyase activity. The “Binding” category encompassed protein binding, nucleic acid binding, calcium ion binding, and calcium-dependent phospholipid binding. Most proteins in this category were protein binding, which was more than twice as common as nucleic acid binding. The other 6 molecular function annotation groups—enzyme regulator activity, nucleic acid binding transcription factor activity, protein binding transcription factor activity, receptor activity, structural molecule activity, and translation regulator activity—had no more than 4 assignments each. The largest GO Biological Process categories were “Metabolic Process”, “Cellular Process”, “Localization”, “Cellular Component Organization or Biogenesis”, and “Biological Regulation” (Figure 2C). The “Metabolic Process” annotations included primary metabolic processes such as carbohydrate, lipid, protein, amino acid, and nucloeobase-containing compound metabolism. Mitosis and cell communication proteins were included in the “Cellular Process” group. The “Localization” category contained RNA localization and transport proteins, while the “Biological Regulation” category contained proteins involved in homeostatic processes. To estimate the significance of these categories, the PANTHER overrepresentation test was used (Table 3). For PANTHER protein classes, the analysis showed that the abundance of oxidoreductase annotations represents an overrepresentation in the data.
Functional classification of differentially expressed proteins in matched tumor and non-malignant human prostate tissues. (A) Classification according to PANTHER Protein Class. (B) Classification according to Molecular Function Gene Ontology terms. (C) Classification according to Biological Process Gene Ontology terms.
Overrepresentation of PANTHER protein classes and Gene Ontology annotations among differentially expressed proteins in human prostate tumors.
| Fold Enrichment | Q-value | |
|---|---|---|
| PANTHER Protein Class | ||
| Chaperonin | > 5 | 2.43E-03 |
| Dehydrogenase | > 5 | 4.59E-03 |
| Oxidoreductase | > 5 | 1.24E-02 |
| GO Molecular Function | ||
| Oxidoreductase activity | > 5 | 1.25E-02 |
Overrepresentation was determined by calculating the probability that the number of differentially expressed proteins belonging to a particular category is larger or smaller than what would be expected based on a reference human genome of 20,814 genes. Q-values have been adjusted using a Bonferroni correction.
Next, the data were queried for the enrichment of gene sets and pathways. GSEA was used to determine if any pathways were expressly associated with either the tumor samples or non-malignant samples. GSEA revealed enrichment of the MTA3 (metastasis associated 1 family member 3) pathway in prostate tumor samples (Q = 0.162). Of the 19 proteins comprising this gene set, 7 members were expressed in the dataset with cathepsin D and cadherin 1/E-cadherin contributing to its enrichment. SPIA found no pathways to be significantly activated or inhibited in tumor samples after FDR-correction.
The second aim of this study was to use the integrated profiling and pathway approach to look at racial differences in prostate cancer. No significant differences in protein expression between AA and CA tumors presented at a 10% FDR, but relaxing the threshold to 13% resulted in 22 proteins having significance (Table 4). There were also no significant differences between the non-malignant samples by race (Table S4).
Differences in protein expression between African American and Caucasian American human prostate tumor tissues.
| Identified Proteins | Gene Name | Log2 | P-value | Q-value |
|---|---|---|---|---|
| Phosphoacetylglucosamine mutase | PGM3 | -5.46 | 2.97E-04 | 1.07E-01 |
| Pyrroline-5-carboxylate reductase 1, mitochondrial | PYCR1 | -2.38 | 2.98E-04 | 1.07E-01 |
| Lysosomal alpha-glucosidase | GAA | -2.10 | 2.11E-04 | 1.07E-01 |
| Heterogeneous nuclear ribonucleoprotein M | HNRNPM | -1.63 | 2.81E-04 | 1.07E-01 |
| Transaldolase | TALDO1 | -1.17 | 3.52E-04 | 1.07E-01 |
| Heterogeneous nuclear ribonucleoprotein L | HNRNPL | -1.13 | 4.00E-04 | 1.07E-01 |
| Gamma-glutamylcyclotransferase | GGCT | -5.78 | 1.64E-03 | 1.26E-01 |
| Pro-cathepsin H | CTSH | -3.91 | 1.64E-03 | 1.26E-01 |
| Puromycin-sensitive aminopeptidase | NPEPPS | -3.70 | 1.66E-03 | 1.26E-01 |
| Ubiquitin carboxyl-terminal hydrolase 5 | USP5 | -3.29 | 1.23E-03 | 1.26E-01 |
| Succinyl-CoA ligase [GDP-forming] subunit beta, mitochondrial | SUCLG2 | -3.08 | 1.32E-03 | 1.26E-01 |
| Beta-hexosaminidase subunit beta | HEXB | -2.97 | 9.89E-04 | 1.26E-01 |
| Protein NDRG1 | NDRG1 | -2.42 | 7.10E-04 | 1.26E-01 |
| Metalloreductase STEAP4 | STEAP4 | -2.36 | 7.12E-04 | 1.26E-01 |
| N(G),N(G)-dimethylarginine dimethylaminohydrolase 2 | DDAH2 | -2.05 | 9.39E-04 | 1.26E-01 |
| Cathepsin D | CTSD | -1.89 | 7.01E-04 | 1.26E-01 |
| Coatomer subunit alpha | COPA | -1.85 | 1.71E-03 | 1.26E-01 |
| GDP-L-fucose synthase | TSTA3 | -1.84 | 1.64E-03 | 1.26E-01 |
| Proteasome subunit beta type-5 | PSMB5 | -1.72 | 1.65E-03 | 1.26E-01 |
| Elongation factor Tu, mitochondrial | TUFM | -1.37 | 1.23E-03 | 1.26E-01 |
| Endoplasmin | HSP90B1 | -1.00 | 1.72E-03 | 1.26E-01 |
| Lipoma-preferred partner | LPP | -0.04 | 1.59E-03 | 1.26E-01 |
The significance threshold was set at 10% FDR, but proteins with Q < 0.13 are shown. The Log2 fold change is the base 2 logarithm of the ratio of mean tumor expression to mean non-malignant expression.
Because no proteins were significantly differentially expressed after FDR correction when AA and CA tumor samples were compared, overrepresentation analysis was used to highlight any qualitative differences between these groups (Figure 3). Without regard for statistical differential expression, proteins with positive log2 fold changes in the tumor/non-malignant comparison were considered upregulated, while those with negative log2 fold changes were considered downregulated. Then, proteins in AA or CA samples were sorted separately. Altered expression of cytoskeletal proteins and nucleic acid binding proteins in AA tumors compared to CA tumors was suggested by the larger percentage of upregulated proteins in these classes in AA tumors coupled with greater downregulation of proteins in these classes in CA tumors (Figure 3A).
Racial comparison of functional classifications of proteins expressed in matched tumor and non-malignant prostate tissue samples. (A & B) Classification according to PANTHER Protein Class. (C & D) Classification according to Molecular Function Gene Ontology terms. (E & F) Classification according to Biological Process Gene Ontology terms. The five most abundant categories are shown. Upregulated and downregulated refers to expression in tumor samples relative to non-malignant samples. AAT = African American tumor, CAT = Caucasian American tumor, AAN = African American non-malignant, CAN = Caucasian American non-malignant.
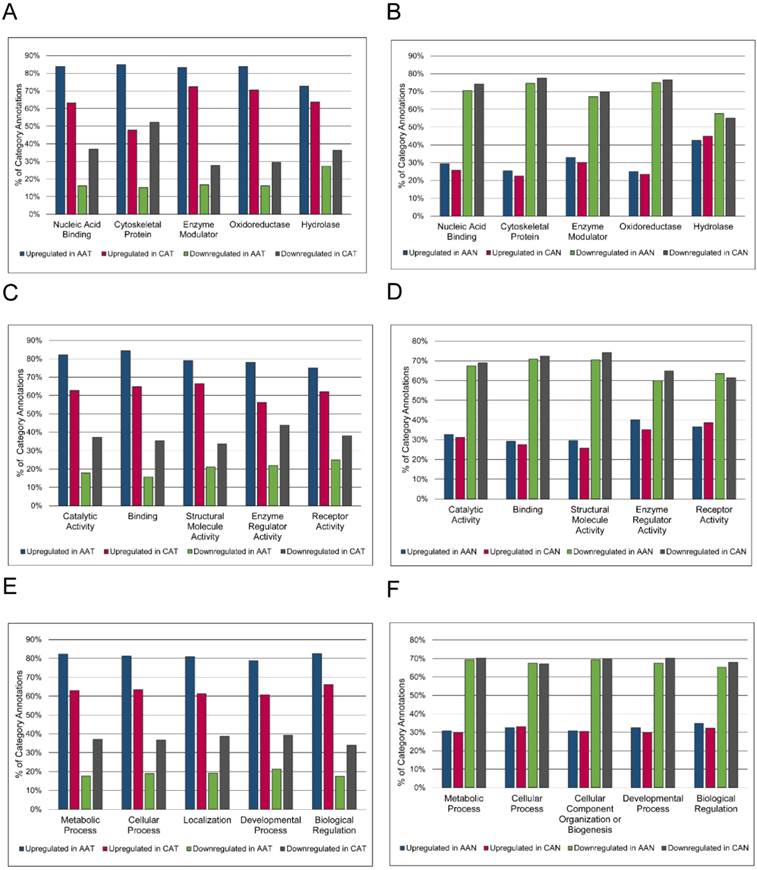
The label “Cytoskeletal Protein” included actin family cytoskeletal proteins, intermediate filament proteins, and microtubule family cytoskeletal proteins. The heading “Nucleic Acid Binding” included DNA-binding proteins, RNA-binding proteins, helicases, and nucleases. There were no striking differences in GO Molecular Function or Biological Process annotations between AA and CA tumors (Figures 3C and 3E). The percentages of upregulated and downregulated proteins in PANTHER Protein Class and GO Molecular Function and GO Biological Process were similar between AA and CA non-malignant samples (Figures 3B, 3D, and 3F). The overrepresentation of particular PANTHER protein classes and GO annotations was assessed and compared between races, pulling out those protein classes and GO annotations that were not overrepresented in both AA and CA tumors. This list was further whittled down by removing protein classes and GO annotations that were overrepresented in both AA tumor and non-malignant samples, as these differences were likely due to race regardless of disease status. The results showed enrichment of structural components (“Cytoskeletal Proteins” and “Extracellular Matrix Protein” PANTHER protein classes, and “Biological Adhesion” GO Biological Process) and catalytic activity (“Hydro-lyase activity”, “Peroxidase activity”, and “Peptidase Inhibitor Activity”) in AA compared to CA tumors (Table 5). The complete overrepresentation results can be found in the Supplementary Materials (Table S5).
Differences in overrepresented proteins between African-American and Caucasian American tumors.
| Protein Class, Gene Ontology Molecular Function, or Gene Ontology Biological Process | Fold Enrichment | Q-value |
|---|---|---|
| *Actin binding motor protein (Cytoskeletal Protein) | 4.63 | 1.51E-04 |
| *Extracellular matrix structural protein (Extracellular Matrix Protein) | 3.42 | 1.07E-02 |
| *Complement component (Defense/Immunity Protein) | 4.08 | 1.16E-02 |
| *mRNA processing factor (Nucleic Acid Binding) | 2.4 | 3.04E-02 |
| *Ubiquitin-protein ligase (Ligase) | < 0.2 | 4.29E-02 |
| *Calcium ion binding (Binding) | 2.16 | 2.27E-05 |
| *Calmodulin binding (Binding) | 2.46 | 6.48E-05 |
| *Hydro-lyase activity (Catalytic Activity) | 4.25 | 3.17E-03 |
| *Peroxidase activity (Catalytic Activity) | > 5 | 6.10E-03 |
| *mRNA binding (Binding) | 2.69 | 7.29E-03 |
| *Extracellular matrix structural constituent (Structural Molecule Activity) | 3.42 | 8.90E-03 |
| *Peptidase inhibitor activity (Catalytic Activity) | 2.23 | 1.41E-02 |
| *Muscle contraction (Multicellular Organismal Process) | 2.72 | 7.15E-05 |
| *Cell adhesion (Biological Adhesion) | 1.77 | 6.48E-03 |
| *Regulation of liquid surface tension (Biological Regulation) | 4.03 | 7.25E-03 |
| *Regulation of catalytic activity (Biological Regulation) | 1.54 | 7.42E-03 |
| *RNA splicing, via transesterification reactions (Metabolic Process) | 2.76 | 9.74E-03 |
| *RNA splicing (Metabolic Process) | 2.7 | 1.33E-02 |
| *Regulation of molecular function (Biological Regulation) | 1.5 | 1.59E-02 |
| *System process (Multicellular Organismal Process) | 1.45 | 2.33E-02 |
| *Homeostatic process (Biological Regulation) | 2.24 | 2.87E-02 |
| *Oxidative phosphorylation (Metabolic Process) | 3.72 | 3.01E-02 |
| *Segment specification (Developmental Process) | < 0.2 | 4.22E-02 |
| †Anion channel (Transporter) | > 5 | 4.63E-02 |
| †Oxidase (Oxidoreductase) | 2.59 | 3.07E-02 |
| †Translation initiation factor (Nucleic Acid Binding) | 3.76 | 6.94E-03 |
| †Translation initiation factor activity (Binding) | 3.29 | 2.77E-03 |
| †Anion channel activity (Transporter Activity) | > 5 | 1.52E-02 |
| †Transferase activity, transferring acyl groups (Catalytic Activity) | 2.38 | 2.13E-02 |
| †Aminoacyl-tRNA ligase activity (Catalytic Activity) | > 5 | 3.10E-02 |
| †Cellular amino acid metabolic process (Metabolic Process) | 2.42 | 4.57E-04 |
| †Purine nucleobase metabolic process (Metabolic Process) | 3.43 | 3.74E-03 |
| †Response to toxic substance (Response to Stimulus) | 3.8 | 2.44E-02 |
Q-values have been adjusted using a Bonferroni correction. *Overrepresented in AA but not CA tumors. † Overrepresented in CA but not AA tumors.
GSEA analysis was run comparing AA and CA tumor samples, with 5 gene sets showing enrichment in AA tumor samples (Table 6). The Agrin in Postsynaptic Differentiation pathway gene set is composed of 36 members, 12 of which were expressed in the dataset studied. Laminin alpha 4, dystroglycan 1, integrin beta 1, dystrophin, laminin alpha 2, cell division cycle 42, integrin alpha 1, p21 protein (Cdc42/Rac)-activated kinase 4, and utrophin contributed to the enrichment in AA tumor samples. Of the 14 members comprising the Platelet Amyloid Precursor Protein pathway, 8 were identified in the dataset and collagen type IV alpha 2, coagulation factor II/thrombin, plasminogen, and coagulation factor IX contributed to pathway enrichment. Enrichment of the Intrinsic pathway was due to the expression of collagen type IV alpha 2, thrombin, coagulation factor IX, coagulation factor X, fibrinogen beta chain, serpin peptidase inhibitor, clade G (C1 inhibitor) member 1, and fibrinogen gamma chain. A total of 12 proteins belonging to this pathway of 23 were expressed in the dataset. Both the Small Cell Lung Cancer pathway and the Neuroactive Ligand-Receptor Interaction pathways were enriched in AA tumors compared to CA tumors. 14 of 86 proteins in the Small Cell Lung Cancer gene set were expressed in the dataset, with laminin subunit beta 2, laminin subunit alpha 4, fibronectin 1, collagen type IV alpha 2, laminin subunit alpha 5, laminin subunit beta 1, laminin subunit gamma 1, and integrin beta 1 contributing to the enrichment in AA tumors. 5 of 275 of the proteins in the Neuroactive Ligand-Receptor Interaction pathway gene set were detected in the dataset with only thrombin and plasminogen contributing to its association in AA tumors.
Gene sets enriched in African-American tumor samples compared to Caucasian-American tumor samples.
| Gene Set | Size | ES | NES | P-value | Q-value |
|---|---|---|---|---|---|
| KEGG: Small Cell Lung Cancer | 14 | 0.733 | 1.722 | 2.16E-02 | 1.67E-01 |
| BioCarta: Platelet-Amyloid Precursor Protein Pathway | 8 | 0.684 | 1.638 | 1.36E-02 | 1.82E-01 |
| BioCarta: Agrin Pathway | 12 | 0.503 | 1.505 | 5.63E-02 | 2.02E-01 |
| KEGG: Neuroactive Ligand-Receptor Interaction | 5 | 0.988 | 1.573 | 4.03E-03 | 2.18E-01 |
| BioCarta: Intrinsic Pathway | 12 | 0.619 | 1.537 | 4.70E-02 | 2.36E-01 |
Size = total number of genes in pathway, ES = enrichment score, NES = normalized enrichment score, P-value = probability of significance after permutation, Q-value = false discovery rate-adjusted P-value.
Discussion
In prostate cancer, pathway analysis based on gene expression data has been important for understanding molecular mechanisms of the disease [17, 41, 50-52]. By combining profiling and pathway approaches, the current study moves beyond detecting differences in the expression of individual proteins to detecting pathways associated with cancer. Through proteomic analysis, 48 DEPs between malignant and non-malignant prostate tissue were identified: 45 of them associated with cancer and 3 associated with non-malignant samples. Of particular interest were the upregulation and enrichment of fatty acid metabolism proteins fatty acid synthase and epidermal fatty acid binding protein, both of which have oncogenic potential.
Overexpression of fatty acid synthase in prostate cancer has been well documented [53-56] and was confirmed in this report. Fatty acid synthase catalyzes the reaction producing palmitate from acetyl-CoA and malonyl Co-A [57]. Fatty acids are important for building membranes and regulating genes through post-translational modification, and the synthesis of fatty acids generates second messengers used in signaling pathways [57]. Inhibition of fatty acid synthase suppressed the growth of multiple prostate cancer cell lines, including castration-resistant prostate cancer cells, via both androgen receptor-dependent and independent mechanisms [58]. The oncogenic potential of fatty acid synthase has also been demonstrated. Injection of prostate epithelial cells expressing both fatty acid synthase and androgen receptor into immunodeficient mice resulted in tumor growth, partially through suppression of apoptosis [59]. Theories to explain the role of fatty acid synthase in tumor survival include 1) the synthesis of fatty acid chains generates oxidative power in an anaerobic environment to balance redox conditions; 2) the activation of some oncogenes occurs by palmitoylation; 3) fatty acid synthase alters membrane phospholipid composition and thus affects signaling; and 4) fatty acid synthase may help preserve function of the endoplasmic reticulum (reviewed in [57, 60]).
Epidermal fatty acid binding protein gene transcripts and protein expression were upregulated in prostate cancer [61-63]. The roles of fatty acid binding proteins include uptake and transport of long-chain fatty acids, gene regulation, differentiation, and cell growth [64]. Epidermal fatty acid binding protein affects cell proliferation by delivering ligands to the nuclear peroxisome proliferator activated receptor β/δ (PPARβ/δ), which regulates cell survival and proliferation genes [65, 66]. The association of epidermal fatty acid binding protein and PPARγ also has prognostic significance, namely reduced patient survival [67]. Downregulation of epidermal fatty acid binding protein inhibited the growth of prostate cancer cells [68], and tumorigenicity [62, 63]. Furthermore, epidermal fatty acid binding protein expression was associated with metastasis and may also be a contributing factor to its development [69, 70].
Other interesting observations were the downregulation of cytokeratins 7 and 17 and the upregulation of aldehyde dehydrogenase family 1 member A3 (ALDH1A3) in human prostate cancer tissues compared to the non-malignant samples. Expression of cytokeratin 7 is not frequent in prostate adenocarcinomas; several immunohistochemical analyses showed positive staining in 0% to 25% of prostate cancer cases [71-75]. Furthermore, the percentage of cytokeratin 7-positive cases increased with increasing Gleason score [76], but a separate review found no significant differences between the number of cytokeratin 7-positive primary and metastatic tumors [77]. Considering the patients in this study all had Gleason score ≤ 7, the downregulation of cytokeratin 7 in tumor samples is consistent with previous observations. While cytokeratin 7 immunoreactivity is typically negative in tumor samples, luminal cells of non-malignant tissue, rather than basal cells, stained positive for cytokeratin 7 [78]. Similarly, cytokeratin 17 immunoreactivity is also negative in prostate cancer [76, 79]. As an epithelial marker, the loss of cytokeratin expression is suggestive of epithelial-mesenchymal transition in other cancers [80-82]. ALDH1A3 is important in the production of retinoic acid and the metabolism of acetaldehyde produced from oxidation of ethanol, of amino acids, and lipid peroxidation products, the detoxification of exogenous molecules, and the regulation of apoptosis [83]. Similar to this study, ALDH1A3 expression was increased in prostate cancer tumors [84]. ALDH1A3 is androgen regulated in LNCaP cell lines [85]. ALDH1A3 may be a cancer stem cell marker in breast cancer, lung cancer, and melanoma, as cells expressing aldehyde dehydrogenase family 1 member A3 also displayed other cancer stem cell characteristics or were more tumorigenic [86-88].
The results of this study also suggest that the proteins of the MTA3 pathway may be of significance in prostate cancer. The MTA3 pathway, which is based on experimental evidence in breast cancer, describes the silencing of estrogen receptor-regulated genes through MTA1/3 activity. Cadherin-1 and cathepsin D contributed to the enrichment of this pathway in tumor samples, although neither was differentially expressed (Table S2). Cadherins such as cadherin-1 are involved in stabilizing cell adhesion, epithelial-to-mesenchymal transition, and signaling [89]. The loss of cadherin-1 mRNA and protein in prostate cancer and bone metastases has been demonstrated [90-92]. Cathepsin D is a lysosomal proteinase whose expression and activity were greater in prostate cancer compared to normal samples [93-95]. Cathepsin D overexpression in cancer associated fibroblasts promoted the motility and invasive growth of prostate epithelial cells [96]. Both cadherin-1 and cathepsin D are regulated by estrogen/estrogen receptor [97, 98] indicating a possible role of these two proteins in androgen-independent prostate cancer that may still respond to estrogens. It must be clarified that none of the regulatory elements of the MTA3 pathway (e.g., MTA1, MTA3 or Snail) were detected in the dataset, only targets of the estrogen receptor. This raises the possibility that another pathway with overlapping components may be active and responsible for the expression of cadherin-1 and cathepsin D. Further, there is very little literature establishing the mechanism of MTA3 in prostate cancer, although MTA1 is well-studied [99]. The relevance of this MTA3 pathway in prostate cancer requires additional study.
Because of racial disparities in prostate cancer incidence and mortality, interracial comparisons of the specimen were also performed. There were no statistically significant differences in protein expression of tumor samples or non-malignant samples of AA and CA patients at the 10% FDR threshold. Relaxing the stringency to 13% FDR, however, resulted in 22 proteins being differentially expressed. In this particular study, it is likely that the small sample size was not sufficiently powered to detect differences. However, this case study provides an opportunity to evaluate whether the pathway approach may be informative even in a small sample size. Despite not identifying racial differences in protein expression among AA and CA prostate cancer samples, five pathways were identified as significantly enriched in AA tumors. These pathways were the Small Cell Lung Cancer, Platelet-Amyloid Precursor Protein, Agrin, Neuroactive Ligand-Receptor Interaction, and Intrinsic pathways. The Platelet-Amyloid Precursor Protein, Intrinsic, and Neuroactive-Ligand receptor pathways were linked by clotting proteins (coagulation factor IX, coagulation factor X, fibrinogen beta chain, fibrinogen gamma chain) and proteases/protease inhibitors (thrombin, plasminogen, serpin peptidase inhibitor, clade G (C1 inhibitor) member 1). The Small Cell Lung Cancer and Agrin pathways were heavily populated by type IV collagens (alpha 1, alpha 2, alpha 6), laminins (alpha 4, alpha 2, beta 2, alpha 5, gamma 2, alpha 1, beta 1), and integrins (beta 1, alpha 1, alpha 2). Collagens and laminins are important components of the basement membrane, while integrins bind to basement membrane components with substrate-specific preference and link the extracellular matrix and actin cytoskeleton [100-102]. Together these molecules regulate cell adhesion, anchorage-independent growth, proliferation, migration, differentiation, signaling survival, and chemoresistance [103-105].
Type IV collagen, laminin alpha 1, laminin beta 1, and laminin beta 2, and integrin beta 1 proteins can be found in the basement membrane of prostate tumors [106, 107], and increasing expression of collagen type IV alpha 1 and laminin beta 1 genes was detected in high-grade and metastatic prostate lesions [108]. While collagen type IV alpha 1 and type IV alpha 2 are expressed in normal basement membrane of many tissues and maintained in prostate cancer, collagen type IV alpha 6 is lost from the basement membrane of invasive prostate carcinomas [109, 110]. Decreased expression of collagen type IV alpha 6 also correlated with metastasis and death [111]. Altered integrin expression is well-documented in prostate cancer and includes not only downregulation, but aberrant expression patterns [103]. Integrin alpha 2 was lost in prostate adenocarcinomas but upregulated in metastatic lesions [106, 112], whereas integrin beta 1 was associated with prostate cancer [107, 113-115]. Laminin gamma 2 expression was also lost in prostate carcinoma tissue [114]. The increase in collagen expression, decrease in laminin expression (all but laminin alpha 2), and increase in integrin expression (all but integrin alpha 1) among tumor samples was not statistically significant (Table S2). However, finding the enrichment of pathways containing basement membrane, cytoskeletal, and extracellular matrix components reflects the qualitative overrepresentation results for AA and CA tumors. Differences in stromal expression of collagen, laminin, and integrin genes were prominent between AA and CA prostate cancer in other studies [32].
Overall, this study confirmed the up-regulation of FASN and FABP5 in prostate cancer. This study demonstrated that pathway approaches may be useful in studying racial disparities in small patient cohorts. However, these results must be viewed cautiously as there were no true statistical differences in individual proteins between racial groups.
Supplementary Material
Additional File 1Table S1.
Table S2.
Table S3.
Table S4.
Table S5.
Abbreviations
AA: African American; ALDH1A3: aldehyde dehydrogenase family 1 member A3; CA: Caucasian American; DEP: differentially expressed protein; FASN: fatty acid synthase; FABP5: fatty acid binding protein 5; FDR: false discovery rate; GO: Gene Ontology; GSEA: Gene Set Enrichment Analysis; KEGG: Kyoto Encyclopedia of Genomes and Genomes; MTA3: metastasis associated 1 family member 3; Log2: base 2 logarithm; PANTHER: Protein ANalysis THrough Evolutionary Relationships; SPIA: Signaling Pathway Impact Analysis; LC: liquid chromatography; LTQ: linear trap quadrupole; MS: mass spectrometry.
Acknowledgements
The authors would like to thank Dr. Kenneth Iczkowski for his assistance in pairing patient samples, Dr. Zhenbang Chen for providing tissue samples, Dr. Kate Calvin and Dr. Rakesh Singh of the Translational Science Laboratory at the Florida State University Medical School for mass spectrometry assistance, and Charles J. Robbins for technical assistance. This work was in part supported by the Leslie N. Wilson-Delores Auzenne Graduate Assistantship for Minorities awarded to JSM by the Florida State University Graduate School, the Research Experience Program of Women in Math, Science, and Engineering of Florida State University to AKVL, and grants from the Florida State University and an Endowed Chair Professorship in Cancer Research from anonymous donors to QXAS. The funders had no role in study design, data collection and analysis, decision to publish, or preparation of the manuscript.
Competing Interests
The authors have declared that no competing interest exists.
References
1. Siegel RL, Miller KD, Jemal A. Cancer statistics, 2015. CA Cancer J Clin. 2015;65:5-29
2. Meehan KL, Holland JW, Dawkins HJS. Proteomic analysis of normal and malignant prostate tissue to identify novel proteins lost in cancer. Prostate. 2002;50:54-63
3. Petricoin EF 3rd, Ornstein DK, Paweletz CP. et al. Serum proteomic patterns for detection of prostate cancer. J Natl Cancer Inst. 2002;94:1576-1578
4. Varambally S, Yu J, Laxman B. et al. Integrative genomic and proteomic analysis of prostate cancer reveals signatures of metastatic progression. Cancer Cell. 2005;8:393-406
5. Lin J, Xu J, Tian H. et al. Identification of candidate prostate cancer biomarkers in prostate needle biopsy specimens using proteomic analysis. Int J Cancer. 2007;121:2596-2605
6. Garbis SD, Tyritzis SI, Roumeliotis T. et al. Search for potential markers for prostate cancer diagnosis, prognosis and treatment in clinical tissue specimens using amine-specific isobaric tagging (iTRAQ) with two-dimensional liquid chromatography and tandem mass spectrometry. J Proteome Res. 2008;7:3146-3158
7. Jayapalan JJ, Ng KL, Razack AH. et al. Identification of potential complementary serum biomarkers to differentiate prostate cancer from benign prostatic hyperplasia using gel- and lectin-based proteomics analyses. Electrophoresis. 2012;33:1855-1862
8. Rehman I, Evans CA, Glen A. et al. iTRAQ identification of candidate serum biomarkers associated with metastatic progression of human prostate cancer. PLoS One. 2012;7:e30885
9. Davalieva K, Kostovska IM, Kiprijanovska S. et al. Proteomics analysis of malignant and benign prostate tissue by 2D DIGE/MS reveals new insights into proteins involved in prostate cancer. Prostate. 2015;75:1586-1600
10. Ahram M, Best CJM, Flaig MJ. et al. Proteomic analysis of human prostate cancer. Mol Carcinog. 2002;33:9-15
11. Zhang M, Yao C, Guo Z. et al. Apparently low reproducibility of true differential expression discoveries in microarray studies. Bioinformatics. 2008;24:2057-2063
12. Chen J, Wang Y, Shen B. et al. Molecular signature of cancer at gene level or pathway level? Case studies of colorectal cancer and prostate cancer microarray data. Comput Math Methods Med. 2013;2013:909525
13. Rhodes DR, Barrette TR, Rubin MA. et al. Meta-analysis of microarrays: Interstudy validation of gene expression profiles reveals pathway dysregulation in prostate cancer. Cancer Res. 2002;62:4427-4433
14. Tian L, Greenberg SA, Kong SW. et al. Discovering statistically significant pathways in expression profiling studies. Proc Natl Acad Sci U S A. 2005;102:13544-13549
15. Manoli T, Gretz N, Gröne H. et al. Group testing for pathway analysis improves comparability of different microarray datasets. Bioinformatics. 2006;22:2500-2506
16. Lee E, Chuang HY, Kim JW. et al. Inferring pathway activity toward precise disease classification. PLoS Comput Biol. 2008;4:e1000217
17. Wang Y, Chen J, Li Q. et al. Identifying novel prostate cancer associated pathways based on integrative microarray data analysis. Comput Biol Chem. 2011;35:151-158
18. Jones S, Zhang X, Parsons DW. et al. Core signaling pathways in human pancreatic cancers revealed by global genomic analyses. Science. 2008;321:1801-1806
19. American Cancer Society. Cancer facts & figures 2015. Atlanta: American Cancer Society. 2015
20. Vijayakumar S, Winter K, Sause W. et al. Prostate-specific antigen levels are higher in African-American than in white patients in a multicenter registration study: Results of RTOG 94-12. Int J Radiat Oncol Biol Phys. 1998;40:17-25
21. Zhang H, Messing EM, Travis LB. et al. Age and racial differences among PSA-detected (AJCC stage T1cN0M0) prostate cancer in the U.S.: A population-based study of 70,345 men. Front Oncol. 2013;3:312
22. Moul JW, Sesterhenn IA, Connelly RR. et al. Prostate-specific antigen values at the time of prostate cancer diagnosis in African-American men. JAMA. 1995;274:1277-1281
23. Pettaway CA, Troncoso P, Ramirez EI. et al. Prostate specific antigen and pathological features of prostate cancer in black and white patients: A comparative study based on radical prostatectomy specimens. J Urol. 1998;160:437-442
24. Powell IJ, Bock CH, Ruterbusch JJ. et al. Evidence supports a faster growth rate and/or earlier transformation to clinically significant prostate cancer in black than in white American men, and influences racial progression and mortality disparity. J Urol. 2010;183:1792-1797
25. Farrell J, Young D, Chen Y. et al. Predominance of ERG-negative high-grade prostate cancers in African American men. Mol Clin Oncol. 2014;2:982-986
26. Hoffman RM, Gilliland FD, Eley JW. et al. Racial and ethnic differences in advanced-stage prostate cancer: The prostate cancer outcomes study. J Natl Cancer Inst. 2001;93:388-395
27. Tsivian M, Banez LL, Keto CJ. et al. African-American men with low-grade prostate cancer have higher tumor burdens: Results from the Duke prostate center. Prostate Cancer Prostatic Dis. 2013;16:91-94
28. Sanchez-Ortiz RF, Troncoso P, Babaian RJ. et al. African-American men with nonpalpable prostate cancer exhibit greater tumor volume than matched white men. Cancer. 2006;107:75-82
29. Yamoah K, Walker A, Spangler E. et al. African-American race is a predictor of seminal vesicle invasion after radical prostatectomy. Clin Genitourin Cancer. 2015;13:e65-72
30. Yamoah K, Deville C, Vapiwala N. et al. African American men with low-grade prostate cancer have increased disease recurrence after prostatectomy compared with Caucasian men. Urol Oncol. 2015;33:70.e15-70.e22
31. Farrell J, Petrovics G, McLeod DG. et al. Genetic and molecular differences in prostate carcinogenesis between African American and Caucasian American men. Int J Mol Sci. 2013;14:15510-15531
32. Kinseth MA, Jia Z, Rahmatpanah F. et al. Expression differences between African American and Caucasian prostate cancer tissue reveals that stroma is the site of aggressive changes. Int J Cancer. 2013;134:81-91
33. Powell IJ, Dyson G, Land S. et al. Genes associated with prostate cancer are differentially expressed in African American and European American men. Cancer Epidemiol Biomarkers Prev. 2013;22:891-897
34. Reams RR, Agrawal D, Davis MB. et al. Microarray comparison of prostate tumor gene expression in African-American and Caucasian American males: A pilot project study. Infect Agent Cancer. 2009;4:S3
35. Venkatesh K, Lajwanti D, Kiran SP. et al. Differentially expressed genes in tumors of prostate cancer in American patients with European and African origin. J Pharm Res. 2013;6:583-588
36. Wang BD, Yang Q, Ceniccola K. et al. Androgen receptor-target genes in African American prostate cancer disparities. Prostate Cancer. 2013;2013:763569
37. Wallace TA, Prueitt RL, Yi M. et al. Tumor immunobiological differences in prostate cancer between African-American and European-American men. Cancer Res. 2008;68:927-936
38. Polednak AP. Black-white differences in survival from late-stage prostate cancer. Ethn Dis. 2003;13:220-225
39. Wells TS, Bukowinski AT, Smith TC. et al. Racial differences in prostate cancer risk remain among US servicemen with equal access to care. Prostate. 2010;70:727-734
40. Godley PA, Schenck AP, Amamoo MA. et al. Racial differences in mortality among Medicare recipients after treatment for localized prostate cancer. J Natl Cancer Inst. 2003;95:1702-1710
41. Myers JS, von Lersner AK, Robbins CJ. et al. Differentially expressed genes and signature pathways of human prostate cancer. PLoS One. 2015;10:e0145322
42. Zaman N, Giannopoulos PN, Chowdhury S. et al. Proteomic-coupled-network analysis of T877A-androgen receptor interactomes can predict clinical prostate cancer outcomes between white (non-Hispanic) and African-American groups. PLoS One. 2014;9:e113190
43. Libes JM, Seeley EH, Li M. et al. Race disparities in peptide profiles of North American and Kenyan Wilms tumor specimens. J Am Coll Surg. 2014;218:707-720
44. Dillon ST, Bhasin MK, Feng X. et al. Quantitative proteomic analysis in HCV-induced HCC reveals sets of proteins with potential significance for racial disparity. J Transl Med. 2013;11:239-5876 -11-239
45. Wisniewski JR, Zougman A, Nagaraj N. et al. Universal sample preparation method for proteome analysis. Nat Methods. 2009;6:359-362
46. R Core Team. R: A language and environment for statistical computing. 2014; Version 3.1.2.
47. Mi H, Muruganujan A, Thomas PD. PANTHER in 2013: Modeling the evolution of gene function, and other gene attributes, in the context of phylogenetic trees. Nucleic Acids Res. 2013;41:D377-D386
48. Subramanian A, Tamayo P, Mootha VK. et al. Gene set enrichment analysis: A knowledge-based approach for interpreting genome-wide expression profiles. Proc Natl Acad Sci U S A. 2005;102:15545-15550
49. Tarca AL, Draghici S, Khatri P. et al. A novel signaling pathway impact analysis. Bioinformatics. 2009;25:75-82
50. Jia P, Liu Y, Zhao Z. Integrative pathway analysis of genome-wide association studies and gene expression data in prostate cancer. BMC Syst Biol. 2012;6(Suppl 3):S3-S13
51. Savli H, Szendroi A, Romics I. et al. Gene network and canonical pathway analysis in prostate cancer: A microarray study. Exp Mol Med. 2008;40:176-185
52. Grubb RL, Deng J, Pinto PA. et al. Pathway biomarker profiling of localized and metastatic human prostate cancer reveal metastatic and prognostic signatures. J Proteome Res. 2009;8:3044-3054
53. Shah US, Dhir R, Gollin SM. et al. Fatty acid synthase gene overexpression and copy number gain in prostate adenocarcinoma. Hum Pathol. 2006;37:401-409
54. Ashida S, Nakagawa H, Katagiri T. et al. Molecular features of the transition from prostatic intraepithelial neoplasia (PIN) to prostate cancer: Genome-wide gene-expression profiles of prostate cancers and PINs. Cancer Res. 2004;64:5963-5972
55. Rossi S, Graner E, Febbo P. et al. Fatty acid synthase expression defines distinct molecular signatures in prostate cancer. Mol Cancer Res. 2003;1:707-715
56. Swinnen JV, Roskams T, Joniau S. et al. Overexpression of fatty acid synthase is an early and common event in the development of prostate cancer. Int J Cancer. 2002;98:19-22
57. Zadra G, Photopoulos C, Loda M. The fat side of prostate cancer. Biochim Biophys Acta-Molecular and Cell Biology of Lipids. 2013;1831:1518-1532
58. Wen S, Niu Y, Lee SO. et al. Targeting fatty acid synthase with ASC-J9 suppresses proliferation and invasion of prostate cancer cells. Mol Carcinog. 2016 [Epub ahead of print]
59. Migita T, Ruiz S, Fornari A. et al. Fatty acid synthase: A metabolic enzyme and candidate oncogene in prostate cancer. J Natl Cancer Inst. 2009;101:519-532
60. Benedettini E, Nguyen P, Loda M. The pathogenesis of prostate cancer: From molecular to metabolic alterations. Diagn Histopathol. 2008;14:195-201
61. Kawaguchi K, Kinameri A, Suzuki S. et al. The cancer-promoting gene fatty acid-binding protein 5 (FABP5) is epigenetically regulated during human prostate carcinogenesis. Biochem J. 2016;473:449-461
62. Morgan EA, Forootan SS, Adamson J. et al. Expression of cutaneous fatty acid-binding protein (C-FABP) in prostate cancer: Potential prognostic marker and target for tumourigenicity-suppression. Int J Oncol. 2008;32:767-775
63. Adamson J, Morgan EA, Beesley C. et al. High-level expression of cutaneous fatty acid-binding protein in prostatic carcinomas and its effect on tumorigenicity. Oncogene. 2003;22:2739-2749
64. Storch J, Corsico B. The emerging functions and mechanisms of mammalian fatty acid-binding proteins. Annu Rev Nutr. 2008;28:73-95
65. Tan N-, Shaw NS, Vinckenbosch N. et al. Selective cooperation between fatty acid binding proteins and peroxisome proliferator-activated receptors in regulating transcription. Mol Cell Biol. 2002;22:5114-5127
66. Bao Z, Malki MI, Forootan SS. et al. A novel cutaneous fatty acid-binding protein-related signaling pathway leading to malignant progression in prostate cancer cells. Genes Cancer. 2013;4:297-314
67. Forootan FS, Forootan SS, Malki MI. et al. The expression of C-FABP and PPARgamma and their prognostic significance in prostate cancer. Int J Oncol. 2014;44:265-275
68. Morgan E, Kannan-Thulasiraman P, Noy N. Involvement of fatty acid binding protein 5 and PPARbeta/delta in prostate cancer cell growth. PPAR Res. 2010;2010:234629
69. Pang J, Liu WP, Liu XP. et al. Profiling protein markers associated with lymph node metastasis in prostate cancer by DIGE-based proteomics analysis. J Proteome Res. 2010;9:216-226
70. Jing C, Beesley C, Foster CS. et al. Human cutaneous fatty acid-binding protein induces metastasis by up-regulating the expression of vascular endothelial growth factor gene in rat Rama 37 model cells. Cancer Res. 2001;61:4357-4364
71. Bassily NH, Vallorosi CJ, Akdas G. et al. Coordinate expression of cytokeratins 7 and 20 in prostate adenocarcinoma and bladder urothelial carcinoma. Am J Clin Pathol. 2000;113:383-388
72. Genega EM, Hutchinson B, Reuter VE. et al. Immunophenotype of high-grade prostatic adenocarcinoma and urothelial carcinoma. Mod Pathol. 2000;13:1186-1191
73. Wang NP, Zee S, Zarbo RJ. et al. Coordinate expression of cytokeratins 7 and 20 defines unique subsets of carcinomas. Appl Immunohistochemistry. 1995;3:99-107
74. Heatley M, Maxwell P, Whiteside C. et al. Vimentin and cytokeratin expression in nodular hyperplasia and carcinoma of the prostate. J Clin Pathol. 1995;48:1031-1034
75. Chu P, Wu E, Weiss LM. Cytokeratin 7 and cytokeratin 20 expression in epithelial neoplasms: A survey of 435 cases. Mod Pathol. 2000;13:962-972
76. Goldstein NS. Immunophenotypic characterization of 225 prostate adenocarcinomas with intermediate or high Gleason scores. Am J Clin Pathol. 2002;117:471-477
77. Tot T. Cytokeratins 20 and 7 as biomarkers: Usefulness in discriminating primary from metastatic adenocarcinoma. Eur J Cancer. 2002;38:758-763
78. Okada H, Tsubura A, Okamura A. et al. Keratin profiles in normal/hyperplastic prostates and prostate carcinoma. Virchows Arch A Pathol Anat Histopathol. 1992;421:157-161
79. Sherwood ER, Berg LA, Mitchell NJ. et al. Differential cytokeratin expression in normal, hyperplastic and malignant epithelial cells from human prostate. J Urol. 1990;143:167-171
80. Korita PV, Wakai T, Ajioka Y. et al. Aberrant expression of vimentin correlates with dedifferentiation and poor prognosis in patients with intrahepatic cholangiocarcinoma. Anticancer Res. 2010;30:2279-2285
81. Huang RY, Guilford P, Thiery JP. Early events in cell adhesion and polarity during epithelial-mesenchymal transition. J Cell Sci. 2012;125:4417-4422
82. Xiao Y, Zhou Y, Chen Y. et al. The expression of epithelial-mesenchymal transition-related proteins in biliary epithelial cells is associated with liver fibrosis in biliary atresia. Pediatr Res. 2015;77:310-315
83. Duan J, Cai J, Guo Y. et al. ALDH1A3, a metabolic target for cancer diagnosis and therapy. Int J Cancer. 2016 [Epub ahead of print]
84. Casanova-Salas I, Masia E, Arminan A. et al. MiR-187 targets the androgen-regulated gene ALDH1A3 in prostate cancer. PLoS One. 2015;10:e0125576
85. Trasino SE, Harrison EH, Wang TT. Androgen regulation of aldehyde dehydrogenase 1A3 (ALDH1A3) in the androgen-responsive human prostate cancer cell line LNCaP. Exp Biol Med. 2007;232:762-771
86. Shao C, Sullivan JP, Girard L. et al. Essential role of aldehyde dehydrogenase 1A3 for the maintenance of non-small cell lung cancer stem cells is associated with the STAT3 pathway. Clin Cancer Res. 2014;20:4154-4166
87. Luo Y, Dallaglio K, Chen Y. et al. ALDH1A isozymes are markers of human melanoma stem cells and potential therapeutic targets. Stem Cells. 2012;30:2100-2113
88. Marcato P, Dean CA, Pan D. et al. Aldehyde dehydrogenase activity of breast cancer stem cells is primarily due to isoform ALDH1A3 and its expression is predictive of metastasis. Stem Cells. 2011;29:32-45
89. van Roy F, Berx G. The cell-cell adhesion molecule E-cadherin. Cell Mol Life Sci. 2008;65:3756-3788
90. Umbas R, Schalken JA, Aalders TW. et al. Expression of the cellular adhesion molecule E-cadherin is reduced or absent in high-grade prostate cancer. Cancer Res. 1992;52:5104-5109
91. Wang J, Krill D, Torbenson M. et al. Expression of cadherins and catenins in paired tumor and non-neoplastic primary prostate cultures and corresponding prostatectomy specimens. Urol Res. 2000;28:308-315
92. Pontes J Jr, Srougi M, Borra PM. et al. E-cadherin and beta-catenin loss of expression related to bone metastasis in prostate cancer. Appl Immunohistochem Mol Morphol. 2010;18:179-184
93. Cherry JP, Mordente JA, Chapman JR. et al. Analysis of cathepsin D forms and their clinical implications in human prostate cancer. J Urol. 1998;160:2223-2228
94. El Melegy NT, Aboulella HA, Abul-Fadl AM. et al. Potential biomarkers for differentiation of benign prostatic hyperplasia and prostate cancer. Br J Biomed Sci. 2010;67:109-112
95. Hara I, Miyake H, Yamanaka K. et al. Serum cathepsin D and its density in men with prostate cancer as new predictors of disease progression. Oncol Rep. 2002;9:1379-1383
96. Pruitt FL, He Y, Franco OE. et al. Cathepsin D acts as an essential mediator to promote malignancy of benign prostatic epithelium. Prostate. 2013;73:476-488
97. Fujita N, Jaye DL, Kajita M. et al. MTA3, a mi-2/NuRD complex subunit, regulates an invasive growth pathway in breast cancer. Cell. 2003;113:207-219
98. Rochefort H, Cavailles V, Augereau P. et al. Overexpression and hormonal regulation of pro-cathepsin D in mammary and endometrial cancer. J Steroid Biochem. 1989;34:177-182
99. Levenson AS, Kumar A, Zhang X. MTA family of proteins in prostate cancer: Biology, significance, and therapeutic opportunities. Cancer Metastasis Rev. 2014;33:929-942
100. Timpl R. Macromolecular organization of basement membranes. Curr Opin Cell Biol. 1996;8:618-624
101. Colognato H, Yurchenco PD. Form and function: The laminin family of heterotrimers. Dev Dyn. 2000;218:213-234
102. Desgrosellier JS, Cheresh DA. Integrins in cancer: Biological implications and therapeutic opportunities. Nat Rev Cancer. 2010;10:9-22
103. Goel HL, Li J, Kogan S. et al. Integrins in prostate cancer progression. Endocr Relat Cancer. 2008;15:657-664
104. Shattil SJ, Kim C, Ginsberg MH. The final steps of integrin activation: The end game. Nat Rev Mol Cell Biol. 2010;11:288-300
105. Aoudjit F, Vuori K. Integrin signaling in cancer cell survival and chemoresistance. Chemother Res Pract. 2012;2012:283181
106. Nagle RB, Knox JD, Wolf C. et al. Adhesion molecules, extracellular matrix, and proteases in prostate carcinoma. J Cell Biochem Suppl. 1994;19:232-237
107. Knox JD, Cress AE, Clark V. et al. Differential expression of extracellular matrix molecules and the alpha 6-integrins in the normal and neoplastic prostate. Am J Pathol. 1994;145:167-174
108. Pföhler C, Fixemer T, Jung V. et al. In situ hybridization analysis of genes coding collagen IV alpha1 chain, laminin beta1 chain, and S-laminin in prostate tissue and prostate cancer: Increased basement membrane gene expression in high-grade and metastatic lesions. Prostate. 1998;36:143-150
109. Dehan P, Waltregny D, Beschin A. et al. Loss of type IV collagen alpha 5 and alpha 6 chains in human invasive prostate carcinomas. Am J Pathol. 1997;151:1097-1104
110. Brown JC, Timpl R. The collagen superfamily. Int Arch Allergy Immunol. 1995;107:484-490
111. Varisli L. Identification of new genes downregulated in prostate cancer and investigation of their effects on prognosis. Genet Test Mol Biomarkers. 2013;17:562-566
112. Bonkhoff H, Stein U, Remberger K. Differential expression of alpha 6 and alpha 2 very late antigen integrins in the normal, hyperplastic, and neoplastic prostate: Simultaneous demonstration of cell surface receptors and their extracellular ligands. Hum Pathol. 1993;24:243-248
113. Cress AE, Rabinovitz I, Zhu W. et al. The alpha 6 beta 1 and alpha 6 beta 4 integrins in human prostate cancer progression. Cancer Metastasis Rev. 1995;14:219-228
114. Nagle RB, Hao J, Knox JD. et al. Expression of hemidesmosomal and extracellular matrix proteins by normal and malignant human prostate tissue. Am J Pathol. 1995;146:1498-1507
115. Lee YC, Jin JK, Cheng CJ. et al. Targeting constitutively activated beta1 integrins inhibits prostate cancer metastasis. Mol Cancer Res. 2013;11:405-417
Author contact
![]() Corresponding author: Qing-Xiang Amy Sang, Department of Chemistry & Biochemistry, Florida State University, Tallahassee, FL, USA. Tel.: 850-644-8683; Email: qxsangfsu.edu © Ivyspring International Publisher. Reproduction is permitted for personal, noncommercial use, provided that the article is in whole, unmodified, and properly cited. See http://ivyspring.com/terms for terms and conditions.
Corresponding author: Qing-Xiang Amy Sang, Department of Chemistry & Biochemistry, Florida State University, Tallahassee, FL, USA. Tel.: 850-644-8683; Email: qxsangfsu.edu © Ivyspring International Publisher. Reproduction is permitted for personal, noncommercial use, provided that the article is in whole, unmodified, and properly cited. See http://ivyspring.com/terms for terms and conditions.